Market Overview
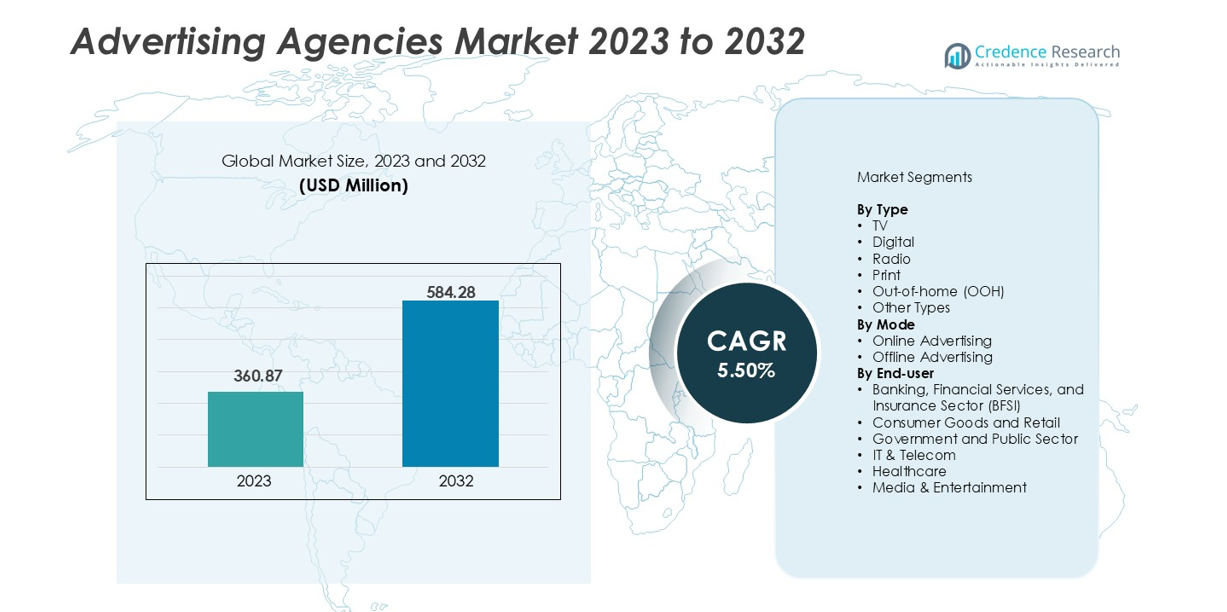
The Advertising Agencies Market was valued at USD 360.87 billion in 2023 and is projected to reach USD 584.28 billion by 2032, expanding at a CAGR of 5.50% during the forecast period.
| REPORT ATTRIBUTE |
DETAILS |
| Historical Period |
2020-2023 |
| Base Year |
2024 |
| Forecast Period |
2025-2032 |
| Advertising Agencies Market Size 2024 |
USD 360.87 billion |
| Advertising Agencies Market, CAGR |
5.50% |
| Advertising Agencies Market Size 2032 |
USD 584.28 billion |
The global Advertising Agencies Market is led by major players such as WPP PLC, Omnicom Group Inc., Dentsu Inc., Caveni Digital Solutions, Brand Burp Digital, and Titan SEO Group. These companies dominate through global client networks, advanced digital capabilities, and data-driven campaign strategies. WPP and Omnicom collectively account for nearly 21% of the global market share, supported by their diversified service portfolios and strategic acquisitions. North America remains the leading region, capturing around 30% of the total market, driven by the high concentration of global brands and strong demand for digital marketing, AI integration, and omnichannel advertising strategies.
Market Insights
- The Advertising Agencies Market was valued at USD 360.87 billion in 2023 and is expected to reach USD 584.28 billion by 2032, growing at a CAGR of 5.5%.
- Market growth is driven by digital transformation, rising social media penetration, and increased brand investments in data-driven campaigns.
- Emerging trends include the adoption of AI-powered analytics, automation in campaign management, and the expansion of influencer-based marketing across online platforms.
- The competitive landscape features key players such as WPP PLC, Omnicom Group Inc., Dentsu Inc., and Caveni Digital Solutions focusing on omnichannel and performance-based advertising models.
- North America leads with about 30% market share, followed by Asia-Pacific (25%) and Europe (22%); the digital segment dominates globally, accounting for nearly 52% of total market share in 2024.
Access crucial information at unmatched prices!
Request your sample report today & start making informed decisions powered by Credence Research Inc.!
Download Sample
Market Segmentation Analysis:
By Type
The digital advertising segment dominated the advertising agencies market in 2024, capturing nearly 52% of the total share. Its leadership is driven by the rapid expansion of social media, mobile marketing, and programmatic advertising. Brands are investing heavily in digital platforms like Google, Meta, and TikTok to enhance audience targeting and engagement. Rising internet penetration, data analytics integration, and measurable ROI have accelerated the shift from traditional to digital formats. Meanwhile, TV and out-of-home (OOH) advertising continue to maintain relevance in brand-building and large-scale awareness campaigns.
- For instance, Google and Meta continue to dominate the digital advertising market, commanding a massive scale for advertisers. In 2024, Meta reported annual advertising revenues of over $160 billion, serving millions of advertisers across its platforms like Facebook and Instagram.
By Mode
Online advertising accounted for the largest share, holding approximately 61% of the global market in 2024. This dominance stems from the growing adoption of digital-first strategies by enterprises seeking real-time audience interaction and cost efficiency. E-commerce expansion, search engine optimization, and influencer collaborations are boosting online ad spending. Automation tools, AI-driven campaign management, and data-based personalization further enhance campaign performance. In contrast, offline advertising, including print, radio, and outdoor displays, remains vital for regional and brand recall marketing, especially in emerging economies.
- For instance, in 2024, Amazon’s DSP and TikTok’s Creator Marketplace remained high-growth, high-volume platforms for programmatic advertising and brand partnerships, respectively.
By End-user
The consumer goods and retail segment led the market with about 33% share in 2024, supported by consistent advertising investments from FMCG and e-commerce brands. Companies like Procter & Gamble, Unilever, and Amazon are leveraging multi-channel campaigns to enhance visibility and drive consumer loyalty. The sector benefits from dynamic marketing through social media, targeted digital ads, and experiential promotions. The BFSI and IT & telecom sectors also contribute significantly, adopting performance-based and omnichannel campaigns to strengthen customer acquisition and digital service awareness.
Key Growth Drivers
Rapid Digital Transformation Across Industries
The shift toward digital-first business models is a major driver for the advertising agencies market. Companies in retail, finance, and media are increasing their digital ad budgets to enhance audience targeting and brand engagement. The widespread use of smartphones and social media platforms has transformed advertising into a data-driven discipline. Agencies are adopting AI-based analytics, programmatic advertising, and real-time bidding to optimize campaign efficiency. Global e-commerce expansion and rising online content consumption further amplify digital ad investments, positioning agencies as critical partners in brand performance and online visibility enhancement.
- For instance, in 2024, the global digital advertising landscape continued to expand, with Amazon’s advertising revenue reaching approximately $56 billion. This growth was driven by its ability to deliver personalized ad experiences across its e-commerce ecosystem.
Rising Demand for Personalized and Data-Driven Marketing
Advertisers are prioritizing data analytics to design personalized campaigns tailored to consumer behavior. The availability of detailed user data from social media, search engines, and streaming platforms allows agencies to create targeted and measurable marketing strategies. This personalization enhances customer retention, conversion rates, and brand loyalty. Agencies now employ predictive analytics, CRM tools, and AI-driven automation to track engagement metrics and optimize ROI. The growing reliance on audience insights also fuels partnerships between agencies and technology providers to strengthen data integration and cross-platform performance tracking.
- For instance, both Adobe Experience Cloud and Salesforce Marketing Cloud operate at an enormous scale, processing trillions of data points and messages annually to enable personalized customer experiences. Adobe’s platforms, including the Real-Time Customer Data Platform, are built to handle massive volumes of data for personalized advertising and digital experiences.
Expanding Brand Investments in Emerging Markets
The rapid economic growth in Asia-Pacific, Latin America, and Africa is driving brand advertising expenditures. Rising urbanization, expanding middle-class populations, and increasing internet access are creating new consumer bases. Global companies are partnering with local advertising agencies to customize content and align with cultural preferences. Governments promoting digitalization and small business marketing initiatives further boost agency demand. The rise of regional e-commerce platforms and digital payment systems encourages multinational brands to invest in localized advertising, leading to a surge in cross-border campaign collaborations and multilingual digital content creation.
Key Trends & Opportunities
Integration of Artificial Intelligence and Automation
AI and automation are reshaping how advertising agencies plan, execute, and analyze campaigns. Machine learning algorithms enable predictive audience segmentation and optimize ad placement in real time. Chatbots, automated bidding systems, and AI-driven creative generation enhance customer engagement while reducing operational costs. Agencies adopting automation tools like Google Ads’ Performance Max or Meta’s Advantage+ are improving efficiency and achieving measurable outcomes. This technological integration presents a strong opportunity for agencies to offer data-backed solutions that improve accuracy, scalability, and client satisfaction, driving long-term competitive advantages in digital advertising.
- For instance, Google and Meta rely heavily on AI-powered automation to drive their advertising platforms, such as Google’s Performance Max and Meta’s Advantage+. The companies use their AI to optimize ad campaigns by processing vast amounts of user data in real time, making rapid adjustments to targeting, placements, and bidding.
Growth of Influencer and Content Marketing Ecosystems
Influencer marketing has evolved into a mainstream advertising channel, offering brands authentic connections with niche audiences. Agencies are increasingly managing influencer partnerships, social media collaborations, and content creation strategies to boost engagement. Platforms such as Instagram, YouTube, and TikTok enable personalized brand storytelling and real-time interaction. The trend also extends to micro-influencers, who deliver higher engagement rates at lower costs. This shift offers agencies opportunities to expand service portfolios, integrate analytics-driven influencer selection, and capitalize on growing demand for user-generated and interactive content formats.
Key Challenges
Rising Competition and Market Saturation
The advertising market is facing intense competition, with global firms, regional agencies, and in-house marketing teams all vying for clients. Large technology companies are offering self-service advertising tools, reducing dependency on traditional agencies. This saturation challenges profitability and differentiation among service providers. Agencies must balance cost efficiency with creative innovation to maintain value propositions. Additionally, constant technological evolution demands ongoing investment in new tools and staff training. Sustaining client relationships through measurable ROI and unique creative strategies has become crucial for long-term survival in this crowded landscape.
Data Privacy and Regulatory Constraints
Stricter data protection laws, including GDPR in Europe and CCPA in the U.S., are reshaping digital advertising practices. Agencies must now ensure transparency in data collection and user consent, which complicates targeting and personalization. The phase-out of third-party cookies further limits access to user behavior data, forcing agencies to rely on first-party and contextual data strategies. Compliance costs are increasing as agencies adopt new cybersecurity and governance frameworks. Navigating this complex regulatory environment while maintaining effective audience engagement poses a significant challenge, especially for smaller and mid-sized advertising firms.
Regional Analysis
North America
North America commands the largest share of the advertising agencies market, estimated at around 30 % in 2023. The U.S. market leads due to high digital ad spending, advanced marketing infrastructure, and strong agency networks. Clients demand integrated omni-channel campaigns, driving agencies to adopt programmatic tools, AI, and outcome-based models. Mature digital ecosystems and analytics adoption support sustained growth. However, market saturation pressures agencies to differentiate via niche expertise in data, creative content, and specialty services (e.g. influencer marketing and performance media).
Western & Eastern Europe
Together, Western and Eastern Europe account for approximately 20–22 % of the global advertising agencies market. Western Europe drives most of this share, led by the UK, Germany, and France, supported by mature media markets and regulatory sophistication. Agencies here emphasize brand building, high production value, and regulatory compliance (e.g., data privacy). Eastern Europe is growing faster from a lower base, fueled by rising digital adoption and international agency expansion. Cross-border campaigns and pan-European strategies remain key offerings in this region.
Asia-Pacific
Asia-Pacific captures about 25 % of the global advertising agencies market and is the fastest–growing region. China, India, Japan, South Korea, and Southeast Asia lead demand in both traditional and digital media. Mobile penetration, social commerce, and influencer marketing fuel agency growth. Brands localize content for diverse languages and cultures, prompting agencies to scale regional creative and analytics capabilities. Governments’ digital initiatives and rising e-commerce adoption further strengthen agency service demand across markets.
Latin America (South America)
Latin America holds about 8 % of the market. Brazil, Mexico, and Argentina dominate agency activity. Digital adoption among younger consumers drives investments in social media, programmatic video, and mobile ads. Agencies often manage multilingual campaigns and address regional ad delivery challenges (internet infrastructure, varied media consumption). Economic volatility and exchange rates pose constraints, but local brands’ growing digital budgets and global brand expansion into the region offer upside opportunities.
Middle East & Africa (MEA)
MEA accounts for roughly 7 % of the global advertising agencies market. The Gulf region (UAE, Saudi Arabia) leads in advertising spend with high per-capita digital media usage and government-led digital transformation. African markets grow from lower bases, supported by mobile-first audiences and rising social media consumption. Agencies service both global and domestic brands, often focusing on contextual and mobile ad formats. Infrastructure gaps and regulatory diversity present challenges, but digital leapfrogging and regional expansion are key growth levers.
Market Segmentations:
By Type
- TV
- Digital
- Radio
- Print
- Out-of-home (OOH)
- Other Types
By Mode
- Online Advertising
- Offline Advertising
By End-user
- Banking, Financial Services, and Insurance Sector (BFSI)
- Consumer Goods and Retail
- Government and Public Sector
- IT & Telecom
- Healthcare
- Media & Entertainment
By Geography
- North America
- Europe
- Germany
- France
- U.K.
- Italy
- Spain
- Rest of Europe
- Asia Pacific
- China
- Japan
- India
- South Korea
- South-east Asia
- Rest of Asia Pacific
- Latin America
- Brazil
- Mexico
- Rest of Latin America
- Middle East & Africa
- GCC Countries
- South Africa
- Rest of the Middle East and Africa
Competitive Landscape
The advertising agencies market features a mix of global holding firms, national players, and boutique specialists. Major holding companies such as WPP plc, Omnicom Group Inc., Dentsu Inc., and Publicis Groupe dominate with broad service portfolios, deep client relationships, and global footprints. These players compete on technology, end-to-end service integration, and scale economies. At the same time, local and specialized agencies (e.g. Caveni Digital Solutions, Brand Burp Digital, Plan Z) carve niche positions by focusing on digital marketing, SEO, social media campaigns, or regional domains. Consolidation through mergers and acquisitions, plus investments in AI, data platforms, and first-party data capabilities, intensifies rivalry. The battle for client retention shifts toward outcome-based billing, transparency, and measurable ROI, pressuring all agencies to continuously modernize their offerings.
Shape Your Report to Specific Countries or Regions & Enjoy 30% Off!
Key Player Analysis
Recent Developments
- In July 2023, Google Ads, a US-based advertising platform, introduced the Gen Z Music lineup, a globally available paid feature designed to assist advertisers in enhancing their connection with the 18- to 24-year-old demographic by leveraging data from audio, long-form, and YouTube shorts to identify trending music.
- In July 2022, Havas Group announced the beginning of a new chapter in its history by simplifying its organization and deeper integrating its Global Creative and Health Networks to better satisfy the ever-changing needs of businesses.
- In May 2022, Kantar, a UK-based marketing data and analytics company, launched Link AI for Digital. This is an artificial intelligence (AI) advertising testing tool designed for digital advertising formats
Report Coverage
The research report offers an in-depth analysis based on Type, Mode, End-user and Geography. It details leading market players, providing an overview of their business, product offerings, investments, revenue streams, and key applications. Additionally, the report includes insights into the competitive environment, SWOT analysis, current market trends, as well as the primary drivers and constraints. Furthermore, it discusses various factors that have driven market expansion in recent years. The report also explores market dynamics, regulatory scenarios, and technological advancements that are shaping the industry. It assesses the impact of external factors and global economic changes on market growth. Lastly, it provides strategic recommendations for new entrants and established companies to navigate the complexities of the market.
Future Outlook
- Digital-first advertising models will continue to dominate across all industry verticals.
- AI and machine learning will reshape campaign planning and audience targeting.
- Personalization will become central to improving consumer engagement and brand loyalty.
- Influencer marketing will expand, supported by micro and nano influencer partnerships.
- Agencies will invest more in automation and predictive analytics for better ROI tracking.
- Sustainability and ethical advertising will gain importance among global brands.
- Integration of AR and VR technologies will enhance immersive brand experiences.
- Data privacy compliance will remain a key operational focus for agencies.
- Emerging markets in Asia-Pacific and Africa will drive future growth momentum.
- Collaboration between creative agencies and technology firms will redefine service delivery.


