Market Overview
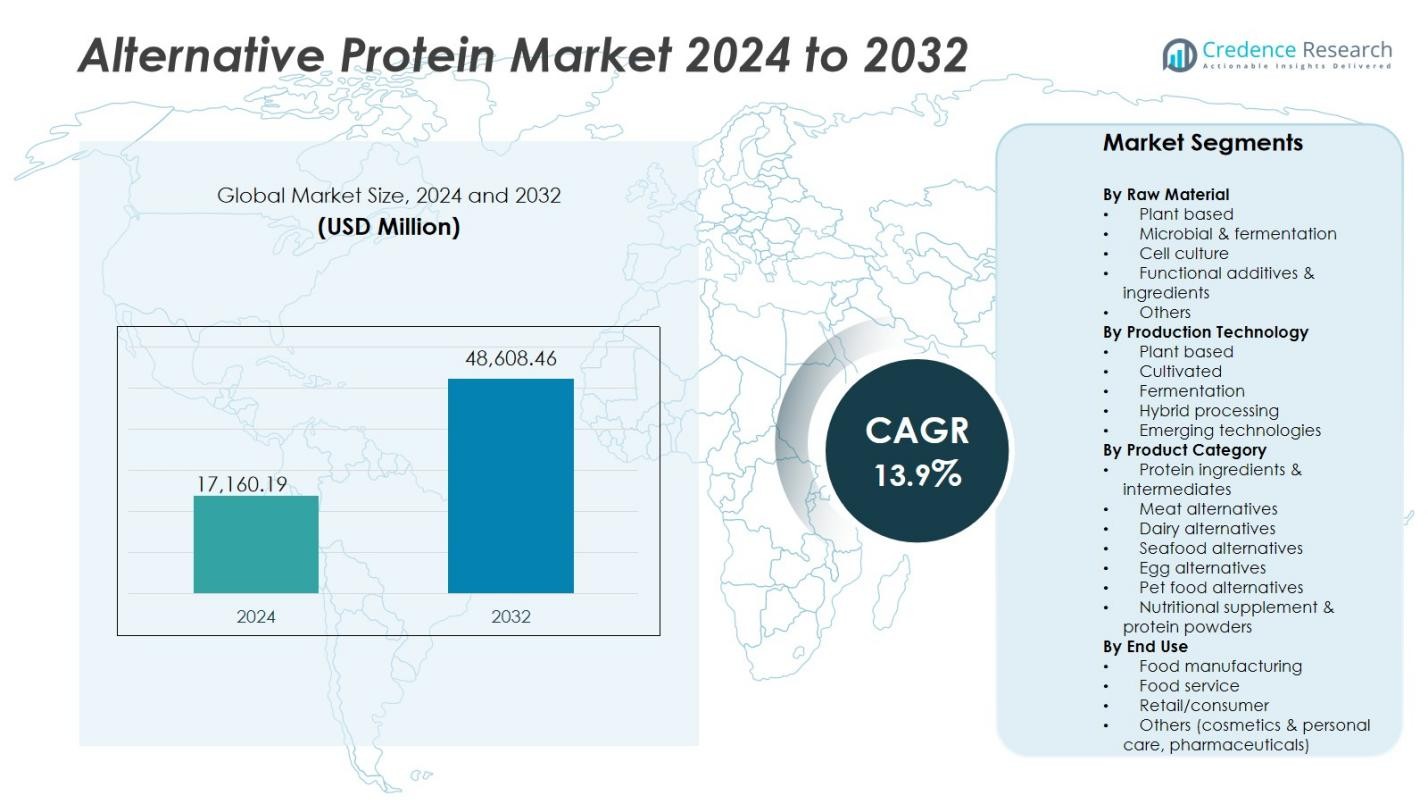
The Global Alternative Protein Market size was valued at USD 17,160.19 million in 2024 and is anticipated to reach USD 48,608.46 million by 2032, growing at a CAGR of 13.9% during the forecast period.
| REPORT ATTRIBUTE |
DETAILS |
| Historical Period |
2020-2023 |
| Base Year |
2024 |
| Forecast Period |
2025-2032 |
| Alternative Protein Market Size 2024 |
USD 17,160.19 Million |
| Alternative Protein Market, CAGR |
13.9% |
| Alternative Protein Market Size 2032 |
USD 48,608.46 Million |
The Global Alternative Protein Market is led by key players such as Nestlé S.A., Beyond Meat Inc., Impossible Foods Inc., Danone S.A., Aleph Farms Ltd., Eat Just Inc., Givaudan S.A., Ingredion Incorporated, Mosa Meat B.V., and Nature’s Fynd Inc. These companies are advancing innovation through investments in plant-based, microbial, and cultivated protein technologies to meet rising global protein demand. Strategic collaborations and large-scale production facilities are expanding their reach across food, beverage, and nutraceutical sectors. North America dominates the market with a 36% share, supported by strong consumer adoption and established manufacturing infrastructure, followed by Europe and the Asia-Pacific regions, which show robust growth potential through sustainability-driven food innovation.
Access crucial information at unmatched prices!
Request your sample report today & start making informed decisions powered by Credence Research Inc.!
Download Sample
Market Insights
- The Global Alternative Protein Market was valued at USD 17,160.19 million in 2024 and is projected to reach USD 48,608.46 million by 2032, growing at a CAGR of 13.9%.
- Rising demand for sustainable and nutritious food sources drives market growth as consumers shift from animal-based to eco-friendly proteins.
- Major trends include growing investments in fermentation and cultivated protein technologies, coupled with increasing adoption of hybrid and clean-label formulations.
- Market competition is intensifying among leading players such as Nestlé S.A., Beyond Meat Inc., and Impossible Foods Inc., focusing on product innovation and cost optimization.
- Regionally, North America leads with a 36% share, followed by Europe with 28% and Asia-Pacific with 23%, while plant-based raw materials hold the largest segment share of 54%.
Market Segmentation Analysis:
By Raw Material
Plant-based proteins hold the dominant share of 54% in the global alternative protein market. Their leadership stems from strong consumer acceptance, established supply chains, and versatile applications in meat and dairy substitutes. Companies are leveraging soy, pea, and wheat proteins to develop products with improved texture and nutritional value. The microbial and fermentation segment is expanding rapidly with precision fermentation enabling high-quality protein synthesis, while cell-cultured and functional additive categories are gaining traction for their sustainability benefits and innovation in nutrient fortification and clean-label formulations.
For instance, Roquette Frères leads innovation with its NUTRALYS® pea protein line, widely used in meat alternatives and functional beverages, and has expanded pea protein production in Canada to meet growing demand.
By Production Technology
Plant-based production accounts for 50% of the market share, driven by cost efficiency and mature processing methods. Advancements in extrusion, enzymatic hydrolysis, and flavor masking enhance taste and texture, encouraging broader adoption in mainstream food products. The cultivated and fermentation technologies follow, supported by investments in bioreactor capacity and microbial protein platforms. Hybrid processing, combining plant and cell-based components, is emerging as a key innovation area, while new technologies such as precision fermentation and synthetic biology promise to improve scalability and environmental performance.
For instance, Cargill has invested in PURIS, North America’s largest pea protein producer, leveraging advanced processing to ensure high-quality plant-based proteins for multiple food applications
By Product Category
The protein ingredients and intermediates segment leads the market with 32% share due to its extensive use in food and beverage manufacturing. These ingredients serve as the foundation for meat, dairy, and nutritional product formulations. Meat alternatives follow closely, fueled by demand for sustainable protein options that replicate conventional taste and texture. Dairy and seafood alternatives are also gaining ground, supported by lactose-free and ethical consumption trends. Pet food and nutritional supplement categories are emerging segments, benefiting from rising awareness of high-protein diets for both humans and animals.
Key Growth Drivers
Rising Demand for Sustainable Protein Sources
Consumers are increasingly shifting toward sustainable and eco-friendly food options to reduce the environmental impact of traditional animal farming. Alternative proteins, derived from plants, fermentation, and cell culture, offer lower greenhouse gas emissions and resource efficiency. Governments and organizations are also promoting plant-based diets to address food security and climate concerns. This growing awareness of sustainability, combined with innovation in protein extraction and production, is propelling the market toward mainstream adoption across food, beverage, and nutraceutical industries.
For instance, Corbion launched AlgaPrime DHA P3, an algae-based protein ingredient that offers high omega-3 levels while reducing dependency on marine sources, supporting both sustainability and nutrition in pet food.
Advancements in Food Technology and Protein Innovation
Continuous progress in biotechnology, fermentation, and molecular engineering has enhanced the texture, taste, and nutritional quality of alternative proteins. Companies are employing techniques such as precision fermentation, 3D tissue cultivation, and hybrid processing to replicate animal-based protein functionality. These technological improvements make alternative proteins more appealing to consumers and manufacturers alike. As R&D investment increases, the market benefits from improved scalability, cost reduction, and a growing range of applications across dairy, meat, and functional food categories.
For instance, Impossible Foods has successfully used precision fermentation to produce heme, a key molecule that mimics the taste and texture of beef in their popular Impossible Burger, greatly improving consumer acceptance.
Growing Health and Nutrition Awareness
Health-conscious consumers are adopting alternative proteins due to their high nutritional value, lower cholesterol, and allergen-free composition. The global rise in obesity and lifestyle-related diseases has further encouraged protein-rich diets with plant and microbial sources. Alternative proteins meet the demand for clean-label, high-protein, and low-fat foods without compromising taste. The segment is also expanding within sports nutrition and dietary supplements, where protein fortification supports energy balance and muscle health, reinforcing its role as a vital component of modern health-focused diets.
Key Trends and Opportunities
Expansion of Precision Fermentation and Cultivated Protein
Precision fermentation and cultivated protein technologies are transforming how food is produced. They enable high-quality, animal-free protein creation with minimal environmental impact. Companies are scaling up fermentation systems to produce specific protein molecules, fats, and enzymes for use in dairy, meat, and egg alternatives. This shift opens opportunities for partnerships between food manufacturers and biotech firms, driving commercialization. The growing regulatory support for cell-based products in markets like the U.S. and Singapore further accelerates this transition.
For instance, Vivici, a Dutch startup, recently raised €32.5 million in Series A funding to expand its precision fermentation production of dairy proteins, producing pure beta-lactoglobulin whey protein without relying on animal agriculture.
Rising Investments and Strategic Collaborations
Investors and major food corporations are rapidly increasing funding in alternative protein startups and manufacturing infrastructure. Strategic collaborations between technology developers and global food brands are accelerating innovation and global reach. Public-private partnerships are also fostering R&D in sustainable protein ecosystems. As consumer acceptance grows, retail and foodservice channels are expanding their alternative protein portfolios, offering significant opportunities for scaling production and capturing emerging markets in Asia-Pacific, Latin America, and the Middle East.
For instance, Next-Gen Foods partnered with Singapore’s Food Tech Innovation Centre to expand its R&D capabilities in plant-based chicken alternatives.
Key Challenges
High Production Costs and Scalability Issues
Despite technological progress, large-scale production of alternative proteins remains cost-intensive due to complex processing, fermentation, and equipment needs. Cultivated and precision-fermented proteins, in particular, face scalability barriers in bioreactor design, energy use, and raw material sourcing. These challenges limit affordability and mainstream adoption, especially in developing regions. Achieving cost parity with traditional animal protein will require process optimization, investment in infrastructure, and government incentives to make sustainable protein production economically viable.
Consumer Acceptance and Sensory Limitations
Taste, texture, and familiarity remain major barriers to consumer acceptance of alternative proteins. While technological advances have improved sensory profiles, many consumers still perceive plant and cultured proteins as inferior to traditional meat or dairy. Misinformation about genetic modification and food processing also impacts trust. Overcoming these concerns requires better product formulation, transparent labeling, and targeted awareness campaigns. Building consumer confidence through quality, nutrition, and taste parity will be essential for long-term market success.
Regional Analysis
North America
North America holds the largest market share of 36%, driven by strong consumer demand for plant-based and sustainable food products. The region’s well-established food innovation ecosystem, coupled with the presence of major players like Beyond Meat and Impossible Foods, supports rapid commercialization of new protein technologies. Investments in cultivated meat and fermentation-based protein facilities are expanding across the U.S. and Canada. Government-backed sustainability initiatives and growing vegan demographics further boost adoption, while retail and foodservice partnerships enhance product visibility and consumer accessibility across the region.
Europe
Europe accounts for 28% of the global alternative protein market, supported by stringent environmental regulations and proactive government policies promoting sustainable diets. Consumers in countries like Germany, the U.K., and the Netherlands are increasingly embracing plant-based and hybrid protein products. The European Union’s investment in precision fermentation and novel food approvals is accelerating technological advancements. Strong retail presence of plant-based brands and collaborations between biotech startups and food manufacturers drive innovation. Growing awareness of climate impact and ethical food consumption continues to position Europe as a global leader in protein diversification.
Asia-Pacific
Asia-Pacific represents a 23% market share and is the fastest-growing regional segment, driven by rising health awareness, population growth, and increasing disposable income. Countries such as China, India, Japan, and Singapore are witnessing strong adoption of plant-based and fermented protein products. The region benefits from expanding food manufacturing infrastructure and government initiatives supporting food security and sustainability. Local startups are collaborating with international brands to scale production and distribution. The growing acceptance of flexitarian diets and demand for affordable protein alternatives contribute to Asia-Pacific’s rapid market expansion.
Latin America
Latin America captures 8% of the alternative protein market, with Brazil and Mexico leading adoption due to shifting dietary preferences and sustainability awareness. Expanding urbanization and rising middle-class income are driving demand for high-protein, meat-free food options. Regional food processors are investing in plant-based meat and dairy alternatives to meet consumer expectations. Strategic partnerships with global protein companies are also helping develop localized products suited to regional tastes. Although infrastructure challenges remain, increasing awareness of health and environmental issues continues to strengthen market potential in Latin America.
Middle East & Africa
The Middle East & Africa region holds a 5% market share, supported by growing demand for protein-rich diets and the gradual acceptance of plant-based nutrition. Rising import dependence and efforts to diversify food sources are encouraging innovation in alternative proteins. Countries like the UAE, Israel, and South Africa are leading adoption through startup growth and government-backed sustainability programs. Investments in food-tech hubs and cultured protein research are expanding regional capabilities. Although the market is in its early stage, increasing health awareness and dietary diversification are driving steady long-term growth.
Market Segmentations:
By Raw Material
- Plant based
- Microbial & fermentation
- Cell culture
- Functional additives & ingredients
- Others
By Production Technology
- Plant based
- Cultivated
- Fermentation
- Hybrid processing
- Emerging technologies
By Product Category
- Protein ingredients & intermediates
- Meat alternatives
- Dairy alternatives
- Seafood alternatives
- Egg alternatives
- Pet food alternatives
- Nutritional supplement & protein powders
By End Use
- Food manufacturing
- Food service
- Retail/consumer
- Others (cosmetics & personal care, pharmaceuticals)
By Region
- North America
- Europe
- Germany
- France
- U.K.
- Italy
- Spain
- Rest of Europe
- Asia Pacific
- China
- Japan
- India
- South Korea
- South-east Asia
- Rest of Asia Pacific
- Latin America
- Brazil
- Argentina
- Rest of Latin America
- Middle East & Africa
- GCC Countries
- South Africa
- Rest of the Middle East and Africa
Competitive Landscape
The competitive landscape of the Global Alternative Protein Market features leading companies such as Beyond Meat Inc., Nestlé S.A., Impossible Foods Inc., Aleph Farms Ltd., Danone S.A., Eat Just Inc., Givaudan S.A., Ingredion Incorporated, Mosa Meat B.V., and Nature’s Fynd Inc. These players are investing heavily in research, product innovation, and capacity expansion to enhance protein quality, texture, and nutritional value. Partnerships between food technology startups and established corporations are driving large-scale commercialization of plant-based, cultivated, and fermentation-derived proteins. Companies are also focusing on improving cost efficiency and sustainability through precision fermentation and hybrid processing. Product diversification across meat, dairy, and nutritional categories has intensified market competition. Strategic mergers, acquisitions, and collaborations are common as firms aim to strengthen distribution networks and expand geographic presence. Growing consumer acceptance of eco-friendly, protein-rich diets continues to shape competitive strategies across global and regional markets.
Key Player Analysis
- Nestlé S.A.
- Mosa Meat B.V.
- Beyond Meat Inc.
- Aleph Farms Ltd.
- Givaudan S.A.
- Eat Just Inc.
- Impossible Foods Inc.
- Ingredion Incorporated
- Danone S.A.
- Nature’s Fynd Inc.
Recent Developments
- In September 2025, Mukka Proteins Limited completed the acquisition of a 51% majority stake in FABBCO Bio Cycle and Bio Protein Technology Private Limited, expanding its footprint in the alternative protein segment and strengthening its bio-based protein portfolio.
- In October 2025, Fork & Good acquired Orbillion Bio to enhance its cultivated meat production capabilities and accelerate commercialization within the global alternative protein market.
- In September 2025, Leaft Foods (New Zealand) formed a strategic partnership with Lacto Japan to introduce RuBisCO-based plant protein derived from alfalfa into Japanese food and sports nutrition markets.
- In August 2025, v2food (Australia) acquired Daring Foods (USA) with the support of Ajinomoto Co., Inc. to enhance its clean-label plant-based chicken portfolio and scale frozen meal production.
Shape Your Report to Specific Countries or Regions & Enjoy 30% Off!
Report Coverage
The research report offers an in-depth analysis based on Raw Material, Production Technology, Product Category, End User and Region. It details leading market players, providing an overview of their business, product offerings, investments, revenue streams, and key applications. Additionally, the report includes insights into the competitive environment, SWOT analysis, current market trends, as well as the primary drivers and constraints. Furthermore, it discusses various factors that have driven market expansion in recent years. The report also explores market dynamics, regulatory scenarios, and technological advancements that are shaping the industry. It assesses the impact of external factors and global economic changes on market growth. Lastly, it provides strategic recommendations for new entrants and established companies to navigate the complexities of the market.
Future Outlook
- The market will continue expanding as sustainable protein demand rises globally.
- Technological advances in fermentation and cell culture will improve production efficiency.
- Hybrid protein products combining plant and cultured sources will gain wider acceptance.
- Consumer preference for clean-label and allergen-free protein options will strengthen.
- Food manufacturers will invest in scaling precision fermentation and bioreactor capacity.
- Governments will support alternative proteins through sustainability and food security initiatives.
- Retail and foodservice channels will expand their plant-based and cultured protein offerings.
- Partnerships between biotech firms and global food brands will drive innovation.
- Emerging markets in Asia-Pacific and Latin America will see faster adoption rates.
- Long-term focus will shift toward affordability, nutritional enhancement, and taste optimization.


