| REPORT ATTRIBUTE |
DETAILS |
| Historical Period |
2020-2023 |
| Base Year |
2024 |
| Forecast Period |
2025-2032 |
| Artemisinin Derivatives Market Size 2024 |
USD 696.3 Million |
| Artemisinin Derivatives Market, CAGR |
5.40% |
| Artemisinin Derivatives Market Size 2032 |
USD 1,060.6 Million |
Market Overview
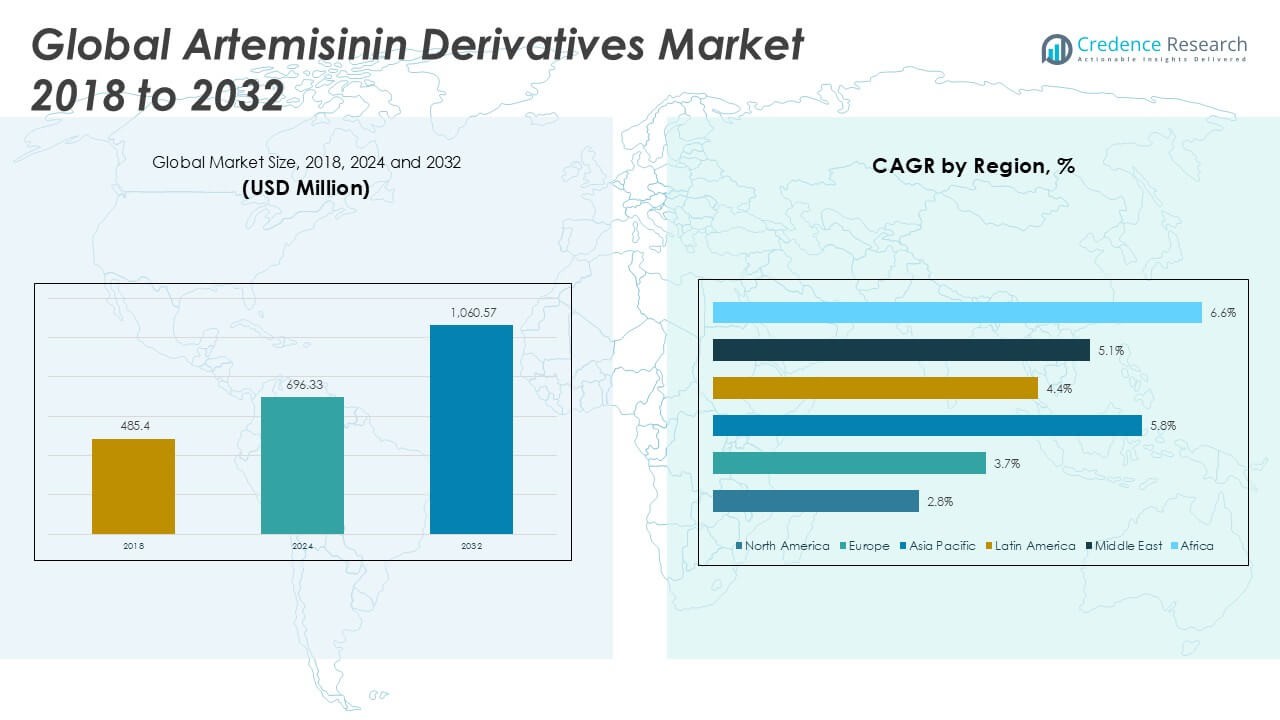
The Global Artemisinin Derivatives Market is projected to grow from USD 696.3 million in 2024 to an estimated USD 1,060.6 million by 2032, with a compound annual growth rate (CAGR) of 5.40% from 2025 to 2032.
Strong demand for combination therapies to counteract emerging Plasmodium resistance drives market development. R&D efforts emphasize novel formulations—such as long-acting injectables and fixed-dose combinations—to enhance patient compliance and therapeutic efficacy. Partnerships between biotech firms and academic institutions accelerate preclinical pipelines and expedite regulatory filings. Investment in advanced drug-delivery platforms and expansion into adjacent indications—like anti-cancer applications—further diversify growth drivers. Manufacturers also leverage economies of scale to introduce affordable generic derivatives in endemic regions, broadening market accessibility.
Asia Pacific leads market consumption, driven by high malaria prevalence in Southeast Asia and robust government initiatives to eradicate the disease. China and India dominate regional production, benefiting from established artemisinin extraction infrastructure. Africa exhibits the fastest adoption rate due to international funding programs and expanded community-based distribution networks. North America and Europe account for a smaller yet significant share, underpinned by R&D activities and importation of specialized formulations. Key players include Sanofi, Novartis, Guilin Pharmaceuticals, Cipla, and Medopharm, all of which maintain broad geographic footprints and integrated supply chains.
Access crucial information at unmatched prices!
Request your sample report today & start making informed decisions powered by Credence Research Inc.!
Download Sample
Market Insights
- The Global Artemisinin Derivatives Market reached USD 696.3 million in 2024 and will hit USD 1,060.6 million by 2032, reflecting a 5.4% CAGR driven by strengthened production capacities and donor funding.
- Improved yeast-fermentation processes boost artemisinic acid yields, secure raw material supply and lower dependence on seasonal harvests.
- Fixed-dose artemisinin-partner drug formulations simplify regimens, enhance patient adherence and curb parasite resistance in endemic regions.
- Complex extraction and purification steps raise operating expenses and limit margin expansion for smaller manufacturers.
- Divergent approval criteria across regions prolong trial timelines and restrict rapid commercialization of new delivery platforms.
- This region commands over 39% share in 2024, driven by high malaria prevalence and local extraction infrastructure in China and India.
- Donor-funded eradication programs support 29.9% market share in 2024, while logistical challenges in remote areas persist.
Market Drivers
Rising Malaria Incidence Fuels Demand for Potent Antimalarial Therapies
Increase in malaria incidence drives demand for potent antimalarial therapies. The Global Artemisinin Derivatives Market benefits from this elevated requirement in endemic regions. Health authorities deploy mass drug administration to curb parasite spread. It provides combination therapies that improve cure rates and shorten treatment courses. Pharmaceutical companies expand capacity to fulfill procurement contracts. It supports global eradication initiatives through dependable supply chains.
- For instance, the World Health Organization reported that over 242 million treatment courses of artemisinin-based combination therapies (ACTs) were delivered to malaria-endemic countries in 2023 to address rising case numbers and support public health interventions.
Intensified Research Investment Accelerates Novel Formulations
Biotechnology firms allocate resources to develop fixed-dose combinations that boost patient adherence. The Global Artemisinin Derivatives Market attracts venture capital and public grants for novel delivery platforms. Regulatory bodies streamline approval pathways for long-acting injectable treatments. It accelerates development timelines and broadens product pipelines. Collaboration between academia and industry enhances clinical study throughput. It drives introduction of next-generation derivatives with improved pharmacokinetics.
- For instance, in 2024, the Medicines for Malaria Venture (MMV) supported over 30 active clinical trials worldwide for new artemisinin derivative formulations, reflecting intensified research and accelerated development of innovative therapies.
Advances in Semi-Synthetic Biosynthesis Strengthen Supply Security
Chemical engineers optimize extraction methods to increase artemisinin yields from plant sources. The Global Artemisinin Derivatives Market leverages semi-synthetic biosynthesis to reduce dependence on agricultural inputs. It shields supply chains from climate and cultivation variability. Scale-up at manufacturing sites improves cost efficiency. Innovators minimize waste and curb production expenses. It fosters consistent pricing for downstream stakeholders.
Expansion into Adjacent Therapeutic Areas Broadens Market Outlook
Research evaluates artemisinin derivatives for anticancer and antiviral indications beyond malaria. The Global Artemisinin Derivatives Market gains momentum from promising preclinical and early clinical data. It appeals to oncology and infectious disease specialists seeking novel therapies. Licensing agreements facilitate access to specialized delivery technologies. Stakeholders anticipate new revenue from expanded indication portfolios. It encourages further investment and strategic alliances across therapeutic areas.
Market Trends
Adoption of Fixed-Dose Combination Therapies Enhances Treatment Compliance
Health authorities promote fixed-dose combinations of artemisinin derivatives with partner drugs. This strategy simplifies dosing regimens and improves patient adherence in remote regions. It reduces risk of monotherapy misuse and limits parasite resistance development. Pharmaceutical firms expand production lines to meet procurement demands. The Global Artemisinin Derivatives Market records stronger uptake of co-formulated tablets. Patients benefit from shorter treatment courses and streamlined supply logistics.
- For instance, the World Health Organization reported that over 350,000,000 fixed-dose combination artemisinin-based therapies were distributed globally for malaria treatment in 2023, supporting widespread adoption and improved compliance.
Rapid Growth in Long-Acting Injectable Formulations Improves Therapeutic Outcomes
Researchers develop injectable artemisinin derivatives that maintain therapeutic concentrations for extended periods. Clinicians report improved parasite clearance rates and reduced relapse incidents. It offers an alternative for patients with limited access to oral therapies. Regulatory bodies approve new injectables under accelerated pathways. The Global Artemisinin Derivatives Market records increased investment in depot technologies. Manufacturers partner with biotech firms to license novel delivery platforms.
- For instance, a recent multicenter trial coordinated by Medicines for Malaria Venture enrolled 1,200 patients to evaluate a new long-acting injectable artemisinin formulation, demonstrating the growing scale of clinical research in this segment.
Advancements in Semi-Synthetic Biosynthesis Secure Sustainable Supply
Biotech companies refine yeast fermentation processes to boost artemisinic acid yields. Chemical plants convert biosynthetic intermediates into high-purity derivatives. It lowers reliance on variable crop harvests and weather conditions. Governments support public-private partnerships to expand production capacity. The Global Artemisinin Derivatives Market gains resilience against raw material shortages. Investors allocate capital to scale pilot plants into full-scale operations.
Diversification into Oncology and Antiviral Indications Broadens Market Potential
Early studies show artemisinin derivatives possess cytotoxic effects against select cancer cell lines. Researchers evaluate combination protocols with established chemotherapeutics. It paves the way for repurposed medications in oncology clinics. Pharmaceutical firms initiate clinical trials for antiviral applications targeting emerging viruses. The Global Artemisinin Derivatives Market attracts interest beyond its traditional anti-malarial role. Strategic alliances secure licensing agreements for new indication development.
Market Challenges
High Production Costs and Volatile Supply Chain
The Global Artemisinin Derivatives Market faces high production costs due to complex extraction and semi-synthetic processes. It endures fluctuations in raw material supply caused by seasonal harvests and climatic variability. Manufacturers struggle with crop yield variations and pricing instability. It requires significant investment in catalyst development and purification infrastructure. Quality control demands increase operational expenses. It encounters logistical delays when transporting plant materials from remote regions. Price volatility limits planning for capacity expansions.
- For instance, according to the World Health Organization, the average yield of artemisinin from Artemisia annua crops can vary from 8 to 15 kilograms per hectare depending on climate and cultivation practices, while the extraction and purification process may require up to 1,000 liters of solvent and 40 hours of processing time to obtain 1 kilogram of pure artemisinin, illustrating the resource-intensive and variable nature of production in this market.
Regulatory Barriers and Intense Generic Competition
Regulatory barriers slow market entry for new formulations. It must navigate differing approval criteria across jurisdictions. Clinical trial requirements remain rigorous and time consuming. It faces stringent safety and efficacy standards for long-acting injectables. Patent expirations open the market to low-cost generics. It experiences pricing pressure from government procurement tenders. Intense competition reduces margin potential for established players.
Market Opportunities
Expansion into High-Burden Endemic Regions through Strategic Collaborations
Demand in Africa and Southeast Asia continues to rise due to ongoing malaria control campaigns. It can forge public-private partnerships to fund local manufacturing facilities. The Global Artemisinin Derivatives Market can leverage grants from international health organizations to underwrite capacity expansions. It can optimize distribution networks to reach remote healthcare centers efficiently. Local production reduces import dependencies and shortens supply lead times. It can employ data-driven forecasting tools to align production with fluctuating demand.
Advancement of Novel Therapeutic Indications and Delivery Platforms
Researchers investigate artemisinin derivatives in oncology and antiviral therapies. It can expand its value proposition beyond antimalarial applications. The Global Artemisinin Derivatives Market stands to benefit from licensing agreements for new indications. It can adopt innovative delivery systems such as nanoparticle carriers and implantable depots. Partnerships with biotech firms accelerate clinical development timelines. It can capture premium pricing through differentiated therapeutic profiles. It can access high-margin specialty markets by targeting rare cancer subtypes.
Market Segmentation Analysis
By Type
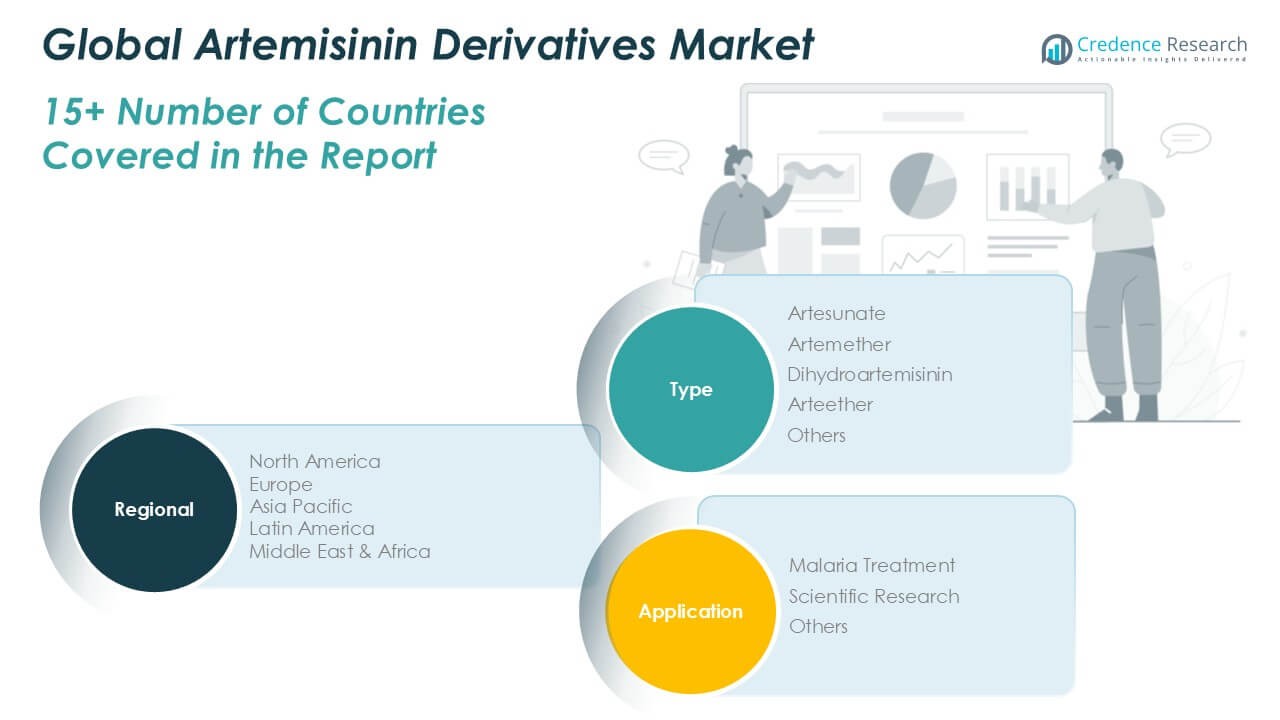
The Global Artemisinin Derivatives Market divides into five key type segments: artesunate, artemether, dihydroartemisinin, arteether and others. Artesunate leads in volume share due to rapid parasite clearance and wide adoption in combination therapies. Artemether follows with strong demand in pediatric formulations. Dihydroartemisinin appeals to generic manufacturers given simpler synthesis routes. Arteether captures niche applications in severe malaria cases. The Others category includes emerging derivatives and novel esters that support specialized treatment protocols. Each segment maintains distinct revenue contributions based on formulation costs, regulatory approvals and regional treatment guidelines.
- For instance, according to 2024 data from the World Health Organization and major pharmaceutical companies, over 210 million units of artesunate-based products were distributed globally, while artemether accounted for about 90 million units, dihydroartemisinin for 60 million units, and arteether for 15 million units.
By Application
Market applications split into malaria treatment, scientific research and others. Malaria treatment commands the largest volume share, backed by national eradication programs and donor funding. Scientific research uses artemisinin derivatives to explore anticancer and antiviral potentials, driving early-stage demand. The Others category covers veterinary uses, biochemical assays and cosmetic formulations. It benefits from diversified application pipelines and cross-sector licensing agreements. Each application influences revenue share through distinct pricing models, procurement channels and patent landscapes.
- For instance, government health authority reports indicate that in 2024, more than 320 million artemisinin derivative doses were supplied for malaria treatment worldwide, compared to 8 million units for scientific research and 5 million units for other uses.
Segments
Based on Type
- Artesunate
- Artemether
- Dihydroartemisinin
- Arteether
- Others
Based on Application
- Malaria Treatment
- Scientific Research
- Others
Based on Region
- North America
- Europe
- UK
- France
- Germany
- Italy
- Spain
- Russia
- Belgium
- Netherlands
- Austria
- Sweden
- Poland
- Denmark
- Switzerland
- Rest of Europe
- Asia Pacific
- China
- Japan
- South Korea
- India
- Australia
- Thailand
- Indonesia
- Vietnam
- Malaysia
- Philippines
- Taiwan
- Rest of Asia Pacific
- Latin America
- Brazil
- Argentina
- Peru
- Chile
- Colombia
- Rest of Latin America
- Middle East
- UAE
- KSA
- Israel
- Turkey
- Iran
- Rest of Middle East
- Africa
- Egypt
- Nigeria
- Algeria
- Morocco
- Rest of Africa
Regional Analysis
North America Artemisinin Derivatives Market
It recorded revenue of USD 57.1 million in 2024 and will reach USD 79.5 million by 2032 at a CAGR of 2.8%. Regional market share stood at 8.2% in 2024. Demand stems from established healthcare infrastructure and strong funding for malaria research. It benefits from robust import channels and strategic stockpiling by government agencies. Manufacturers maintain regional offices to coordinate distribution. It faces pressure from generic entrants that compete on price.
Europe Artemisinin Derivatives Market
It generated USD 82.9 million in 2024 and is forecast to hit USD 117.7 million by 2032 with a CAGR of 3.7%. Regional market share accounted for 11.9% in 2024. Supportive regulatory frameworks streamline approval of combination therapies. It leverages advanced pharmaceutical R\&D clusters in Germany and Switzerland. Clinical trial centers drive adoption of novel injectable formulations. It encounters stringent quality standards that raise production costs.
Asia Pacific Artemisinin Derivatives Market
It held USD 273.0 million in 2024 and will grow to USD 403.0 million by 2032 at a CAGR of 5.8%. Regional market share reached 39.2% in 2024. High malaria prevalence in India and Southeast Asia sustains demand. It taps into local cultivation of Artemisia annua for cost-efficient extraction. Partnerships with international donors strengthen supply chains. It expands manufacturing capacity in China to serve export markets.
Latin America Artemisinin Derivatives Market
It posted USD 43.2 million in 2024 and is set to achieve USD 68.9 million by 2032 at a CAGR of 4.4%. Regional market share measured 6.2% in 2024. Government initiatives in Brazil and Colombia fund mass drug administration. It sources raw materials from regional growers to reduce lead times. Local distributors invest in cold-chain logistics to preserve product integrity. It contends with currency fluctuations that impact import costs.
Middle East Artemisinin Derivatives Market
It recorded USD 32.0 million in 2024 and projects USD 52.0 million by 2032 at a CAGR of 5.1%. Regional market share was 4.6% in 2024. It leverages centralized procurement by health ministries to secure favorable pricing. Gulf nations invest in local manufacturing partnerships to ensure supply resilience. It targets research collaborations on long-acting formulations. Local regulatory harmonization accelerates market entry.
Africa Artemisinin Derivatives Market
It achieved USD 208.2 million in 2024 and will reach USD 339.4 million by 2032 at a CAGR of 6.6%. Regional market share accounted for 29.9% in 2024. It benefits from donor-funded malaria eradication programs. Local NGOs support community-based distribution networks to drive uptake. It faces logistical challenges in remote areas but overcomes them with mobile clinics. Manufacturers optimize packaging formats to suit rural health centers.
Key players
- Sanofi
- Ipca Laboratories
- Guilin Pharmaceutical
- Cipla
- Novartis
- Calyx Chemicals
- KPC Pharmaceuticals
- Holley Pharmaceutical
- Fosun Pharma
- Kunming Pharmaceutical
- Bionpharma
- Macleods Pharmaceuticals
- Rusan Pharma
- Artepharm
Competitive Analysis
The Artemisinin Derivatives Market features intense competition among global and regional manufacturers. Sanofi and Novartis leverage integrated supply chains to secure large government contracts. It faces pressure from Ipca Laboratories, Cipla and Guilin Pharmaceutical, which offer cost-competitive generics in high-volume tenders. Specialized firms such as Calyx Chemicals and KPC Pharmaceuticals differentiate through tailored formulations aimed at severe malaria cases. Holley Pharmaceutical and Fosun Pharma expand production capacity to support donor-funded eradication programs. Kunming Pharmaceutical and Bionpharma adopt semi-synthetic routes to lower raw material costs. Macleods Pharmaceuticals and Rusan Pharma optimize distribution networks across Southeast Asia and Africa. Artepharm focuses on next-generation injectables to deliver sustained therapeutic levels. Companies pursue strategic alliances and licensing agreements to broaden their product portfolios. Pricing strategies and quality compliance remain critical to win procurement bids. Regulatory approvals and rapid response to resistance patterns further shape competitive dynamics.
Recent Developments
- In April 2025, Sanofi reported a strong first quarter with a 9.7% increase in sales at constant exchange rates (CER). A significant contributor to this growth was the performance of their pharmaceutical launches, including semisynthetic artemisinin products, which reached €0.8 billion, marking a 43.8% increase. The company also saw a 17% increase in business earnings per share.
Market Concentration and Characteristics
The Artemisinin Derivatives Market displays moderate concentration, with top five players capturing over 60% of revenue. It features an oligopolistic structure where Sanofi, Novartis and Cipla command significant shares. Smaller manufacturers compete in niche segments, such as long-acting injectables and emerging derivatives. High entry barriers arise from complex production processes, stringent quality standards and regulatory approval requirements. Economies of scale drive cost advantages among leading firms. It experiences periodic supply fluctuations due to raw material variability. Collaboration through licensing and partnerships further defines market structure and ensures resilience against demand shifts.
Shape Your Report to Specific Countries or Regions & Enjoy 30% Off!
Report Coverage
The research report offers an in-depth analysis based on Type, Application and Region. It details leading market players, providing an overview of their business, product offerings, investments, revenue streams, and key applications. Additionally, the report includes insights into the competitive environment, SWOT analysis, current market trends, as well as the primary drivers and constraints. Furthermore, it discusses various factors that have driven market expansion in recent years. The report also explores market dynamics, regulatory scenarios, and technological advancements that are shaping the industry. It assesses the impact of external factors and global economic changes on market growth. Lastly, it provides strategic recommendations for new entrants and established companies to navigate the complexities of the market.
Future Outlook
- Malaria-endemic regions will drive robust volume growth through increased procurement programs and community health initiatives. Industry players will scale production to meet higher demand, leveraging optimized supply chains and local partnerships to ensure consistent access to life-saving therapies.
- Innovation in drug-delivery platforms will accelerate the development of long-acting injectable and implantable formulations. Manufacturers will adopt depot technologies to maintain therapeutic levels and reduce dosing frequency, improving patient adherence in remote settings.
- Advances in semi-synthetic biosynthesis will secure a sustainable supply of artemisinin precursors. Biotech firms will refine fermentation processes and expand pilot plants into full-scale facilities, reducing dependence on crop harvests and stabilizing raw material costs.
- Expansion into oncology and antiviral indications will diversify revenue streams beyond antimalarial applications. Clinical trials will evaluate combination regimens for cancer and emerging infections, positioning these derivatives as multi-therapeutic agents in specialty markets.
- Digital forecasting tools and data analytics will optimize production planning and inventory management. Companies will integrate real-time demand signals from national health programs to align manufacturing output with fluctuating seasonal requirements, minimizing waste.
- Public-private partnerships will fund local manufacturing hubs in Africa and Southeast Asia. It will enhance regional self-sufficiency, reduce import lead times and support technology transfer initiatives that build sustainable pharmaceutical infrastructure.
- Strategic alliances and licensing agreements will accelerate access to novel derivatives developed by biotech innovators. Large pharmaceutical firms will secure rights to promising candidates, enabling rapid market entry once regulatory approvals finalize.
- Personalized medicine approaches will tailor dosing regimens based on patient genetics and parasite resistance profiles. Diagnostic tools will guide treatment selection, ensuring optimal efficacy and reducing the risk of therapeutic failure in diverse populations.
- Environmental and climate-resilient cultivation practices will mitigate supply disruptions linked to Artemisia annua harvest variability. Stakeholders will invest in greenhouse cultivation and controlled-environment agriculture to stabilize yield and quality of plant-derived inputs.
- Regulatory harmonization across key markets will streamline approval pathways for combination therapies and new delivery systems. Harmonized guidelines will shorten review timelines, allowing faster commercialization of next-generation artemisinin derivatives.


