Applied Ceramic Labeling Market Size, Growth and Forecast 2032

Applied Ceramic Labeling market size was valued at USD 1,336.63 million in 2024 and is projected to reach USD 2,740.32 million by 2032.

Applied Ceramic Labeling Market By Product Type (Pressure-Sensitive Labels, Heat-Shrink Labels, In-Mold Labels, Laser Engraved Labels); By Printing Technique (Multicolor Printing, Embossing Printing, Digital Printing, Laser Etching); By End-User Industry (Food and Beverage, Pharmaceutical, Consumer Goods, Automotive, Electronics) – Growth, Share, Opportunities & Competitive Analysis, 2024 – 2032

SKU: CR15260Report Pages: 250Category: ChemicalsReport Format: PDF, ExcelLast Updated: Jul 14Author: Shweta BishtPreferred on

Market Report Metrics

Revenue, 2024 -
USD 1,336.63 million
Forecast Year -
2032
CAGR (2024–2032)
8.75%
Report Coverage
Global
REPORT ATTRIBUTE DETAILS
Historical Period 2020-2023
Base Year 2024
Forecast Period 2025-2032
Applied Ceramic Labeling Market Size 2024 USD 1,336.63 million
Applied Ceramic Labeling Market, CAGR 8.75%
Applied Ceramic Labeling Market Size 2032 USD 2,740.32 million

Market Overview:

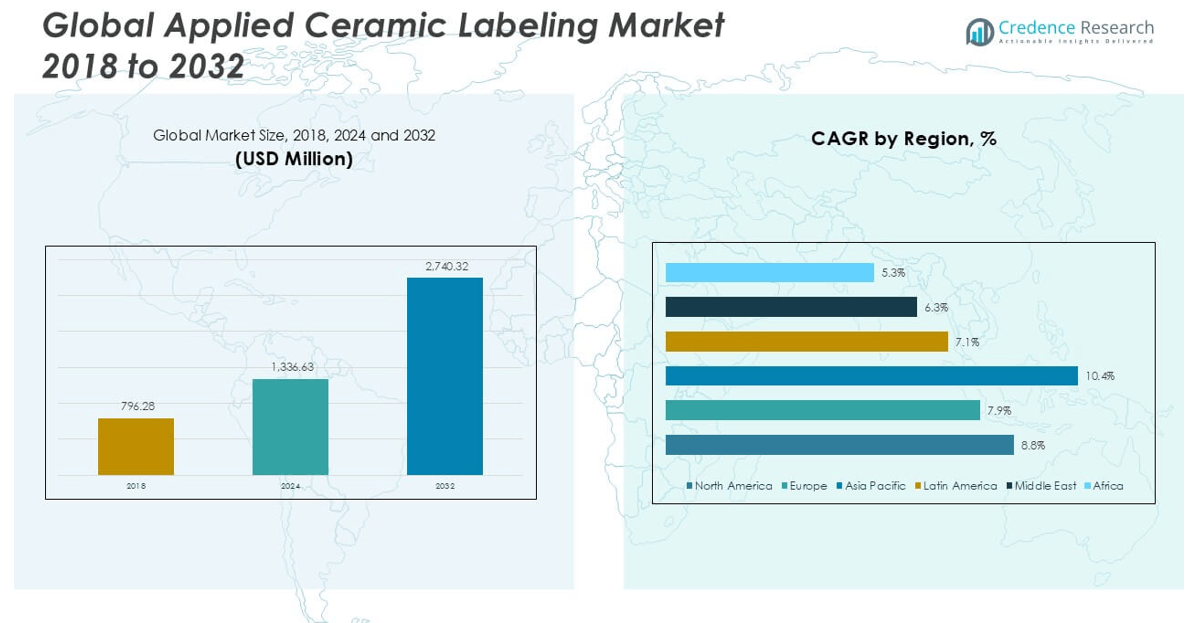
The Applied Ceramic Labeling market size was valued at USD 796.28 million in 2018, increased to USD 1,336.63 million in 2024, and is anticipated to reach USD 2,740.32 million by 2032, at a CAGR of 8.75% during the forecast period.

The Applied Ceramic Labeling market features prominent players such as Stanpac, Packsource Corporation, Chattanooga Labeling Systems, Applied Ceramics, Marabu GmbH & Co. KG, and Ferro Corporation, each contributing to technological innovation, high-quality design, and expanded labeling applications across industries. These companies focus on advanced printing techniques, durable labeling solutions, and strategic partnerships to strengthen market presence. North America emerged as the leading region in 2024, commanding approximately 42.2% of the global market share, driven by strong demand from the food and beverage, cosmetics, and pharmaceutical sectors. The region's advanced manufacturing infrastructure and early adoption of sustainable, premium packaging solutions further support its dominance in the market.

Applied Ceramic Labeling Market size

Market Insights

  • The Applied Ceramic Labeling market was valued at USD 1,336.63 million in 2024 and is projected to reach USD 2,740.32 million by 2032, growing at a CAGR of 8.75% during the forecast period.
  • Rising demand for premium and sustainable packaging, especially in the food & beverage and cosmetics sectors, is a key growth driver boosting the adoption of durable ceramic labels.
  • Multicolor printing leads the printing technique segment, while pressure-sensitive labels dominate the product type segment due to their versatility and cost-efficiency.
  • North America holds the largest regional share at 42.2%, followed by Europe with 27.7%, driven by strong industrial infrastructure, advanced printing technology, and premium packaging demand.
  • Market growth is restrained by high production costs, energy-intensive manufacturing processes, and limited compatibility with non-glass substrates, which may restrict adoption in cost-sensitive and plastic-dominant industries.

Market Segmentation Analysis:

By Product Type:

In the Applied Ceramic Labeling market, Pressure-Sensitive Labels emerged as the dominant product type, accounting for the largest market share in 2024. Their popularity stems from ease of application, superior design flexibility, and compatibility with a wide range of container materials. These labels are extensively used in industries requiring durable and high-quality aesthetic labeling, particularly food and beverage packaging. The growing demand for sustainable and cost-effective labeling solutions is further fueling the adoption of pressure-sensitive labels, while innovations in adhesive technologies continue to enhance their performance and efficiency across end-use sectors.

  • For instance, Avery Dennison developed its CleanFlake™ technology, which enables 100% recyclability of PET bottles with pressure-sensitive labels; the solution was successfully adopted by Nestlé Waters on over 250 million bottles annually, eliminating contamination in the recycling stream.

By Printing Technique

Among printing techniques, Multicolor Printing held the highest revenue share in the Applied Ceramic Labeling market in 2024. This dominance is driven by increasing consumer preference for visually appealing packaging and the ability of multicolor printing to enhance brand identity. It allows manufacturers to incorporate intricate designs and vivid colors that elevate product presentation, especially in high-end and premium markets. Advancements in printing technology have made multicolor processes more cost-efficient, boosting adoption across both mass-produced and niche product categories, particularly in the beverage and cosmetic industries.

  • For instance, Kammann Machines offers fully automated K15 CNC printing lines that support up to 8-color direct-on-glass ceramic printing at a resolution of 1,200 dpi, with output capacities reaching 60 containers per minute, significantly enhancing precision and production scale for applied ceramic labeling.

By End-User Industry

The Food and Beverage segment led the Applied Ceramic Labeling market by end-user industry in 2024, contributing the largest market share. The sector's dominance is attributed to the rising demand for attractive, durable labels that withstand harsh environments such as refrigeration and handling. Glass packaging trends and premium product positioning in beverages, especially wine and spirits, have increased the reliance on ceramic labeling for enhanced shelf appeal. Additionally, stringent labeling regulations and the growing importance of brand differentiation continue to drive market growth within this segment.

Market Overview

Rising Demand for Premium Packaging

The growing consumer preference for aesthetically appealing and durable packaging is a key driver for the Applied Ceramic Labeling market. Brands, particularly in the food and beverage and cosmetics sectors, increasingly rely on ceramic labels to enhance product visibility and perceived value. Applied ceramic labels offer superior resistance to moisture, abrasion, and chemicals, making them ideal for high-end packaging. This demand for premium presentation, especially in wine, spirits, and luxury personal care items, is propelling the market forward by encouraging manufacturers to adopt advanced labeling solutions.

  • For instance, Estée Lauder uses ceramic and direct-on-glass labeling for its luxury skincare line, with over 36 production lines globally operating at speeds of up to 400 units per minute to ensure brand consistency and durability in premium glass containers.

Expansion of the Beverage Industry

The rapid growth of the global beverage industry, particularly alcoholic beverages and bottled water, significantly boosts the demand for applied ceramic labeling. Glass containers dominate these segments due to their aesthetic and preservation benefits, and ceramic labels complement this by providing long-lasting branding. Beverage companies increasingly adopt these labels to convey premium quality and brand authenticity. Additionally, seasonal and limited-edition product launches require visually distinctive packaging, creating more opportunities for ceramic labeling technologies to be deployed at scale.

  • For instance, Absolut Vodka introduced a limited-edition ceramic-printed bottle with over 3 million units produced using Kammann’s K20 series direct-to-glass printers, which can apply up to 9 colors per container at a precision level of 1,200 dpi for complex bottle artwork.

Advancements in Labeling and Printing Technologies

Technological developments in digital and multicolor printing have made ceramic labeling more efficient, customizable, and cost-effective. These advancements allow for intricate designs and high-resolution branding elements to be applied directly to containers without compromising durability. Moreover, improvements in laser etching and embossing techniques offer manufacturers a wider range of labeling options that align with branding goals. As printing technologies become more accessible and environmentally friendly, they facilitate greater adoption of ceramic labeling across various industries.

Key Trends & Opportunities

Sustainability and Eco-Friendly Labeling Solutions

With increasing regulatory and consumer pressure to reduce plastic use and improve recyclability, applied ceramic labels have gained attention for their compatibility with glass recycling processes. Unlike adhesive labels that often require removal, ceramic labels are fused into the container surface, reducing waste and enhancing recyclability. This sustainable advantage creates opportunities for brands seeking eco-conscious packaging options, especially in regions with strict environmental regulations. The trend is likely to intensify as companies prioritize environmental responsibility in product design and marketing strategies.

  • For instance, Owens-Illinois (O-I), one of the largest glass manufacturers globally, collaborated with Krones AG to develop direct-to-glass ceramic labeling systems integrated in their smart manufacturing lines, helping reduce label waste by over 2,500 metric tons annually while achieving recycling stream compatibility across 79 glass production plants.

Customization and Personalization in Branding

The demand for customized and limited-edition packaging is growing rapidly, especially in competitive sectors like cosmetics, beverages, and consumer goods. Applied ceramic labeling allows brands to personalize packaging with high-definition, long-lasting graphics. With advancements in digital printing, companies can efficiently produce short runs of customized designs, enabling faster response to market trends and consumer preferences. This shift toward personalization creates new market opportunities for ceramic labeling providers offering flexibility, quick turnaround, and innovative design capabilities.

  • For instance, Kammann GmbH developed its K15 CNC direct-to-object printer that enables high-speed digital ceramic printing in up to 8 colors with resolutions reaching 1,200 dpi, allowing producers such as Heineken to launch over 20 regional custom-label variants per campaign across multiple markets without increasing production downtime.

Key Challenges

High Initial Setup and Production Costs

One of the major challenges in the Applied Ceramic Labeling market is the high capital investment required for equipment and materials. Ceramic labeling involves specialized machinery and heat treatments, leading to higher setup and operational costs compared to conventional labeling methods. This cost barrier can deter small and medium-sized enterprises from adopting the technology, limiting market penetration. Additionally, the cost of materials such as ceramic inks and printing components adds to the overall expense, making it less viable for low-margin product segments.

Limited Substrate Compatibility

Applied ceramic labeling is primarily suited for glass and certain metal surfaces, restricting its application across a broader range of packaging materials. Industries heavily reliant on plastic or flexible packaging may find ceramic labeling impractical, thereby limiting its addressable market. This challenge becomes particularly prominent in regions or sectors where plastic remains dominant due to cost or logistical considerations. Overcoming this limitation requires either technological adaptation or shifts in packaging trends toward more compatible materials like glass.

Complex Recycling and Manufacturing Processes

While ceramic labels support glass recyclability, the manufacturing process itself is energy-intensive and requires precision to avoid defects. The application involves high-temperature treatments that demand strict quality control and may lead to higher waste in case of errors. Additionally, once fused, the label is permanent, which limits flexibility for relabeling or product repurposing. These factors complicate logistics and may deter companies looking for more adaptable or low-energy alternatives, particularly in regions focused on energy efficiency.

Regional Analysis

North America

North America held the largest share of the Applied Ceramic Labeling market in 2024, valued at USD 563.80 million, up from USD 339.48 million in 2018, and is projected to reach USD 1,159.17 million by 2032 at a CAGR of 8.8%. In 2024, the region accounted for approximately 42.2% of the global market. Growth is driven by high demand for premium packaging in the beverage and cosmetics industries, along with early adoption of advanced labeling technologies. Strong presence of key manufacturers and increasing preference for sustainable, visually appealing packaging solutions also contribute to regional expansion.

Europe

Europe captured a market size of USD 370.40 million in 2024, rising from USD 228.81 million in 2018, and is expected to reach USD 715.55 million by 2032, registering a CAGR of 7.9%. The region held approximately 27.7% of the global market share in 2024. Strong environmental regulations, coupled with growing demand for recyclable and aesthetic packaging, are fueling the adoption of applied ceramic labeling. Key industries such as wine, cosmetics, and specialty foods are particularly driving growth, with increasing investment in digital and multicolor printing technologies enhancing production capabilities across the region.

Asia Pacific

Asia Pacific is the fastest-growing region in the Applied Ceramic Labeling market, with a CAGR of 10.4%. The market grew from USD 157.14 million in 2018 to USD 285.34 million in 2024 and is anticipated to reach USD 660.75 million by 2032. In 2024, Asia Pacific held a market share of 21.3%. Rapid urbanization, rising disposable income, and increased consumption of premium beverages and personal care products are key growth drivers. Emerging economies like China, India, and Southeast Asian countries are investing heavily in packaging innovation, which supports regional expansion of applied ceramic labeling technologies.

Latin America

Latin America’s Applied Ceramic Labeling market was valued at USD 63.54 million in 2024, increasing from USD 38.32 million in 2018, and is forecasted to reach USD 115.58 million by 2032, growing at a CAGR of 7.1%. The region accounted for 4.8% of the global market in 2024. Growth in the regional food and beverage industry, along with gradual adoption of glass packaging and aesthetic labeling, is supporting market demand. Countries like Brazil and Mexico are witnessing increased investments in premium product packaging, although overall growth is moderated by economic instability and limited technological infrastructure.

Middle East

The Middle East market for Applied Ceramic Labeling was estimated at USD 33.04 million in 2024, rising from USD 21.60 million in 2018, and is projected to reach USD 56.77 million by 2032, registering a CAGR of 6.3%. The region represented 2.5% of the global market share in 2024. Growth is supported by expanding hospitality and luxury goods sectors, particularly in the UAE and Saudi Arabia. Increasing demand for decorative, durable labeling in high-end beverages and cosmetics is contributing to moderate market expansion, although high import dependency and limited local production capacity pose ongoing challenges.

Africa

Africa accounted for the smallest share in the Applied Ceramic Labeling market, valued at USD 20.51 million in 2024, up from USD 10.93 million in 2018, and is expected to reach USD 32.51 million by 2032, growing at a CAGR of 5.3%. The region held just 1.5% of the global market share in 2024. Growth remains modest due to infrastructural limitations and cost-sensitive industries, although increasing investments in beverage manufacturing and packaging innovations present future opportunities. South Africa and Egypt are leading adoption, particularly in the alcoholic beverage sector, where glass packaging and premium labeling are gaining traction.

Ambulatory Care Services Market segmentation

Market Segmentations:

By Product Type

  • Pressure-Sensitive Labels
  • Heat-Shrink Labels
  • In-Mold Labels
  • Laser Engraved Labels

By Printing Technique

  • Multicolor Printing
  • Embossing Printing
  • Digital Printing
  • Laser Etching

By End-User Industry

  • Food and Beverage
  • Pharmaceutical
  • Consumer Goods
  • Automotive
  • Electronics

By Geography

  • North America
    • U.S.
    • Canada
    • Mexico
  • Europe
    • Germany
    • France
    • U.K.
    • Italy
    • Spain
    • Rest of Europe
  • Asia Pacific
    • China
    • Japan
    • India
    • South Korea
    • South-east Asia
    • Rest of Asia Pacific
  • Latin America
    • Brazil
    • Argentina
    • Rest of Latin America
  • Middle East & Africa
    • GCC Countries
    • South Africa
    • Rest of the Middle East and Africa

Competitive Landscape

The Applied Ceramic Labeling market is moderately fragmented, with a mix of established players and specialized firms competing on innovation, customization, and print quality. Key companies such as Stanpac, Packsource Corporation, Chattanooga Labeling Systems, and Applied Ceramics lead the market by offering advanced labeling technologies and comprehensive product portfolios tailored to diverse end-user needs. Players like Ferro Corporation and Marabu GmbH & Co. KG focus on high-performance inks and ceramic coatings, enhancing durability and design appeal. Strategic initiatives such as mergers, acquisitions, product innovation, and capacity expansion are common as companies aim to strengthen global presence and technological capabilities. Additionally, partnerships with packaging manufacturers and beverage brands have become vital for expanding customer reach. The market also sees rising interest from niche players like Trinity Decals and Ceramic Decorating Company, which offer specialized, artisanal labeling solutions. As demand for premium and sustainable packaging grows, competition is expected to intensify through innovation and customization.

Key Player Analysis

  • Stanpac
  • Packsource Corporation
  • Chattanooga Labeling Systems
  • Applied Ceramics
  • DecoArt
  • Marabu GmbH & Co. KG
  • Ceramic Decorating Company
  • Kammann Machines
  • Ferro Corporation
  • Tullis Russell
  • Trinity Decals
  • SICPA

Recent Developments

  • In June 2025, Tullis Russell remains a prominent manufacturer in the global ceramic decal market, specializing in high-quality ceramic decals for applied ceramic labeling. They are recognized as a key player benefiting from the increasing demand for personalized, decorative, and durable ceramic products, particularly with advancements in digital and silkscreen decal technologies. The market's growth is fueled by the adoption of automation and AI-driven design tools, which Tullis Russell is effectively leveraging to improve production efficiency and design complexity.
  • In May 2025, Vibrantz Technologies, formerly Ferro Corporation, is continuing to develop digital ink technologies and porcelain enamel ceramic coatings for labeling applications, specifically focusing on digitally engineered inks for ceramics and glass. Their advancements allow for precise application and high-quality image reproduction on products like dinnerware, appliances, and packaging, offering enhanced durability, design flexibility, and eco-friendly solutions for ceramic labeling.
  • In 2023, Packsource Corporation launched a high-speed digital printing line for applied ceramic labeling, enhancing production efficiency and customization capabilities for clients in food, beverage, and personal care

Market Concentration & Characteristics

The Applied Ceramic Labeling Market exhibits a moderately concentrated structure with a mix of global and regional players competing on product quality, technology, and customization capabilities. It is characterized by high entry barriers due to the need for specialized equipment, skilled labor, and substantial capital investment. Leading companies focus on innovation in digital printing, multicolor application, and sustainable labeling solutions to differentiate their offerings. The market serves niche applications across food and beverage, cosmetics, and pharmaceuticals where durability, aesthetics, and brand identity are critical. It remains supply-sensitive, with raw material availability and energy costs directly influencing operational efficiency. Regional demand varies with packaging preferences, manufacturing standards, and regulatory policies.

Report Coverage

The research report offers an in-depth analysis based on Product Type, Printing Technique, End-User Industry and Geography. It details leading market players, providing an overview of their business, product offerings, investments, revenue streams, and key applications. Additionally, the report includes insights into the competitive environment, SWOT analysis, current market trends, as well as the primary drivers and constraints. Furthermore, it discusses various factors that have driven market expansion in recent years. The report also explores market dynamics, regulatory scenarios, and technological advancements that are shaping the industry. It assesses the impact of external factors and global economic changes on market growth. Lastly, it provides strategic recommendations for new entrants and established companies to navigate the complexities of the market.

Future Outlook

  1. The market will witness steady growth driven by increasing demand for premium packaging across food, beverage, and cosmetics sectors.
  2. Manufacturers will invest more in digital and multicolor printing technologies to enhance design flexibility and production efficiency.
  3. Sustainable packaging initiatives will encourage greater use of ceramic labels due to their recyclability and durability.
  4. Asia Pacific will continue to emerge as a high-growth region due to expanding manufacturing capacity and rising consumer demand.
  5. Companies will focus on product customization and limited-edition designs to attract niche consumer segments.
  6. Technological advancements will reduce production costs, making ceramic labeling more accessible to mid-sized businesses.
  7. Strategic partnerships between labeling firms and packaging manufacturers will strengthen market reach and innovation.
  8. Growing awareness of brand differentiation will drive adoption in sectors like pharmaceuticals and personal care.
  9. Regulatory support for recyclable and non-toxic labeling materials will favor ceramic label adoption.
  10. Market competition will intensify as new entrants and regional players enhance capabilities and diversify portfolios.
Applied Ceramic Labeling Market Size, Growth and Forecast 2032
Report Attribute Details
Details
Historical Period
-
Base Year
2024
Forecast Period
2024–2032
Applied Ceramic Labeling Size 2024
USD 1,336.63 million
Applied Ceramic Labeling CAGR
8.75%
Applied Ceramic Labeling Size 2032
USD 2,740.32 million

Request a Free Sample

Fill in your details and we'll send you a free sample report.

  • Sample data tables & charts
  • Research methodology

Need a Custom Version of This Report?

Tailor the scope, geography, or segments to your exact requirements.

  • Custom geography or segment scope
  • Direct access to our analyst team

Frequently Asked Questions

What is the current size of the Applied Ceramic Labeling Market?
The Applied Ceramic Labeling Market was valued at USD 1,336.63 million in 2024 and is projected to reach USD 2,740.32 million by 2032.
What factors are driving the growth of the Applied Ceramic Labeling Market?
Key drivers include rising demand for premium packaging, expansion in the beverage industry, and advancements in printing technologies.
What are some challenges faced by the Applied Ceramic Labeling Market?
Major challenges include high production costs, limited substrate compatibility, and complex manufacturing processes.
Who are the major players in the Applied Ceramic Labeling Market?
Prominent players include Stanpac, Applied Ceramics, Marabu GmbH & Co. KG, Ferro Corporation, and Packsource Corporation.

Table of Content

Chapter 1. Report Introduction

  • 1.1 Report Description & Purpose
    • 1.1.1 Report Title & Market Definition
    • 1.1.2 Unique Selling Propositions (USP) & Key Differentiators
    • 1.1.3 Value Proposition for Stakeholders
  • 1.2 Research Objectives
    • 1.2.1 Market Sizing Objectives (Volume & Revenue)
    • 1.2.2 Segmentation Objectives
    • 1.2.3 Competitive Intelligence Objectives
    • 1.2.4 Forecast & Scenario Objectives
  • 1.3 Report Scope
    • 1.3.1 Applied Ceramic Labeling Scope – Types & Subtypes Covered
    • 1.3.2 Geographic Scope – Regions & Countries Covered
    • 1.3.3 Historical Period, Base Year & Forecast Period (2024; forecast to 2032)
    • 1.3.4 Inclusions & Exclusions
  • 1.4 HS Code & Classification Framework
  • 1.5 Currency, Units & Pricing Basis
  • 1.6 Target Stakeholders
  • 1.7 Limitations & Assumptions

Chapter 2. Executive Summary

  • 2.1 Global Applied Ceramic Labeling Market Snapshot
    • 2.1.1 Market Size – Historical (2024) & Forecast (2024-2032) (2024: USD 1,336.63 million → 2032: USD 2,740.32 million)
    • 2.1.2 Volume & Revenue – Global Totals
    • 2.1.3 Key Market Highlights – Top Five Facts
  • 2.2 Applied Ceramic Labeling Market Segmentation Snapshot
    • 2.2.1 Market Split by Region – 2024 vs. 2032
  • 2.3 Competitive Snapshot
    • 2.3.1 Top 10 Players by Revenue Share – 2024
    • 2.3.2 Top 10 Players by Volume Share – 2024
    • 2.3.3 Recent Strategic Developments (18-Month Summary)
  • 2.4 Key Investment Highlights & Strategic Conclusions

Chapter 3. Applied Ceramic Labeling Market Dynamics & Industry Analysis

  • 3.1 Market Overview & Context
    • 3.1.1 Applied Ceramic Labeling Market Position in the Broader Automotive Value Chain
    • 3.1.2 OEM vs. Replacement Market Dynamics
    • 3.1.3 Market Maturity & Development Stage by Region
  • 3.2 Applied Ceramic Labeling Market Drivers
  • 3.3 Applied Ceramic Labeling Market Restraints & Challenges
  • 3.4 Applied Ceramic Labeling Market Opportunities
  • 3.5 Porter's Five Forces Analysis
    • 3.5.1 Threat of New Entrants
    • 3.5.2 Bargaining Power of Suppliers
    • 3.5.3 Bargaining Power of Buyers
    • 3.5.4 Threat of Substitutes
    • 3.5.5 Competitive Rivalry – Intensity Assessment
  • 3.6 Applied Ceramic Labeling Value Chain Analysis
    • 3.6.1 Upstream – Raw Material/Input Suppliers
      • 3.6.1.1 Raw Material/Input 1
      • 3.6.1.2 Raw Material/Input 2
      • 3.6.1.3 Raw Material/Input 3
    • 3.6.2 Midstream – Production/Manufacturing/Service Delivery
      • 3.6.2.1 Production/Process Overview
      • 3.6.2.2 Key Facility Locations & Capacity by Manufacturer
    • 3.6.3 Downstream – Distribution & End Consumer
      • 3.6.3.1 Primary Channel – B2B/OEM
      • 3.6.3.2 Secondary Channels – Dealer, Retail, Online, Direct
    • 3.6.4 Value Chain Profitability Analysis
  • 3.7 PESTEL Analysis
    • 3.7.1 Political Factors
    • 3.7.2 Economic Factors
    • 3.7.3 Social Factors
    • 3.7.4 Technological Factors
    • 3.7.5 Environmental Factors
    • 3.7.6 Legal Factors
  • 3.8 Applied Ceramic Labeling Supply Chain Analysis
    • 3.8.1 Raw Material/Input Supply Risk Assessment
    • 3.8.2 Manufacturing Concentration Risk (Geographic Exposure)
    • 3.8.3 Trade Disruption Impact Analysis
  • 3.9 Regulatory & Policy Landscape

Note: The regulatory and policy landscape section covers regulations based on their applicability to the market, Applied Ceramic Labeling category, geography, and scope of the study. Only regulatory frameworks with a material impact on operations, compliance, trade, sustainability, or market access are analyzed in detail.

Chapter 4. Key Investment Pockets & Opportunity Analysis

  • 4.1 Applied Ceramic Labeling Market Attractiveness Analysis
    • 4.1.1 By Region – Investment Attractiveness Matrix (Volume × CAGR)
  • 4.2 Absolute Revenue Growth Opportunity
    • 4.2.1 By Region – Absolute USD Growth Through 2032
  • 4.3 Incremental Volume Opportunity
    • 4.3.1 By Region – Incremental Volume Through 2032
    • 4.3.2 Segment – Incremental Volume
  • 4.4 Emerging Submarket Opportunity Deep Dive (Subject to Applicability)
  • 4.5 Emerging Market Opportunity Scorecards
    • 4.5.1 United States
    • 4.5.2 Europe
    • 4.5.3 Asia
    • 4.5.4 Middle East & Africa

Note: Emerging Market Opportunity Scorecards will be included based on relevance and strategic importance. Regions listed are indicative and may vary depending on data availability and market dynamics.

Chapter 5. Applied Ceramic Labeling Import-Export Analysis & Trade Flows

  • 5.1 Global Trade Overview
    • 5.1.1 Global Export Value by Country (2024)
    • 5.1.2 Global Export Volume by Country (2024)
    • 5.1.3 Global Import Value by Country (2024)
    • 5.1.4 Global Import Volume by Country (2024)
    • 5.1.5 Net Trade Balance by Country (2024)
  • 5.2 Export Analysis – Segment
    • 5.2.1 Type 1 (HS Code)
    • 5.2.2 Type 2 (HS Code)
    • 5.2.3 Type 3 (HS Code)
    • 5.2.4 Type 4 (HS Code)
    • 5.2.5 Type 5 (HS Code)
  • 5.3 Import Analysis – Segment
    • 5.3.1 Type 1 (HS Code)
    • 5.3.2 Type 2 (HS Code)
    • 5.3.3 Type 3 (HS Code)
    • 5.3.4 Type 4 (HS Code)
    • 5.3.5 Type 5 (HS Code)
  • 5.4 Average Unit Trade Prices
    • 5.4.1 Average Export Price – Segment & Country
    • 5.4.2 Average Import Price – Segment & Source Country
    • 5.4.3 Price Trends (2024)
  • 5.5 Key Trade Route Analysis
    • 5.5.1 Trade Route 1
    • 5.5.2 Trade Route 2
    • 5.5.3 Trade Route 3
    • 5.5.4 Trade Route 4
    • 5.5.5 Trade Route 5
  • 5.6 Trade Policy Impact Assessment
    • 5.6.1 US Anti-Dumping & Section 301 Tariffs
    • 5.6.2 EU Customs Union Impact
    • 5.6.3 Major Free Trade Agreements
    • 5.6.4 USMCA Rules of Origin

Note: Trade policy analysis will be included only where relevant to the Applied Ceramic Labeling market.

Chapter 6. Competitive Landscape & Company Benchmarking

  • 6.1 Applied Ceramic Labeling Market Concentration & Structure
    • 6.1.1 Herfindahl-Hirschman Index (HHI) – vs. 2024
    • 6.1.2 Tier 1, Tier 2 & Tier 3 Market Structure
    • 6.1.3 Global, Regional & Local Player Dynamics
  • 6.2 Applied Ceramic Labeling Market Share Analysis – 2024
    • 6.2.1 Global Revenue Share by Company
    • 6.2.2 Global Volume Share by Company
    • 6.2.3 Regional Revenue Share
    • 6.2.4 Market Share Evolution ( vs. 2024)
    • 6.2.5 OEM Segment Share by Company
    • 6.2.6 Replacement Segment Share by Company
  • 6.3 Production/Delivery Capacity & Facility Analysis
    • 6.3.1 Global Installed Capacity
    • 6.3.2 Capacity Utilization Rates
    • 6.3.3 Production/Output Volume
    • 6.3.4 Facility Locations & Capacity Map
    • 6.3.5 Planned Capacity Additions
  • 6.4 Applied Ceramic Labeling Competitive Benchmarking Matrix
    • 6.4.1 Revenue, Volume, CAGR & Profitability Comparison
    • 6.4.2 Channel Revenue Mix
    • 6.4.3 Geographic Revenue Exposure
    • 6.4.4 R&D Intensity
    • 6.4.5 Sustainability Maturity
  • 6.5 Strategic Developments in Applied Ceramic Labeling (Last 24 Months)
    • 6.5.1 Mergers, Acquisitions & Divestments
    • 6.5.2 New Applied Ceramic Labeling Launches
    • 6.5.3 Facility Expansions
    • 6.5.4 Strategic Alliances, Joint Ventures & Partnerships
    • 6.5.5 Distribution Expansion & Market Entry
    • 6.5.6 Sustainability & ESG Initiatives
  • 6.6 Competitive Strategy Mapping
    • 6.6.1 Leader, Challenger, Follower & Niche Classification
    • 6.6.2 Pricing Strategy Comparison
    • 6.6.3 Channel Strategy Matrix

Note: Strategic developments are included based on their materiality and the availability of reliable information.

Chapter 7. Global Applied Ceramic Labeling Market – By Distribution Channel

  • 7.1 Segment Overview
    • 7.1.1 Volume & Revenue Split by Channel (2024 & 2032)
    • 7.1.2 Channel Mix Evolution (2024-2032)

Chapter 8. Regional Market Analysis – Global Overview

  • 8.1 Global Regional Overview
    • 8.1.1 Regional Volume Share
    • 8.1.2 Regional Revenue Share
    • 8.1.3 Regional Volume by Region
    • 8.1.4 Regional Revenue by Region
    • 8.1.5 Regional Forecast Through 2032
  • 8.2 Cross-Regional Segment Analysis
    • 8.2.1 By Distribution Channel
    • 8.2.2 By Brand/Price Tier

Chapter 9. North America Applied Ceramic Labeling Market

  • 9.1 United States
  • 9.2 Canada
  • 9.3 Mexico

Chapter 10. Europe Applied Ceramic Labeling Market

  • 10.1 Germany
  • 10.2 France
  • 10.3 Italy
  • 10.4 United Kingdom
  • 10.5 Spain
  • 10.6 Poland
  • 10.7 Russia
  • 10.8 Netherlands
  • 10.9 Belgium
  • 10.10 Sweden
  • 10.11 Denmark
  • 10.12 Norway
  • 10.13 Rest of Europe

Chapter 11. Asia Pacific Applied Ceramic Labeling Market

  • 11.1 China
  • 11.2 India
  • 11.3 Japan
  • 11.4 South Korea
  • 11.5 Thailand
  • 11.6 Indonesia
  • 11.7 Vietnam
  • 11.8 Malaysia
  • 11.9 Australia
  • 11.10 Rest of Asia Pacific

Chapter 12. Latin America Applied Ceramic Labeling Market

  • 12.1 Brazil
  • 12.2 Argentina
  • 12.3 Colombia
  • 12.4 Chile
  • 12.5 Rest of Latin America

Chapter 13. Middle East Applied Ceramic Labeling Market

  • 13.1 Saudi Arabia
  • 13.2 United Arab Emirates
  • 13.3 Turkey
  • 13.4 Israel
  • 13.5 Iran
  • 13.6 Rest of the Middle East

Chapter 14. Africa Applied Ceramic Labeling Market

  • 14.1 South Africa
  • 14.2 Egypt
  • 14.3 Nigeria
  • 14.4 Morocco
  • 14.5 Rest of Africa

Chapter 15. Applied Ceramic Labeling Company Profiles

  • 15.1 [Company 01]
    • 15.1.1 Company Overview
    • 15.1.2 Key Management Personnel
    • 15.1.3 Products & Services Portfolio
    • 15.1.4 Financial Performance
    • 15.1.5 Key Market Focus & Geographic Presence
    • 15.1.6 Recent Developments & Strategic Initiatives

Note: The company profile list is preliminary and may change based on research findings, market developments, data availability, and client requirements.

Chapter 16. Appendices

  • Appendix A – List of Abbreviations & Acronyms
  • Appendix B – Industry Classification Code Reference – Full Series
  • Appendix C – Production & Capacity Data Tables
  • Appendix D – End-Use & Demand Base Tables
  • Appendix E – Consumption & Replacement Rate Assumptions
  • Appendix F – ASP Reference Tables
  • Appendix G – Manufacturing & Facility Database
  • Appendix H – Import-Export Data Tables
  • Appendix I – Regulatory Summary Tables
  • Appendix J – Primary Research Participant List (Anonymized)
  • Appendix K – Primary Research Questionnaire Framework
  • Appendix L – Data Sources & Bibliography
  • Appendix M – Market Size Divergence & Source Comparison

Chapter 17. Research Methodology

  • 17.1 Research Framework & Philosophy
  • 17.2 Secondary Research – Sources, Hierarchy & Data Extraction
  • 17.3 Data Modeling – Bottom-Up & Top-Down Market Sizing
  • 17.4 Primary Research – Stakeholder Framework, LOI & Sample Sizes
  • 17.5 Forecast Methodology – Regression, Scenario & Sensitivity Analysis
  • 17.6 Quality Control – Four-Layer Validation Framework
  • 17.7 Limitations & Standard Assumptions
  • 17.8 Disclaimer

Methodology

Meet the Team

Shweta Bisht
Shweta Bisht

Healthcare & Biotech Analyst

Shweta is a healthcare and biotech researcher with strong analytical skills in chemical and agri domains.

Related Topics

Sorbitan Esters Market Size, Growth, Share and Forecast 2032

The global Sorbitan Esters market was valued at USD 1,031.78 million in 2024 and is projected to reach USD 1,571.5 million by 2032, registering a CAGR of 5.4% during the forecast period.

Sonar Absorbing Rubber Composites Market Size and Forecast 2032

The global sonar absorbing rubber composites market was valued at USD 214.9 million in 2024 and is projected to reach USD 280.8 million by 2032, expanding at a CAGR of 3.4% during the forecast period, according to Credence Research.

Pressure Sensitive Adhesives Market Size, Share and Forecast 2032

The global pressure sensitive adhesives market was valued at USD 59,262.76 million in 2024 and is projected to reach USD 91,641.72 million by 2032, expanding at a CAGR of 5.6% during the forecast period, according to Credence Research.

Solution Styrene Butadiene Rubber (S-SBR) Market Size and Forecast 2032

The global solution styrene butadiene rubber (S-SBR) market was valued at USD 11,238.25 million in 2024 and is projected to reach USD 18,047.7 million by 2032, expanding at a CAGR of 6.1% during the forecast period, according to Credence Research.

Tall Oil Fatty Acid Market Size, Growth, Share and Forecast 2032

The global tall oil fatty acid market was valued at USD 3,289.6 million in 2024 and is projected to reach USD 5,125.58 million by 2032, expanding at a CAGR of 5.7% during the forecast period, according to Credence Research.

Carbon And Graphite Product Market Size, Share and Forecast 2032

The carbon and graphite product market was valued at USD 29,816 million in 2024 and is expected to reach USD 46,456.69 million by 2032. The market is projected to grow at a CAGR of 5.7% during the forecast period.