
Market Overview
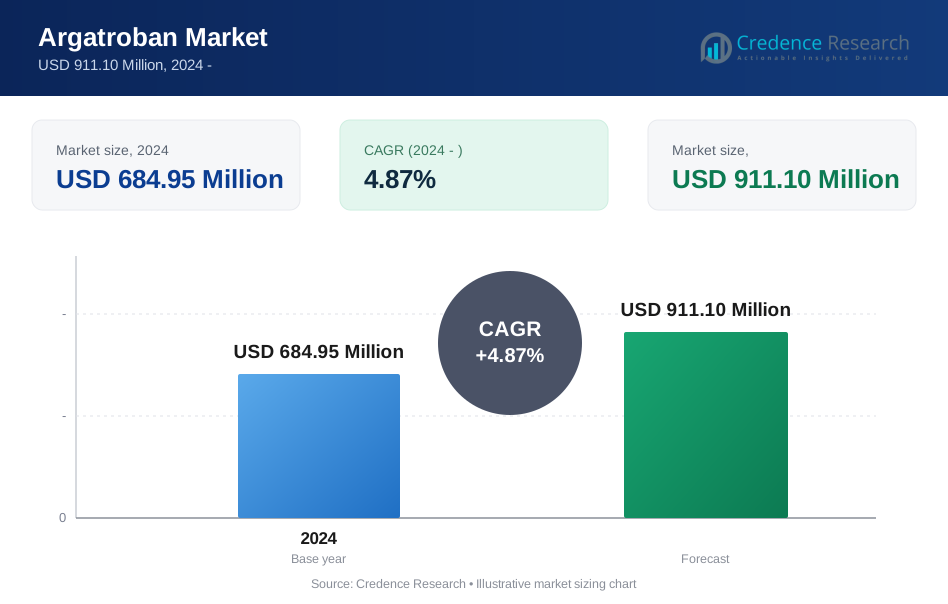
The Argatroban Market is projected to grow from USD 684.95 Million in 2024 to an estimated USD 911.10 Million by 2032, with a CAGR of 4.87% from 2024 to 2032. Growth reflects steady demand for direct thrombin inhibition in heparin-induced thrombocytopenia management and periprocedural anticoagulation during PCI. North America leads market revenue because hospitals there diagnose HIT more consistently, perform high PCI volumes and maintain broad access to sterile injectable anticoagulants.
| REPORT ATTRIBUTE | DETAILS |
|---|---|
| Historical Period: | 2020-2023 |
| Base Year | 2024 |
| Forecast Period | 2025-2032 |
| Argatroban Market Market Size 2024 | USD 684.95 Million |
| Argatroban Market CAGR | 4.87% |
| Argatroban Market Market Size 2032 | USD 911.10 Million |
Market Insights
- North America accounted for 39.6% of global Argatroban Market revenue in 2024, supported by strong hospital diagnosis rates for HIT and high PCI procedure volumes.
- HIT led indication demand with 68.4% share in 2024 because clinicians widely use argatroban when heparin exposure becomes contraindicated.
- Generic products held 61.2% of market revenue in 2024 as hospitals prioritized cost control, tender efficiency and multisource injectable procurement.
- Acute Care dominated care setting demand with 72.8% share in 2024 because most argatroban administration occurs in ICUs, surgical wards and emergency-led inpatient care.
- Mitsubishi Tanabe, Pfizer, Fresenius Kabi, Hikma and Baxter remain prominent players, while buyers increasingly favor reliable generic sterile injectables and resilient supply contracts.

Market Segmentation Analysis
By Indication (HIT, PCI Anticoagulation)
HIT held the largest share at 68.4% in 2024, driven by argatroban’s established role as non-heparin anticoagulation for patients with confirmed or suspected heparin-induced thrombocytopenia. Hospitals rely on it for rapid inpatient management, especially when thrombosis risk remains high and clinicians need tightly monitored intravenous therapy.
By Molecule Type (Branded, Generic)
Generic accounted for the largest share at 61.2% in 2024 because health systems increasingly favor lower-cost sterile injectables that meet formulary standards without compromising clinical utility. Tender-based procurement, group purchasing contracts and budget pressure across hospitals continue to accelerate generic substitution in mature markets.
By Care Setting (Acute Care, Cath Lab)
Acute Care captured the leading share at 72.8% in 2024, supported by concentrated argatroban use in ICUs, surgical recovery units and emergency inpatient settings. These environments require continuous infusion, close laboratory monitoring and fast treatment decisions for thrombocytopenia and thrombotic complications.
Key Growth Drivers
Expanding need for non-heparin anticoagulation in HIT care
Argatroban remains a preferred option when clinicians need rapid, titratable anticoagulation in patients with suspected or confirmed HIT. Hospitals value its intravenous administration, established ICU protocols and suitability for patients who cannot receive heparin.
Greater awareness of thrombocytopenia surveillance in surgical, oncology and critical care settings continues to increase testing and earlier therapeutic intervention. As health systems tighten patient-safety pathways, formulary committees favor agents backed by long clinical experience, predictable monitoring workflows and compatibility with complex inpatient care. This driver supports recurring demand from emergency departments, intensive care units and perioperative teams that need immediate anticoagulation without heparin exposure. Argatroban also retains relevance in patients with renal impairment, which broadens its utility in high-acuity inpatient populations where therapeutic flexibility matters.Rising interventional cardiology volumes support PCI anticoagulation demand
Argatroban gains use in catheterization laboratories when clinicians require direct thrombin inhibition during PCI, especially in patients with heparin sensitivity or high thrombotic risk. Global cardiovascular deaths exceeded 20 million in 2021, underscoring persistent disease burden that drives angiography and revascularization volumes.
As tertiary hospitals expand cath lab capacity, buyers seek anticoagulants that allow controlled dosing, continuous infusion and close activated clotting time management. Growth in complex coronary interventions, repeat procedures and older patient cohorts further supports demand. Suppliers that secure institutional contracts with cardiology centers benefit from steady procedural consumption and repeat ordering patterns. In markets with advanced cardiac care infrastructure, cath lab purchasing teams increasingly evaluate argatroban alongside broader procedural anticoagulation pathways, supporting stable use beyond traditional HIT-focused demand.Hospital cost control accelerates generic purchasing
Budget discipline increasingly shapes injectable anticoagulant procurement, pushing hospitals toward generic argatroban when therapeutic interchange policies allow. Generics delivered more than USD 445 billion in health care savings in the U.S. in 2023, reinforcing purchasing confidence in lower-cost multisource products.
Group purchasing organizations and integrated delivery networks now emphasize acquisition cost, continuity of supply, vial configurations and wholesaler reach alongside clinical performance. This environment favors manufacturers that combine competitive pricing with dependable sterile manufacturing and pharmacovigilance support. As reimbursement systems pressure hospitals to reduce pharmacy spend, generic argatroban gains share across acute care, especially in large systems that standardize contracts across multiple sites. Price-sensitive public hospitals in emerging markets also increasingly evaluate generic tenders for specialized anticoagulants.Key Trends & Opportunities
Hospitals prioritize supply resilience in sterile injectables
Procurement teams increasingly avoid single-source exposure in critical anticoagulants and prefer suppliers with redundant filling lines, strong wholesaler coverage and stable quality records. Health systems managed more than 270 active drug shortages in early 2024, which sharpened attention on supply assurance for acute-use injectables.
In argatroban, this trend supports multisource awards, safety-stock planning and closer vendor qualification. Buyers also scrutinize back-order history, lead times and packaging reliability because treatment delays in HIT or PCI can disrupt patient flow. Companies with resilient manufacturing footprints and consistent release performance strengthen formulary position.Protocol-based use expands in high-acuity settings
Hospitals increasingly manage argatroban through standardized order sets, anticoagulation stewardship teams and lab-linked dosing protocols. This trend improves dosing consistency in intensive care units and cath labs, where clinicians must balance thrombosis prevention against bleeding risk.
Electronic medication records and pharmacist-led monitoring encourage use in defined patient groups rather than ad hoc prescribing. Market participants therefore compete not only on price but also on labeling clarity, vial strengths and support for hospital workflow. As institutions standardize treatment pathways, suppliers with predictable presentation formats and dependable education materials can protect utilization within preferred product lists.Emerging-market generic penetration offers headroom
Many middle-income countries continue to expand tertiary hospitals, cardiac intervention programs and centralized procurement for essential injectables. These shifts create room for generic argatroban suppliers to enter formularies where clinicians need alternatives for HIT management or PCI in heparin-sensitive patients.
Tender-based purchasing favors manufacturers that can scale batches, meet registration timelines and support local distribution. Opportunity improves where public systems prioritize cost-effective specialty injectables and private hospital chains seek broader multisource availability. Companies that pair competitive bids with regulatory execution can widen market access in Asia Pacific, Latin America and selected Middle East markets.Value-added hospital services can lift differentiation
Argatroban remains a clinically specialized product, which gives suppliers room to compete through service rather than molecule novelty alone. Opportunities include barcode-ready packaging, clear dilution guidance, medical information support, training for pharmacy compounding teams and coordinated supply planning with hospital networks.
Such features reduce handling errors and improve confidence among procurement and clinical stakeholders. Manufacturers can also deepen reach through GPO alignment, regional distributor partnerships and portfolio bundling with other critical care injectables. In a market where formulation differentiation remains limited, operational support and service quality can improve account retention and pricing stability.Key Challenges
Bleeding risk and monitoring complexity constrain broader use
Argatroban requires careful dosing, activated partial thromboplastin time monitoring and clinician familiarity with hepatic adjustment. These requirements limit use in smaller facilities that lack specialized anticoagulation workflows or rapid lab turnaround.
In critically ill patients, comorbidities and concomitant antithrombotic therapy can complicate titration, which makes some prescribers cautious. Because therapeutic decisions must balance thrombosis and bleeding risk, hospitals often restrict use to defined protocols and specialist oversight. This clinical complexity narrows spontaneous adoption outside core acute-care and interventional settings.Price pressure and sterile manufacturing risk compress competition
Market participants face strong procurement pressure from hospital tenders, group contracts and generic substitution policies. At same time, argatroban depends on high-quality sterile injectable manufacturing, where deviations can trigger supply interruptions, recalls or extended remediation costs.
Buyers increasingly shift volume toward suppliers that can prove continuity, which raises barriers for smaller entrants. Import dependence in several regions also exposes distributors to freight volatility, regulatory delays and currency swings. These factors can erode margins even when demand remains stable, making long-term profitability more difficult than volume growth suggests.Regional Analysis
North America Argatroban Market Market Trends
North America accounted for 39.6% of global Argatroban Market revenue in 2024. Region benefits from strong HIT awareness, broad use of anticoagulation stewardship and high procedural volumes in interventional cardiology. U.S. hospitals and large Canadian centers purchase argatroban mainly through group purchasing organizations, integrated delivery networks and national wholesalers, which favors suppliers with deep hospital distribution. Generic penetration remains high because pharmacy teams focus on acquisition cost and supply continuity for critical injectables. Regulatory oversight for sterile manufacturing and lot release remains strict, so quality performance strongly influences formulary retention and contract wins.
Asia Pacific Argatroban Market Market Trends
Asia Pacific accounted for 23.8% of global Argatroban Market revenue in 2024. Demand rises with expanding tertiary hospitals, higher cardiovascular case loads and greater access to cath labs across large urban centers. Japan remains an important market because clinicians have long experience with branded hospital therapies and tightly protocolized inpatient care. China and India support volume growth through broader generic availability, expanding hospital procurement and local distribution reach into multispecialty centers. Pricing remains mixed across region, with mature markets paying for quality assurance while developing markets prioritize affordability and registration speed.
Europe Argatroban Market Market Trends
Europe accounted for 27.1% of global Argatroban Market revenue in 2024. Region shows stable demand from university hospitals, cardiac centers and hematology-led inpatient care, particularly in Western Europe. Public procurement and hospital tender systems shape pricing, which increases pressure on suppliers to balance low bids with dependable sterile injectable supply. Clinical uptake remains supported by formal anticoagulation pathways and consistent use in patients who cannot receive heparin. Competition centers on regulatory compliance, pharmacovigilance credibility and ability to serve national and cross-border hospital pharmacy channels without disruption.
Latin America Argatroban Market Market Trends
Latin America accounted for 5.4% of global Argatroban Market revenue in 2024. Demand concentrates in major urban hospitals, private cardiac centers and referral institutions that manage complex thrombosis and PCI cases. Public sector budgets and tender timing can create uneven ordering patterns, while import dependence affects availability and final pricing. Buyers often prefer generic options when reimbursement is limited, yet supply reliability remains a decisive factor because treatment alternatives may not be immediately available. Brazil and Mexico anchor regional demand through larger hospital networks, stronger cardiology infrastructure and broader access to specialized inpatient care.
Middle East & Africa Argatroban Market Market Trends
Middle East & Africa accounted for 4.1% of global Argatroban Market revenue in 2024. Demand remains concentrated in Gulf tertiary hospitals, large private health systems and a limited number of advanced referral centers in South Africa and North Africa. Imported supply dominates market structure, which makes distributor capability, cold-chain discipline where required and regulatory clearance timelines central to commercial performance. Government-led investment in cardiac care and critical care capacity supports gradual uptake in higher-income markets. Across much of Sub-Saharan Africa, adoption stays constrained by limited specialist diagnosis, smaller cath lab footprints and tight hospital pharmacy budgets.
Market Segmentations
- By Indication
- HIT
- PCI Anticoagulation
- By Molecule Type
- Branded
- Generic
- By Care Setting
- Acute Care
- Cath Lab
- By Geography
- North America
- Europe
- Asia Pacific
- Latin America
- Middle East & Africa
Competitive Landscape
Competition in Argatroban Market centers less on molecule innovation and more on manufacturing reliability, regulatory compliance and hospital account access. Companies compete through sterile injectable quality systems, consistent vial supply, pharmacovigilance support and labeling clarity that fits ICU and cath lab workflows.
Branded suppliers defend share through clinical familiarity and established hospital relationships, while generic producers press advantage through price discipline and multisource contracting. Distribution strength matters because acute care buyers rely on wholesalers, group purchasing organizations and direct health-system agreements to secure uninterrupted supply. Partnerships with regional distributors and portfolio bundling with adjacent injectables help widen reach. Competitive intensity remains moderate to high, especially in North America and Europe, where tender awards and formulary reviews can quickly shift volume. This dynamic favors scale players with established sterile networks and responsive medical support rather than firms competing on price alone.Key Player Analysis
- Mitsubishi Tanabe
- Pfizer
- Fresenius Kabi
- Hikma, Baxter
- Teva
- Dr. Reddy’s
- Sun Pharma
- Accord
- Viatris
Recent Developments
- In January 2025, Hikma said it expanded U.S. hospital injectables promotion to include argatroban more actively, aiming to strengthen coverage across acute care customer accounts.
- In July 2025, Fresenius Kabi said it aligned distribution across selected sterile injectables in Europe and North America, improving hospital access for argatroban through broader contract reach.
- In February 2026, Viatris said it optimized its sterile injectables network after portfolio integration steps, with the move intended to support more reliable fulfillment for argatroban and related critical care products.
Request a Free Sample
Fill in your details and we'll send you a free sample report.
- Sample data tables & charts
- Research methodology
Need a Custom Version of This Report?
Tailor the scope, geography, or segments to your exact requirements.
- Custom geography or segment scope
- Direct access to our analyst team
Frequently Asked Questions
What is the current size of the Argatroban Market?
What is driving growth in the Argatroban Market?
What trend is shaping the Argatroban Market?
Which segments lead the Argatroban Market?
Who are the top players in the Argatroban Market?
Table of Content
Chapter 1. Report Introduction
- 1.1 Report Description & Purpose
- 1.1.1 Report Title & Market Definition
- 1.1.2 Unique Selling Propositions (USP) & Key Differentiators
- 1.1.3 Value Proposition for Stakeholders
- 1.2 Research Objectives
- 1.2.1 Market Sizing Objectives (Volume & Revenue)
- 1.2.2 Segmentation Objectives
- 1.2.3 Competitive Intelligence Objectives
- 1.2.4 Forecast & Scenario Objectives
- 1.3 Report Scope
- 1.3.1 Argatroban Scope – Types & Subtypes Covered
- 1.3.2 Geographic Scope – Regions & Countries Covered
- 1.3.3 Historical Period, Base Year & Forecast Period (2024; forecast to the forecast period)
- 1.3.4 Inclusions & Exclusions
- 1.4 HS Code & Classification Framework
- 1.5 Currency, Units & Pricing Basis
- 1.6 Target Stakeholders
- 1.7 Limitations & Assumptions
Chapter 2. Executive Summary
- 2.1 Global Argatroban Market Snapshot
- 2.1.1 Market Size – Historical (2024) & Forecast (the forecast period) (2024: USD 684.95 Million → forecast year: USD 911.10 Million)
- 2.1.2 Volume & Revenue – Global Totals
- 2.1.3 Key Market Highlights – Top Five Facts
- 2.2 Argatroban Market Segmentation Snapshot
- 2.2.1 Market Split by Region – 2024 vs.
- 2.3 Competitive Snapshot
- 2.3.1 Top 10 Players by Revenue Share – 2024
- 2.3.2 Top 10 Players by Volume Share – 2024
- 2.3.3 Recent Strategic Developments (18-Month Summary)
- 2.4 Key Investment Highlights & Strategic Conclusions
Chapter 3. Argatroban Market Dynamics & Industry Analysis
- 3.1 Market Overview & Context
- 3.1.1 Argatroban Market Position in the Broader Automotive Value Chain
- 3.1.2 OEM vs. Replacement Market Dynamics
- 3.1.3 Market Maturity & Development Stage by Region
- 3.2 Argatroban Market Drivers
- 3.3 Argatroban Market Restraints & Challenges
- 3.4 Argatroban Market Opportunities
- 3.5 Porter's Five Forces Analysis
- 3.5.1 Threat of New Entrants
- 3.5.2 Bargaining Power of Suppliers
- 3.5.3 Bargaining Power of Buyers
- 3.5.4 Threat of Substitutes
- 3.5.5 Competitive Rivalry – Intensity Assessment
- 3.6 Argatroban Value Chain Analysis
- 3.6.1 Upstream – Raw Material/Input Suppliers
- 3.6.1.1 Raw Material/Input 1
- 3.6.1.2 Raw Material/Input 2
- 3.6.1.3 Raw Material/Input 3
- 3.6.2 Midstream – Production/Manufacturing/Service Delivery
- 3.6.2.1 Production/Process Overview
- 3.6.2.2 Key Facility Locations & Capacity by Manufacturer
- 3.6.3 Downstream – Distribution & End Consumer
- 3.6.3.1 Primary Channel – B2B/OEM
- 3.6.3.2 Secondary Channels – Dealer, Retail, Online, Direct
- 3.6.4 Value Chain Profitability Analysis
- 3.6.1 Upstream – Raw Material/Input Suppliers
- 3.7 PESTEL Analysis
- 3.7.1 Political Factors
- 3.7.2 Economic Factors
- 3.7.3 Social Factors
- 3.7.4 Technological Factors
- 3.7.5 Environmental Factors
- 3.7.6 Legal Factors
- 3.8 Argatroban Supply Chain Analysis
- 3.8.1 Raw Material/Input Supply Risk Assessment
- 3.8.2 Manufacturing Concentration Risk (Geographic Exposure)
- 3.8.3 Trade Disruption Impact Analysis
- 3.9 Regulatory & Policy Landscape
Note: The regulatory and policy landscape section covers regulations based on their applicability to the market, Argatroban category, geography, and scope of the study. Only regulatory frameworks with a material impact on operations, compliance, trade, sustainability, or market access are analyzed in detail.
Chapter 4. Key Investment Pockets & Opportunity Analysis
- 4.1 Argatroban Market Attractiveness Analysis
- 4.1.1 By Region – Investment Attractiveness Matrix (Volume × CAGR)
- 4.2 Absolute Revenue Growth Opportunity
- 4.2.1 By Region – Absolute USD Growth Through the forecast period
- 4.3 Incremental Volume Opportunity
- 4.3.1 By Region – Incremental Volume Through the forecast period
- 4.3.2 Segment – Incremental Volume
- 4.4 Emerging Submarket Opportunity Deep Dive (Subject to Applicability)
- 4.5 Emerging Market Opportunity Scorecards
- 4.5.1 United States
- 4.5.2 Europe
- 4.5.3 Asia
- 4.5.4 Middle East & Africa
Note: Emerging Market Opportunity Scorecards will be included based on relevance and strategic importance. Regions listed are indicative and may vary depending on data availability and market dynamics.
Chapter 5. Argatroban Import-Export Analysis & Trade Flows
- 5.1 Global Trade Overview
- 5.1.1 Global Export Value by Country (2024)
- 5.1.2 Global Export Volume by Country (2024)
- 5.1.3 Global Import Value by Country (2024)
- 5.1.4 Global Import Volume by Country (2024)
- 5.1.5 Net Trade Balance by Country (2024)
- 5.2 Export Analysis – Segment
- 5.2.1 Type 1 (HS Code)
- 5.2.2 Type 2 (HS Code)
- 5.2.3 Type 3 (HS Code)
- 5.2.4 Type 4 (HS Code)
- 5.2.5 Type 5 (HS Code)
- 5.3 Import Analysis – Segment
- 5.3.1 Type 1 (HS Code)
- 5.3.2 Type 2 (HS Code)
- 5.3.3 Type 3 (HS Code)
- 5.3.4 Type 4 (HS Code)
- 5.3.5 Type 5 (HS Code)
- 5.4 Average Unit Trade Prices
- 5.4.1 Average Export Price – Segment & Country
- 5.4.2 Average Import Price – Segment & Source Country
- 5.4.3 Price Trends (2024)
- 5.5 Key Trade Route Analysis
- 5.5.1 Trade Route 1
- 5.5.2 Trade Route 2
- 5.5.3 Trade Route 3
- 5.5.4 Trade Route 4
- 5.5.5 Trade Route 5
- 5.6 Trade Policy Impact Assessment
- 5.6.1 US Anti-Dumping & Section 301 Tariffs
- 5.6.2 EU Customs Union Impact
- 5.6.3 Major Free Trade Agreements
- 5.6.4 USMCA Rules of Origin
Note: Trade policy analysis will be included only where relevant to the Argatroban market.
Chapter 6. Competitive Landscape & Company Benchmarking
- 6.1 Argatroban Market Concentration & Structure
- 6.1.1 Herfindahl-Hirschman Index (HHI) – vs. 2024
- 6.1.2 Tier 1, Tier 2 & Tier 3 Market Structure
- 6.1.3 Global, Regional & Local Player Dynamics
- 6.2 Argatroban Market Share Analysis – 2024
- 6.2.1 Global Revenue Share by Company
- 6.2.2 Global Volume Share by Company
- 6.2.3 Regional Revenue Share
- 6.2.4 Market Share Evolution ( vs. 2024)
- 6.2.5 OEM Segment Share by Company
- 6.2.6 Replacement Segment Share by Company
- 6.3 Production/Delivery Capacity & Facility Analysis
- 6.3.1 Global Installed Capacity
- 6.3.2 Capacity Utilization Rates
- 6.3.3 Production/Output Volume
- 6.3.4 Facility Locations & Capacity Map
- 6.3.5 Planned Capacity Additions
- 6.4 Argatroban Competitive Benchmarking Matrix
- 6.4.1 Revenue, Volume, CAGR & Profitability Comparison
- 6.4.2 Channel Revenue Mix
- 6.4.3 Geographic Revenue Exposure
- 6.4.4 R&D Intensity
- 6.4.5 Sustainability Maturity
- 6.5 Strategic Developments in Argatroban (Last 24 Months)
- 6.5.1 Mergers, Acquisitions & Divestments
- 6.5.2 New Argatroban Launches
- 6.5.3 Facility Expansions
- 6.5.4 Strategic Alliances, Joint Ventures & Partnerships
- 6.5.5 Distribution Expansion & Market Entry
- 6.5.6 Sustainability & ESG Initiatives
- 6.6 Competitive Strategy Mapping
- 6.6.1 Leader, Challenger, Follower & Niche Classification
- 6.6.2 Pricing Strategy Comparison
- 6.6.3 Channel Strategy Matrix
Note: Strategic developments are included based on their materiality and the availability of reliable information.
Chapter 7. Global Argatroban Market – By Distribution Channel
- 7.1 Segment Overview
- 7.1.1 Volume & Revenue Split by Channel (2024 & )
- 7.1.2 Channel Mix Evolution (the forecast period)
Chapter 8. Regional Market Analysis – Global Overview
- 8.1 Global Regional Overview
- 8.1.1 Regional Volume Share
- 8.1.2 Regional Revenue Share
- 8.1.3 Regional Volume by Region
- 8.1.4 Regional Revenue by Region
- 8.1.5 Regional Forecast Through the forecast period
- 8.2 Cross-Regional Segment Analysis
- 8.2.1 By Distribution Channel
- 8.2.2 By Brand/Price Tier
Chapter 9. North America Argatroban Market
- 9.1 United States
- 9.2 Canada
- 9.3 Mexico
Chapter 10. Europe Argatroban Market
- 10.1 Germany
- 10.2 France
- 10.3 Italy
- 10.4 United Kingdom
- 10.5 Spain
- 10.6 Poland
- 10.7 Russia
- 10.8 Netherlands
- 10.9 Belgium
- 10.10 Sweden
- 10.11 Denmark
- 10.12 Norway
- 10.13 Rest of Europe
Chapter 11. Asia Pacific Argatroban Market
- 11.1 China
- 11.2 India
- 11.3 Japan
- 11.4 South Korea
- 11.5 Thailand
- 11.6 Indonesia
- 11.7 Vietnam
- 11.8 Malaysia
- 11.9 Australia
- 11.10 Rest of Asia Pacific
Chapter 12. Latin America Argatroban Market
- 12.1 Brazil
- 12.2 Argentina
- 12.3 Colombia
- 12.4 Chile
- 12.5 Rest of Latin America
Chapter 13. Middle East Argatroban Market
- 13.1 Saudi Arabia
- 13.2 United Arab Emirates
- 13.3 Turkey
- 13.4 Israel
- 13.5 Iran
- 13.6 Rest of the Middle East
Chapter 14. Africa Argatroban Market
- 14.1 South Africa
- 14.2 Egypt
- 14.3 Nigeria
- 14.4 Morocco
- 14.5 Rest of Africa
Chapter 15. Argatroban Company Profiles
- 15.1 [Company 01]
- 15.1.1 Company Overview
- 15.1.2 Key Management Personnel
- 15.1.3 Products & Services Portfolio
- 15.1.4 Financial Performance
- 15.1.5 Key Market Focus & Geographic Presence
- 15.1.6 Recent Developments & Strategic Initiatives
Note: The company profile list is preliminary and may change based on research findings, market developments, data availability, and client requirements.
Chapter 16. Appendices
- Appendix A – List of Abbreviations & Acronyms
- Appendix B – Industry Classification Code Reference – Full Series
- Appendix C – Production & Capacity Data Tables
- Appendix D – End-Use & Demand Base Tables
- Appendix E – Consumption & Replacement Rate Assumptions
- Appendix F – ASP Reference Tables
- Appendix G – Manufacturing & Facility Database
- Appendix H – Import-Export Data Tables
- Appendix I – Regulatory Summary Tables
- Appendix J – Primary Research Participant List (Anonymized)
- Appendix K – Primary Research Questionnaire Framework
- Appendix L – Data Sources & Bibliography
- Appendix M – Market Size Divergence & Source Comparison
Chapter 17. Research Methodology
- 17.1 Research Framework & Philosophy
- 17.2 Secondary Research – Sources, Hierarchy & Data Extraction
- 17.3 Data Modeling – Bottom-Up & Top-Down Market Sizing
- 17.4 Primary Research – Stakeholder Framework, LOI & Sample Sizes
- 17.5 Forecast Methodology – Regression, Scenario & Sensitivity Analysis
- 17.6 Quality Control – Four-Layer Validation Framework
- 17.7 Limitations & Standard Assumptions
- 17.8 Disclaimer
