
Automated Ophthalmic Perimeters Market Overview:
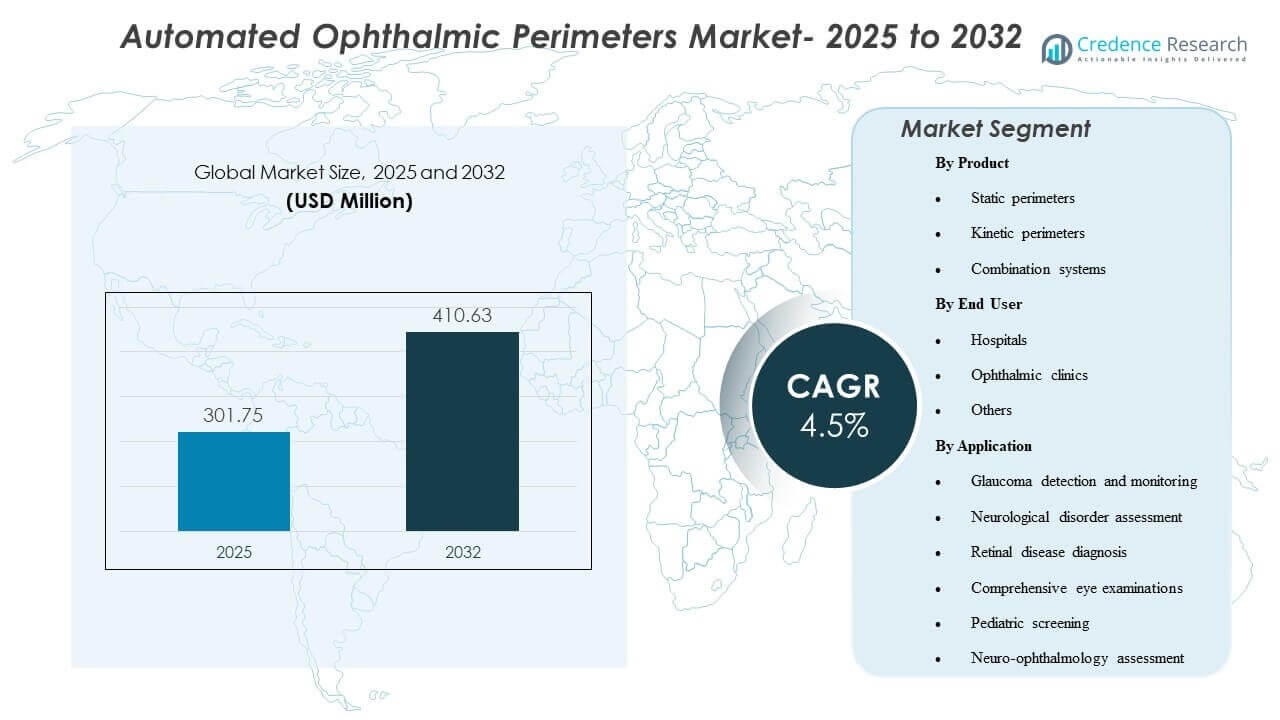
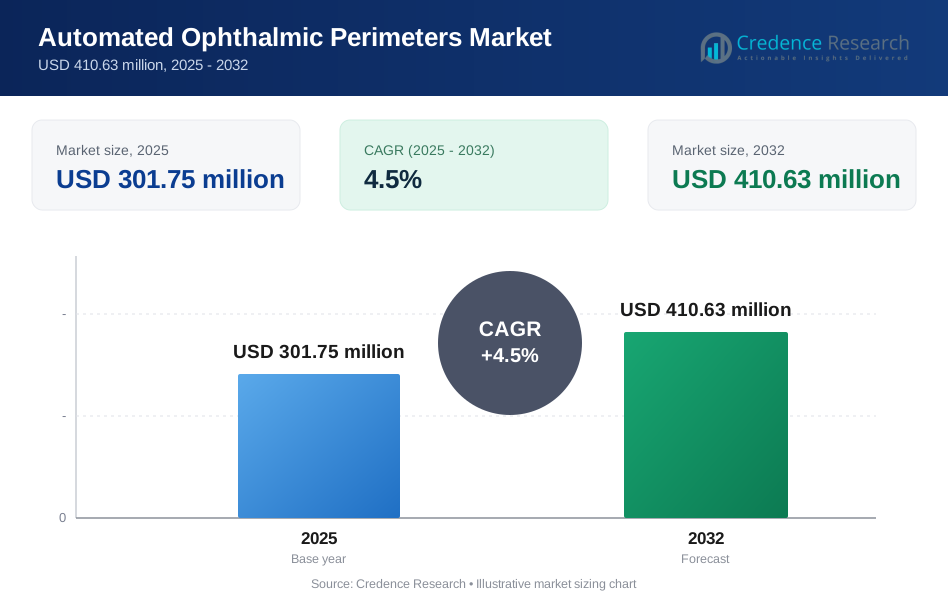
The global Automated Ophthalmic Perimeters Market size was valued at USD 301.75 million in 2025 and is expected to reach USD 410.63 million by 2032, growing at a CAGR of 4.5% from 2025 to 2032. Demand is primarily driven by the rising clinical need for reliable functional vision assessment in glaucoma care, where repeatable visual field testing supports earlier detection and tighter progression monitoring. Growth is further supported by modernization of ophthalmic diagnostic workflows, including faster test strategies, improved patient comfort, and broader adoption across specialty eye-care settings.
| REPORT ATTRIBUTE | DETAILS |
|---|---|
| Historical Period | 2020-2024 |
| Base Year | 2025 |
| Forecast Period | 2026-2032 |
| Automated Ophthalmic Perimeters Market Size 2025 | USD 301.75 million |
| Automated Ophthalmic Perimeters Market, CAGR | 4.5% |
| Automated Ophthalmic Perimeters Market Size 2032 | USD 410.63 million |
Key Market Trends & Insights
- The Automated Ophthalmic Perimeters Market is projected to grow from USD 301.75 million in 2025 to USD 410.63 million by 2032 at a CAGR of 4.5% (2025–2032).
- Static perimeters accounted for the largest product share of 37.6% in 2025, reflecting their central role in routine visual field testing pathways.
- Ophthalmic clinics accounted for the largest end-user share of 54.3% in 2025, supported by higher test throughput and dedicated glaucoma monitoring workflows.
- Glaucoma detection and monitoring accounted for the largest application share of 58.1% in 2025, reinforcing glaucoma as the dominant utilization driver for automated perimetry.
- Combination systems are increasingly positioned for broader clinical coverage as clinics seek to consolidate static and kinetic capabilities within single-platform workflows in the 2025–2032 forecast window.
Segment Analysis
Product and workflow preferences continue to shift toward solutions that reduce test time and improve repeatability without sacrificing diagnostic confidence. Faster thresholding strategies and software-led progression tracking are influencing upgrade decisions, particularly in high-volume settings that balance physician time, technician capacity, and patient tolerance. In parallel, device vendors are strengthening connectivity and analytics layers to improve longitudinal monitoring, which elevates the importance of consistent test protocols and data comparability across visits.
Adoption dynamics also reflect the growing emphasis on space efficiency and deployment flexibility in outpatient environments. Compact formats and alternative form factors are gaining interest in screening-oriented workflows and sites that lack dedicated dark rooms or large diagnostic suites. As clinics standardize glaucoma pathways and expand neuro-ophthalmic assessment capabilities, purchasing decisions increasingly weigh patient experience, workflow integration, and service support alongside core test performance.
By Product Insights
Static perimeters accounted for the largest share of 37.6% in 2025. Static testing remains the most routinely deployed modality for glaucoma detection and longitudinal follow-up, supported by established clinical protocols and comparability across repeat visits. Workflow optimization is a key factor, as faster testing approaches and refined algorithms help clinics improve throughput and reduce patient fatigue. Static platforms also benefit from strong integration with progression analysis tools, which reinforces repeat utilization and replacement demand in practices focused on chronic disease management.
By End User Insights
Ophthalmic clinics accounted for the largest share of 54.3% in 2025. Specialty clinics typically run higher perimetry volumes per device due to concentrated glaucoma caseloads and structured follow-up schedules. These settings are more likely to invest in advanced perimetry features that support standardized testing, progression monitoring, and streamlined technician workflows. Clinics also benefit from tighter operational control over scheduling and testing protocols, which helps sustain utilization rates and supports faster refresh cycles compared to broader hospital-based deployment.
By Application Insights
Glaucoma detection and monitoring accounted for the largest share of 58.1% in 2025. Automated perimetry is widely used to identify functional field loss and track progression over time, making glaucoma the most consistent and repeat-driven application category. Ongoing monitoring requirements create recurring testing demand, especially for patients on treatment pathways that require longitudinal evaluation. The clinical importance of early detection and progression tracking further supports technology upgrades that improve reproducibility, reduce test time, and strengthen clinician confidence in trend interpretation.
Automated Ophthalmic Perimeters Market Drivers
Rising Glaucoma Case Management and Longitudinal Monitoring Needs
Glaucoma care relies heavily on repeatable functional testing to confirm progression and guide therapy adjustments. Automated perimetry supports standardized protocols that enable comparisons across visits, which increases routine testing volumes in clinical practice. As clinicians aim to intervene earlier, demand grows for tools that detect subtle functional changes and support confident decision-making. This reinforces replacement cycles and upgrades toward platforms that deliver consistent outputs and progression-ready analytics.
- For instance, iCare states that its COMPASS perimeter captures retinal images 25 times per second for active retinal tracking, while a clinical evaluation reported that its 95% limits of agreement in the central 10 degrees were about 20% narrower than Humphrey Field Analyzer, which supports more stable long-term follow-up.
Workflow Efficiency Improvements in Ophthalmic Diagnostics
Clinics and hospitals increasingly prioritize throughput and patient experience in diagnostic testing. Perimetry systems that reduce testing time and simplify setup can expand daily test capacity and improve patient compliance. Software enhancements that reduce technician burden and streamline interpretation also increase utilization intensity. Over time, workflow gains become a primary economic justification for upgrading devices beyond base functionality.
- For instance, ZEISS says Humphrey Field Analyzer 3 with SITA Faster 24-2 is approximately 50% faster than SITA Standard and about 30% quicker than SITA Fast while offering the same reproducibility.
Expansion of Specialty Eye-Care Networks and Outpatient Testing Capacity
Growth in ophthalmic clinics and specialty eye-care chains increases demand for standardized diagnostic equipment across multiple sites. Network operators tend to favor consistent test methodologies and centralized data practices that support clinical governance. Automated perimetry becomes a core diagnostic asset in these settings due to recurring glaucoma monitoring demand. This structural shift supports sustained placement growth, particularly in high-volume outpatient environments.
Broader Use in Neuro-Ophthalmic and Multi-Condition Assessment
Beyond glaucoma, perimetry contributes to evaluation of neurological disorders, neuro-ophthalmology conditions, and broader clinical assessments. As referrals rise for complex cases, clinics seek flexible platforms capable of supporting diverse testing needs. Combination capability and improved analytics support broader case mix handling without fragmenting workflows across multiple instruments. This expands addressable demand beyond single-indication purchasing behavior.
Automated Ophthalmic Perimeters Market Challenges
Automated perimetry adoption is constrained by patient cooperation requirements and test variability driven by fatigue, attention, and learning effects. These factors can increase repeat testing needs and complicate progression interpretation in borderline cases. Clinics must invest in technician training and standardized protocols to ensure consistency, which adds operational overhead. Variability concerns can slow adoption of newer form factors until confidence in repeatability is well established.
- For instance, Carl Zeiss Meditec states that its Humphrey Field Analyzer 3 with SITA Faster 24-2 is approximately 50% faster than SITA Standard and about 30% quicker than SITA Fast while offering the same reproducibility, a measurable improvement aimed at reducing fatigue-related variability during threshold testing.
Cost sensitivity remains a barrier in settings with limited diagnostic budgets, particularly outside major urban centers. Purchase decisions often compete with other ophthalmic imaging priorities, which can delay replacement cycles for perimetry systems that remain operational. Service availability and calibration needs also influence lifecycle economics, especially for multi-site networks. As a result, vendors must balance advanced feature sets with clear workflow and clinical value articulation.
Automated Ophthalmic Perimeters Market Trends and Opportunities
Technology differentiation is increasingly centered on faster test strategies, improved patient comfort, and software-supported progression monitoring. Platforms that integrate data management, interpretation support, and longitudinal tracking can strengthen clinical confidence and reduce time-to-decision. This trend supports opportunities in workflow-integrated ecosystems, where perimetry becomes part of a connected glaucoma management pathway. Vendors that align product design to standardized clinic operations are well positioned to capture upgrades and multi-site deployments.
Alternative form factors and compact deployment models are expanding access in space-constrained environments and screening-oriented workflows. Solutions that reduce room dependency and simplify installation can unlock incremental demand in outpatient sites and emerging markets. The opportunity is strongest where growing specialty clinic footprints and rising chronic eye disease burdens increase testing volumes. Over the forecast period, flexible deployment combined with consistent test outputs can broaden adoption beyond traditional instrument-room settings.
- For instance, CREWT Medical states that its portable IMOvifa smart perimeter does not require a dark room and reduces glaucomatous-eye test time from 7 minutes 24 seconds with conventional SAP to 5 minutes 40 seconds with its AIZE algorithm.
Regional Insights
North America (34.7%)
North America remains a leading region for automated perimetry adoption, supported by mature ophthalmology infrastructure and high utilization in glaucoma monitoring pathways. Specialty clinics and multi-physician practices drive demand for workflow-efficient systems that support standardized testing and progression tracking. Replacement demand is reinforced by expectations for integrated software workflows and reliable service coverage.
Europe (22.9%)
Europe shows strong demand anchored in established glaucoma care protocols and broad access to specialty ophthalmology services in major markets. Purchasing decisions emphasize clinical reliability, reproducibility, and integration into routine outpatient workflows. Modernization of diagnostic suites supports steady replacement, particularly in high-volume clinics and hospital eye departments.
Asia Pacific (26.4%)
Asia Pacific is supported by expanding eye-care access, rising chronic disease burden, and ongoing investment in hospital and clinic diagnostic capacity. Growth in outpatient ophthalmology networks and earlier detection priorities reinforces demand for efficient perimetry workflows. Large-population markets increase testing volumes, raising the importance of faster protocols and scalable deployment.
Latin America (7.8%)
Latin America demand is led by private ophthalmology groups and larger urban hospitals investing in core diagnostic platforms. Adoption is supported by gradual modernization of eye-care services, although budget constraints can extend replacement cycles. Vendor service footprint and training support remain key purchase criteria to maintain consistent testing protocols.
Middle East & Africa (8.2%)
Middle East & Africa adoption is driven by investments in specialty care capacity, particularly in higher-spend markets with expanding hospital networks and private clinics. Diagnostic infrastructure growth and rising focus on chronic eye disease management support demand. Underpenetration in several subregions creates longer-term potential, but access variability can limit near-term growth.
Competitive Landscape
Competition in automated ophthalmic perimeters is shaped by product performance consistency, workflow efficiency, and software capabilities that support progression monitoring and interpretation confidence. Vendors differentiate through faster test strategies, platform reliability, connectivity, and integration into broader ophthalmic diagnostic workflows. Service coverage, training support, and installed-base upgrade paths influence buyer decisions, particularly among multi-site clinic networks. Product portfolios that address both routine glaucoma monitoring and broader neuro-ophthalmic assessment needs strengthen competitive positioning.
Carl Zeiss Meditec / ZEISS International is widely recognized for emphasizing integrated perimetry workflows aligned to glaucoma management, combining test strategy performance with software-enabled longitudinal analysis. The company’s approach commonly focuses on clinical repeatability, progression tracking, and interoperability with complementary ophthalmic diagnostics. This positioning supports adoption in high-volume glaucoma practices that value standardized testing and consistent longitudinal outputs. Continuous enhancements across software and workflow elements reinforce differentiation beyond hardware specifications.
The industry research and growth report includes detailed analyses of the competitive landscape of the market and information about key companies, including:
- Carl Zeiss Meditec / ZEISS International
- HAAG-STREIT GROUP
- Medmont
- OPTOPOL Technology Sp. z o.o.
- NIDEK Co., Ltd.
- OCULUS Optikgeräte GmbH / OCULUS, Inc.
- Kowa American Corporation
- Metrovision SA
- Heidelberg Engineering GmbH
- Canon Inc.
- Konan Medical, Inc.
- Topcon Corporation
Qualitative and quantitative analysis of companies has been conducted to help clients understand the wider business environment as well as the strengths and weaknesses of key industry players. Data is qualitatively analyzed to categorize companies as pure play, category-focused, industry-focused, and diversified; it is quantitatively analyzed to categorize companies as dominant, leading, strong, tentative, and weak.
Recent Developments
- In October 2025, NIDEK Inc. announced U.S. distribution of the Medmont Meridia Vantage, describing the arrangement as a partnership that brings Medmont’s imaging technology together with NIDEK’s established sales and service infrastructure. For the automated ophthalmic perimeters market, this matters because it reinforces NIDEK’s position as a broader ophthalmic diagnostics supplier to eye-care practices.
- In August 2024, OCULUS launched Frequency Doubling Perimetry as a new capability within its Easyfield VR Virtual Reality Visual Field Analyzer & Screener. This update is directly relevant to the automated ophthalmic perimeters market because the source says FDP can help detect glaucomatous damage and other optic nerve diseases earlier than standard automated perimetry
Report Scope
| Report Attribute | Details |
| Market size value in 2025 | USD 301.75 million |
| Revenue forecast in 2032 | USD 410.63 million |
| Growth rate (CAGR) | 4.5% (2025–2032) |
| Base year | 2025 |
| Forecast period | 2026–2032 |
| Quantitative units | USD million |
| Segments covered | By Product Outlook: Static perimeters, Kinetic perimeters, Combination systems; By End User Outlook: Hospitals, Ophthalmic clinics, Others; By Application Outlook: Glaucoma detection and monitoring, Neurological disorder assessment, Retinal disease diagnosis, Comprehensive eye examinations, Pediatric screening, Neuro-ophthalmology assessment |
| Regional scope | North America, Europe, Asia Pacific, Latin America, Middle East & Africa |
| Key companies profiled | Carl Zeiss Meditec / ZEISS International; HAAG-STREIT GROUP; Medmont; OPTOPOL Technology Sp. z o.o.; NIDEK Co., Ltd.; OCULUS Optikgeräte GmbH / OCULUS, Inc.; Kowa American Corporation; Metrovision SA; Heidelberg Engineering GmbH; Canon Inc.; Konan Medical, Inc.; Topcon Corporation |
| No. of Pages | 320 |
By Segmentation
By Product
- Static perimeters
- Kinetic perimeters
- Combination systems
By End User
- Hospitals
- Ophthalmic clinics
- Others
By Application
- Glaucoma detection and monitoring
- Neurological disorder assessment
- Retinal disease diagnosis
- Comprehensive eye examinations
- Pediatric screening
- Neuro-ophthalmology assessment
By Region
- North America
- U.S.
- Canada
- Mexico
- Europe
- Germany
- France
- U.K.
- Italy
- Spain
- Rest of Europe
- Asia Pacific
- China
- Japan
- India
- South Korea
- South-east Asia
- Rest of Asia Pacific
- Latin America
- Brazil
- Argentina
- Rest of Latin America
- Middle East & Africa
- GCC Countries
- South Africa
- Rest of the Middle East and Africa
Request a Free Sample
Fill in your details and we'll send you a free sample report.
- Sample data tables & charts
- Research methodology
Need a Custom Version of This Report?
Tailor the scope, geography, or segments to your exact requirements.
- Custom geography or segment scope
- Direct access to our analyst team
Frequently Asked Questions
What is the market size of the Automated Ophthalmic Perimeters Market in 2025?
What is the forecasted market size by 2032?
What is the growth rate of the market during 2025–2032?
Which product segment leads the market?
Which application drives the highest demand?
Who are the key companies operating in this market?
Table of Content
Chapter 1. Report Introduction
- 1.1 Report Description & Purpose
- 1.1.1 Report Title & Market Definition
- 1.1.2 Unique Selling Propositions (USP) & Key Differentiators
- 1.1.3 Value Proposition for Stakeholders
- 1.2 Research Objectives
- 1.2.1 Market Sizing Objectives (Volume & Revenue)
- 1.2.2 Segmentation Objectives
- 1.2.3 Competitive Intelligence Objectives
- 1.2.4 Forecast & Scenario Objectives
- 1.3 Report Scope
- 1.3.1 Automated Ophthalmic Perimeters Scope – Types & Subtypes Covered
- 1.3.2 Geographic Scope – Regions & Countries Covered
- 1.3.3 Historical Period, Base Year & Forecast Period (2025; forecast to 2032)
- 1.3.4 Inclusions & Exclusions
- 1.4 HS Code & Classification Framework
- 1.5 Currency, Units & Pricing Basis
- 1.6 Target Stakeholders
- 1.7 Limitations & Assumptions
Chapter 2. Executive Summary
- 2.1 Global Automated Ophthalmic Perimeters Market Snapshot
- 2.1.1 Market Size – Historical (2025) & Forecast (2025-2032) (2025: USD 301.75 million → 2032: USD 410.63 million)
- 2.1.2 Volume & Revenue – Global Totals
- 2.1.3 Key Market Highlights – Top Five Facts
- 2.2 Automated Ophthalmic Perimeters Market Segmentation Snapshot
- 2.2.1 Market Split by Region – 2025 vs. 2032
- 2.3 Competitive Snapshot
- 2.3.1 Top 10 Players by Revenue Share – 2025
- 2.3.2 Top 10 Players by Volume Share – 2025
- 2.3.3 Recent Strategic Developments (18-Month Summary)
- 2.4 Key Investment Highlights & Strategic Conclusions
Chapter 3. Automated Ophthalmic Perimeters Market Dynamics & Industry Analysis
- 3.1 Market Overview & Context
- 3.1.1 Automated Ophthalmic Perimeters Market Position in the Broader Automotive Value Chain
- 3.1.2 OEM vs. Replacement Market Dynamics
- 3.1.3 Market Maturity & Development Stage by Region
- 3.2 Automated Ophthalmic Perimeters Market Drivers
- 3.3 Automated Ophthalmic Perimeters Market Restraints & Challenges
- 3.4 Automated Ophthalmic Perimeters Market Opportunities
- 3.5 Porter's Five Forces Analysis
- 3.5.1 Threat of New Entrants
- 3.5.2 Bargaining Power of Suppliers
- 3.5.3 Bargaining Power of Buyers
- 3.5.4 Threat of Substitutes
- 3.5.5 Competitive Rivalry – Intensity Assessment
- 3.6 Automated Ophthalmic Perimeters Value Chain Analysis
- 3.6.1 Upstream – Raw Material/Input Suppliers
- 3.6.1.1 Raw Material/Input 1
- 3.6.1.2 Raw Material/Input 2
- 3.6.1.3 Raw Material/Input 3
- 3.6.2 Midstream – Production/Manufacturing/Service Delivery
- 3.6.2.1 Production/Process Overview
- 3.6.2.2 Key Facility Locations & Capacity by Manufacturer
- 3.6.3 Downstream – Distribution & End Consumer
- 3.6.3.1 Primary Channel – B2B/OEM
- 3.6.3.2 Secondary Channels – Dealer, Retail, Online, Direct
- 3.6.4 Value Chain Profitability Analysis
- 3.6.1 Upstream – Raw Material/Input Suppliers
- 3.7 PESTEL Analysis
- 3.7.1 Political Factors
- 3.7.2 Economic Factors
- 3.7.3 Social Factors
- 3.7.4 Technological Factors
- 3.7.5 Environmental Factors
- 3.7.6 Legal Factors
- 3.8 Automated Ophthalmic Perimeters Supply Chain Analysis
- 3.8.1 Raw Material/Input Supply Risk Assessment
- 3.8.2 Manufacturing Concentration Risk (Geographic Exposure)
- 3.8.3 Trade Disruption Impact Analysis
- 3.9 Regulatory & Policy Landscape
Note: The regulatory and policy landscape section covers regulations based on their applicability to the market, Automated Ophthalmic Perimeters category, geography, and scope of the study. Only regulatory frameworks with a material impact on operations, compliance, trade, sustainability, or market access are analyzed in detail.
Chapter 4. Key Investment Pockets & Opportunity Analysis
- 4.1 Automated Ophthalmic Perimeters Market Attractiveness Analysis
- 4.1.1 By Region – Investment Attractiveness Matrix (Volume × CAGR)
- 4.2 Absolute Revenue Growth Opportunity
- 4.2.1 By Region – Absolute USD Growth Through 2032
- 4.3 Incremental Volume Opportunity
- 4.3.1 By Region – Incremental Volume Through 2032
- 4.3.2 Segment – Incremental Volume
- 4.4 Emerging Submarket Opportunity Deep Dive (Subject to Applicability)
- 4.5 Emerging Market Opportunity Scorecards
- 4.5.1 United States
- 4.5.2 Europe
- 4.5.3 Asia
- 4.5.4 Middle East & Africa
Note: Emerging Market Opportunity Scorecards will be included based on relevance and strategic importance. Regions listed are indicative and may vary depending on data availability and market dynamics.
Chapter 5. Automated Ophthalmic Perimeters Import-Export Analysis & Trade Flows
- 5.1 Global Trade Overview
- 5.1.1 Global Export Value by Country (2025)
- 5.1.2 Global Export Volume by Country (2025)
- 5.1.3 Global Import Value by Country (2025)
- 5.1.4 Global Import Volume by Country (2025)
- 5.1.5 Net Trade Balance by Country (2025)
- 5.2 Export Analysis – Segment
- 5.2.1 Type 1 (HS Code)
- 5.2.2 Type 2 (HS Code)
- 5.2.3 Type 3 (HS Code)
- 5.2.4 Type 4 (HS Code)
- 5.2.5 Type 5 (HS Code)
- 5.3 Import Analysis – Segment
- 5.3.1 Type 1 (HS Code)
- 5.3.2 Type 2 (HS Code)
- 5.3.3 Type 3 (HS Code)
- 5.3.4 Type 4 (HS Code)
- 5.3.5 Type 5 (HS Code)
- 5.4 Average Unit Trade Prices
- 5.4.1 Average Export Price – Segment & Country
- 5.4.2 Average Import Price – Segment & Source Country
- 5.4.3 Price Trends (2025)
- 5.5 Key Trade Route Analysis
- 5.5.1 Trade Route 1
- 5.5.2 Trade Route 2
- 5.5.3 Trade Route 3
- 5.5.4 Trade Route 4
- 5.5.5 Trade Route 5
- 5.6 Trade Policy Impact Assessment
- 5.6.1 US Anti-Dumping & Section 301 Tariffs
- 5.6.2 EU Customs Union Impact
- 5.6.3 Major Free Trade Agreements
- 5.6.4 USMCA Rules of Origin
Note: Trade policy analysis will be included only where relevant to the Automated Ophthalmic Perimeters market.
Chapter 6. Competitive Landscape & Company Benchmarking
- 6.1 Automated Ophthalmic Perimeters Market Concentration & Structure
- 6.1.1 Herfindahl-Hirschman Index (HHI) – vs. 2025
- 6.1.2 Tier 1, Tier 2 & Tier 3 Market Structure
- 6.1.3 Global, Regional & Local Player Dynamics
- 6.2 Automated Ophthalmic Perimeters Market Share Analysis – 2025
- 6.2.1 Global Revenue Share by Company
- 6.2.2 Global Volume Share by Company
- 6.2.3 Regional Revenue Share
- 6.2.4 Market Share Evolution ( vs. 2025)
- 6.2.5 OEM Segment Share by Company
- 6.2.6 Replacement Segment Share by Company
- 6.3 Production/Delivery Capacity & Facility Analysis
- 6.3.1 Global Installed Capacity
- 6.3.2 Capacity Utilization Rates
- 6.3.3 Production/Output Volume
- 6.3.4 Facility Locations & Capacity Map
- 6.3.5 Planned Capacity Additions
- 6.4 Automated Ophthalmic Perimeters Competitive Benchmarking Matrix
- 6.4.1 Revenue, Volume, CAGR & Profitability Comparison
- 6.4.2 Channel Revenue Mix
- 6.4.3 Geographic Revenue Exposure
- 6.4.4 R&D Intensity
- 6.4.5 Sustainability Maturity
- 6.5 Strategic Developments in Automated Ophthalmic Perimeters (Last 24 Months)
- 6.5.1 Mergers, Acquisitions & Divestments
- 6.5.2 New Automated Ophthalmic Perimeters Launches
- 6.5.3 Facility Expansions
- 6.5.4 Strategic Alliances, Joint Ventures & Partnerships
- 6.5.5 Distribution Expansion & Market Entry
- 6.5.6 Sustainability & ESG Initiatives
- 6.6 Competitive Strategy Mapping
- 6.6.1 Leader, Challenger, Follower & Niche Classification
- 6.6.2 Pricing Strategy Comparison
- 6.6.3 Channel Strategy Matrix
Note: Strategic developments are included based on their materiality and the availability of reliable information.
Chapter 7. Global Automated Ophthalmic Perimeters Market – By Distribution Channel
- 7.1 Segment Overview
- 7.1.1 Volume & Revenue Split by Channel (2025 & 2032)
- 7.1.2 Channel Mix Evolution (2025-2032)
Chapter 8. Regional Market Analysis – Global Overview
- 8.1 Global Regional Overview
- 8.1.1 Regional Volume Share
- 8.1.2 Regional Revenue Share
- 8.1.3 Regional Volume by Region
- 8.1.4 Regional Revenue by Region
- 8.1.5 Regional Forecast Through 2032
- 8.2 Cross-Regional Segment Analysis
- 8.2.1 By Distribution Channel
- 8.2.2 By Brand/Price Tier
Chapter 9. North America Automated Ophthalmic Perimeters Market
- 9.1 United States
- 9.2 Canada
- 9.3 Mexico
Chapter 10. Europe Automated Ophthalmic Perimeters Market
- 10.1 Germany
- 10.2 France
- 10.3 Italy
- 10.4 United Kingdom
- 10.5 Spain
- 10.6 Poland
- 10.7 Russia
- 10.8 Netherlands
- 10.9 Belgium
- 10.10 Sweden
- 10.11 Denmark
- 10.12 Norway
- 10.13 Rest of Europe
Chapter 11. Asia Pacific Automated Ophthalmic Perimeters Market
- 11.1 China
- 11.2 India
- 11.3 Japan
- 11.4 South Korea
- 11.5 Thailand
- 11.6 Indonesia
- 11.7 Vietnam
- 11.8 Malaysia
- 11.9 Australia
- 11.10 Rest of Asia Pacific
Chapter 12. Latin America Automated Ophthalmic Perimeters Market
- 12.1 Brazil
- 12.2 Argentina
- 12.3 Colombia
- 12.4 Chile
- 12.5 Rest of Latin America
Chapter 13. Middle East Automated Ophthalmic Perimeters Market
- 13.1 Saudi Arabia
- 13.2 United Arab Emirates
- 13.3 Turkey
- 13.4 Israel
- 13.5 Iran
- 13.6 Rest of the Middle East
Chapter 14. Africa Automated Ophthalmic Perimeters Market
- 14.1 South Africa
- 14.2 Egypt
- 14.3 Nigeria
- 14.4 Morocco
- 14.5 Rest of Africa
Chapter 15. Automated Ophthalmic Perimeters Company Profiles
- 15.1 [Company 01]
- 15.1.1 Company Overview
- 15.1.2 Key Management Personnel
- 15.1.3 Products & Services Portfolio
- 15.1.4 Financial Performance
- 15.1.5 Key Market Focus & Geographic Presence
- 15.1.6 Recent Developments & Strategic Initiatives
Note: The company profile list is preliminary and may change based on research findings, market developments, data availability, and client requirements.
Chapter 16. Appendices
- Appendix A – List of Abbreviations & Acronyms
- Appendix B – Industry Classification Code Reference – Full Series
- Appendix C – Production & Capacity Data Tables
- Appendix D – End-Use & Demand Base Tables
- Appendix E – Consumption & Replacement Rate Assumptions
- Appendix F – ASP Reference Tables
- Appendix G – Manufacturing & Facility Database
- Appendix H – Import-Export Data Tables
- Appendix I – Regulatory Summary Tables
- Appendix J – Primary Research Participant List (Anonymized)
- Appendix K – Primary Research Questionnaire Framework
- Appendix L – Data Sources & Bibliography
- Appendix M – Market Size Divergence & Source Comparison
Chapter 17. Research Methodology
- 17.1 Research Framework & Philosophy
- 17.2 Secondary Research – Sources, Hierarchy & Data Extraction
- 17.3 Data Modeling – Bottom-Up & Top-Down Market Sizing
- 17.4 Primary Research – Stakeholder Framework, LOI & Sample Sizes
- 17.5 Forecast Methodology – Regression, Scenario & Sensitivity Analysis
- 17.6 Quality Control – Four-Layer Validation Framework
- 17.7 Limitations & Standard Assumptions
- 17.8 Disclaimer
