
Axial Spondyloarthritis Market
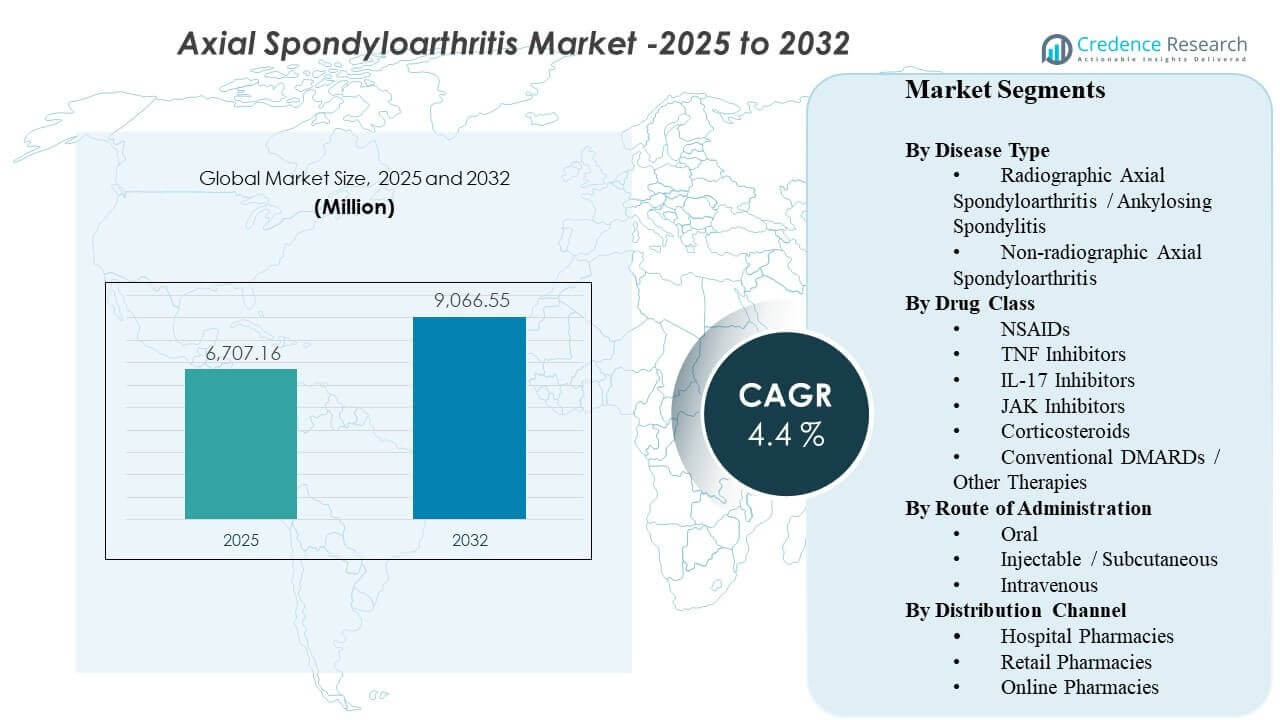
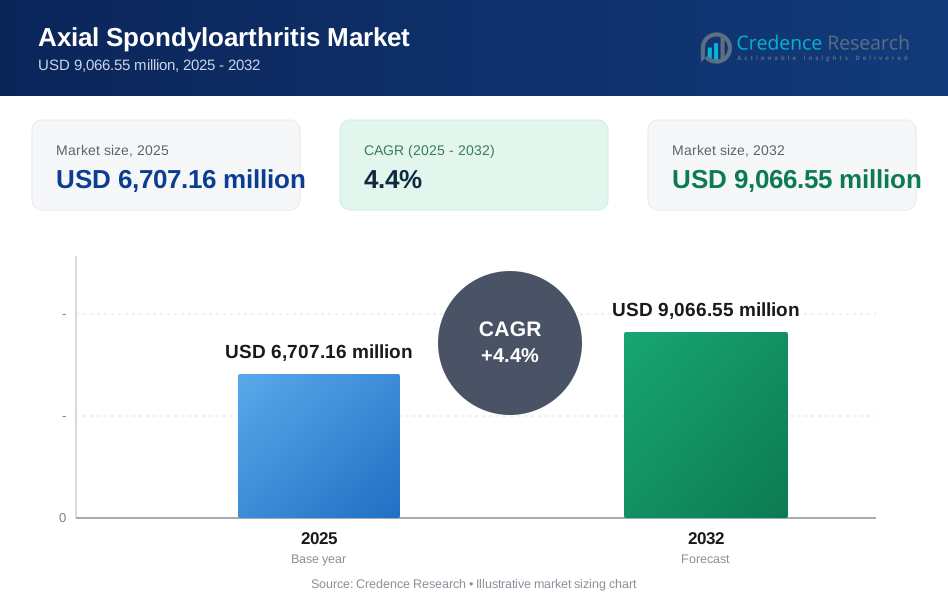
The global Axial Spondyloarthritis Market size was estimated at USD 6,707.16 million in 2025 and is expected to reach USD 9,066.55 million by 2032, growing at a CAGR of 4.4% from 2025 to 2032. Demand expansion is being driven primarily by earlier and more confident diagnosis of inflammatory back pain combined with wider use of targeted therapies that improve disease control versus symptom-only management. Over the forecast period, broader access pathways for advanced therapies and strengthening specialist care capacity in developed markets are expected to keep treatment rates rising in both radiographic and non-radiographic disease.
| REPORT ATTRIBUTE | DETAILS |
|---|---|
| Historical Period | 2020-2024 |
| Base Year | 2025 |
| Forecast Period | 2026-2032 |
| Axial Spondyloarthritis Market Size 2025 | USD 6,707.16 million |
| Axial Spondyloarthritis Market , CAGR | 4.4% |
| Axial Spondyloarthritis Market Size 2032 | USD 9,066.55million |
Key Market Trends & Insights
- The market is projected to expand from USD 6,707.16 million to USD 9,066.55 million at a 4.4% CAGR (2025–2032).
- Radiographic axial spondyloarthritis / ankylosing spondylitis remains the leading disease type with 65.7% share.
- Conventional DMARDs / other therapies account for the largest drug-class share at 48.3%.
- Injectable / subcutaneous therapies lead by route with 46.4% share, supported by established biologic usage.
- North America represents the largest regional revenue share at 35.62%, reflecting higher diagnosis and biologic access intensity.
Segment Analysis
Clinical practice is shifting toward earlier identification of axial spondyloarthritis, which expands the treated population beyond patients with long-standing radiographic damage. Shorter diagnostic pathways supported by imaging and clearer classification criteria increase initiation rates of disease-modifying treatment, particularly for patients who previously cycled through symptomatic care. This shift increases demand for biologics and targeted synthetics, and it also improves persistence when patients experience measurable symptom control and functional improvement.
Therapy choice is increasingly influenced by convenience and payer rules. Subcutaneous biologics remain central due to entrenched clinician experience and patient-support programs, but oral options are gaining attention for patients prioritizing ease of administration and fewer clinic visits. At the same time, biosimilar-driven price competition and step-therapy policies are shaping sequencing across TNF, IL-17, and newer targeted options, reinforcing the need for differentiated efficacy, tolerability, and long-term response durability.
By Disease Type Insights
Radiographic Axial Spondyloarthritis / Ankylosing Spondylitis accounted for the largest share of 65.7% in 2025. It leads because radiographic disease has clearer diagnostic confirmation and more established treatment pathways, which accelerates therapy initiation. Clinicians also have deeper experience managing ankylosing spondylitis with biologics, supporting confident escalation after NSAID failure. Over time, earlier referral patterns and better imaging access continue to lift treatment intensity, sustaining the segment’s revenue contribution.
By Drug Class Insights
Conventional DMARDs / Other Therapies accounted for the largest share of 48.3% in 2025. This category benefits from its role in foundational management alongside NSAIDs and its relevance in broader inflammatory disease pathways where overlap conditions are treated. Treatment algorithms also drive consistent utilization of non-biologic options before and alongside advanced therapies in many markets. Pricing accessibility, familiarity, and formulary positioning reinforce volume, even as targeted agents gain share in higher-severity or refractory patients.
By Route of Administration Insights
Injectable / Subcutaneous accounted for the largest share of 46.4% in 2025. The route is anchored by long-established biologic delivery models, which are supported by home-administration training, patient-support services, and predictable adherence routines. Self-injectables also reduce infusion-center dependency and can lower non-drug administration burden. As more patients start biologics earlier in the disease journey, subcutaneous use remains a core modality for ongoing maintenance therapy.
By Distribution Channel Insights
Hospital Pharmacies accounted for the largest share of 42.2% in 2025. Initiation and early monitoring are commonly tied to specialist-led hospital systems, where treatment decisions, diagnostics, and therapy onboarding occur in a coordinated workflow. Hospital pharmacies also manage cold-chain handling and prior-authorization processes for specialty therapies, which supports consistent dispensing. Even as specialty distribution and home delivery expand, hospitals remain a primary access point for starts, switches, and complex cases.
Axial Spondyloarthritis Market Drivers
Earlier diagnosis and expanding treated prevalence
Earlier identification of inflammatory back pain is increasing the number of patients who enter the treatment pathway before irreversible structural damage occurs. Wider use of imaging and improved clinical classification reduces diagnostic uncertainty, which supports faster referral to rheumatology care. As a result, more patients initiate disease-modifying therapy rather than relying solely on episodic symptom control. This expands treated prevalence across both radiographic and non-radiographic populations and increases long-term therapy duration per patient.
- For instance, Siemens Healthineers states that its Deep Resolve MRI technology can shorten brain MRI scan times by up to 70%, and the company has also highlighted a 3T knee MRI workflow reduced from about 10 minutes to under 2 minutes while maintaining diagnostic value, underscoring how faster high-quality imaging can help reduce diagnostic bottlenecks in inflammatory disease pathways.
Therapeutic innovation and broader mechanism choice
Newer targeted options and expanding biologic mechanisms are improving disease control in patients with inadequate response to first-line therapies. Clinicians now have greater ability to switch across mechanisms to manage persistent inflammation, which increases the likelihood of maintaining patients on active therapy. The growing range of options also supports treatment personalization based on comorbidities, tolerability, and patient preferences. This increases overall market value by sustaining demand across multiple therapy lines and supporting longer persistence on advanced agents.
- For instance, UCB reported in its Phase III BE MOBILE program that BIMZELX achieved ASAS40 at week 16 in 47.7% of non-radiographic axSpA patients (61/128) and 44.8% of radiographic axSpA patients (99/221), versus 21.4% (27/126) and 22.5% (25/111) with placebo, demonstrating how a newer IL-17A/IL-17F mechanism can broaden switching options beyond first-line therapy.
Payer coverage evolution and biosimilar-driven access expansion
Formulary decisions and step-therapy rules strongly influence treatment sequencing, but they also expand access as payers seek cost-efficient pathways. Biosimilars can reduce affordability barriers and increase uptake of biologic therapy among broader patient cohorts. Lower net pricing can encourage earlier initiation in appropriate patients and reduce discontinuation linked to cost burden. As coverage policies stabilize and competition increases, more patients are likely to enter biologic pathways, sustaining market expansion.
Convenience, adherence support, and shifting care delivery models
Patient preference for convenient therapy options is influencing route selection and persistence, especially for chronic inflammatory conditions requiring long-term management. Subcutaneous therapies supported by robust patient-assistance programs reduce friction in onboarding and refill continuity. At the same time, oral options appeal to patients who want fewer injections and less clinic dependency. Improvements in specialty pharmacy services, home delivery, and adherence tracking support continuity of care, which translates into sustained therapy revenues.
Axial Spondyloarthritis Market Challenges
Pricing pressure and reimbursement complexity remain persistent barriers, especially as more therapies compete in the same treatment lines. Payers often impose prior authorization, step edits, and switching requirements that can delay initiation and increase administrative burden for providers. These constraints can reduce speed to treatment optimization and may contribute to non-persistence if access interruptions occur. Cost containment also intensifies competition and can compress margins, particularly in markets with rapid biosimilar diffusion.
Clinical heterogeneity and diagnostic variability continue to limit consistent treatment pathways across regions and care settings. Patients can present with overlapping symptoms, delayed referrals, and uneven access to imaging, which can slow confirmation of disease and reduce timely escalation. Safety monitoring requirements for certain targeted therapies can also influence prescriber comfort and sequencing decisions. Together, these factors can create uneven uptake across segments and slow the pace of therapy intensification in under-resourced systems.
- For instance, GE HealthCare’s deep-learning AIR Recon DL reduced average MRI scan time by 40% to 50% across anatomies at Maçka EMAR and by about 50% for musculoskeletal imaging at Precision Imaging Center, illustrating how advanced imaging platforms can improve diagnostic throughput, even though uneven technology access still leaves pathway consistency fragmented across providers.
Axial Spondyloarthritis Market Trends and Opportunities
Oral targeted therapies are gaining attention as care systems emphasize convenience and long-term adherence. For some patients, oral regimens may reduce injection fatigue and improve continuation when disease control is achieved. This trend creates opportunity for differentiated positioning based on safety monitoring, tolerability, and real-world durability. As treatment algorithms mature, market growth can be supported by better segmentation of patients by response profile and comorbidity burden.
Digital health and specialty distribution models are becoming more important in chronic inflammatory disease management. Tele-rheumatology, home delivery, and structured adherence programs can reduce access friction and support continuity of therapy, particularly for biologics that require cold-chain handling and refill coordination. These models also help manage switching events driven by payer policies and improve patient education on administration. Over time, service-enabled distribution can become a key competitive lever alongside clinical differentiation.
- For instance, Evernorth’s Accredo Specialty Pharmacy supports rheumatoid arthritis and inflammatory conditions through digital tools such as refill-by-text, order tracking, and cold-chain delivery; across its specialty platform it reported 3.1 million clinical and compliance interactions in the last year, while its RA and inflammatory Therapeutic Resource Center model was associated with 12% fewer emergency room visits and 22% fewer inpatient admissions.
Regional Insights
North America (35.62% share, 2025)
North America leads revenue due to stronger diagnosis intensity, specialist availability, and established reimbursement pathways for advanced therapies. Higher treated prevalence and earlier escalation to disease-modifying regimens increase average revenue per patient. The region also benefits from mature specialty pharmacy infrastructure and patient-support programs that improve persistence. Competitive dynamics are shaped by payer-driven formulary management, which increases switching and heightens price competition across therapy classes.
Europe (28.14% share, 2025)
Europe holds a significant share supported by structured healthcare systems, concentrated rheumatology services, and broad availability of biologics in key markets. Many countries have well-defined treatment pathways, enabling consistent initiation and escalation after first-line failure. Pricing negotiations and biosimilar adoption pressure branded therapy value, but they also expand biologic access. Growth is reinforced by earlier diagnosis and steady penetration of newer mechanisms where reimbursement is secured.
Asia Pacific (24.11% share, 2025)
Asia Pacific growth is supported by large patient pools and improving diagnostic access, but revenue share reflects uneven reimbursement and affordability across countries. Expansion of tertiary care capacity and rising specialist availability in major urban centers improves treatment rates. As coverage frameworks evolve, biologic and targeted therapy uptake is expected to deepen, particularly in higher-income markets. Competitive opportunities are strongest in access expansion, patient support, and localized pricing strategies that broaden therapy eligibility.
Latin America (7.58% share, 2025)
Latin America remains smaller in value share due to affordability constraints and uneven availability of advanced therapies across public and private systems. Diagnosis and referral pathways can be inconsistent outside major metropolitan centers, delaying therapy initiation. Where reimbursement expands, biosimilars can drive increased biologic penetration. Growth is supported by improving healthcare access, but market development remains sensitive to currency dynamics and payer budgets.
Middle East & Africa (4.55% share, 2025)
Middle East & Africa represents the smallest share, shaped by uneven specialist density, variable imaging access, and heterogeneous reimbursement coverage. High-cost therapies tend to concentrate in private systems or higher-income markets where coverage frameworks are stronger. Public-sector constraints can limit uptake despite clinical need, creating variability between countries. Market expansion depends on strengthening rheumatology care pathways, widening reimbursement for specialty medicines, and improving diagnostic access in secondary cities.
Competitive Landscape
Competition is defined by portfolio breadth, mechanism differentiation, and the ability to secure favorable formulary positioning in an environment of rising price pressure. Companies compete on efficacy, safety monitoring requirements, dosing convenience, and long-term durability narratives that support switching and persistence. Lifecycle management, real-world evidence, and patient-support services are increasingly used to defend share, especially as biosimilars intensify price competition. Partnerships and label expansion strategies remain important as treatment sequencing evolves across radiographic and non-radiographic populations.
AbbVie Inc. competes through a combination of immunology portfolio depth and therapy sequencing relevance, supported by ongoing clinical evidence generation and access-focused contracting. The company’s approach typically emphasizes sustained disease control, differentiated patient selection, and strong specialty distribution capabilities. Competitive performance depends on aligning clinical positioning with payer policies that can mandate step therapy or switches. Continued investment in evidence, education, and patient support helps protect persistence and maintain utilization in long-term chronic disease management.
The industry research and growth report includes detailed analyses of the competitive landscape of the market and information about key companies, including:
- AbbVie Inc.
- Novartis AG
- UCB S.A.
- Eli Lilly and Company
- Pfizer Inc.
- Johnson & Johnson
- Janssen Biotech
- Amgen Inc.
- Kyowa Kirin Co., Ltd.
- Bristol Myers Squibb / Celgene Corporation
Qualitative and quantitative analysis of companies has been conducted to help clients understand the wider business environment as well as the strengths and weaknesses of key industry players. Data is qualitatively analyzed to categorize companies as pure play, category-focused, industry-focused, and diversified; it is quantitatively analyzed to categorize companies as dominant, leading, strong, tentative, and weak.
Recent Developments
- In June 2025, UCB announced that BIMZELX (bimekizumab-bkzx) showed three-year data at EULAR 2025 with lasting efficacy and control of inflammation in axial spondyloarthritis, strengthening its profile in the axSpA treatment landscape. The company said ASAS40 responses at three years were sustained in both non-radiographic axial spondyloarthritis and ankylosing spondylitis patients.
- In March 2024, AbbVie completed its USD 137.5 million acquisition of Landos Biopharma, adding the oral NLRX1 agonist NX-13 to its immunology pipeline. Industry coverage of the axial spondyloarthritis market highlighted this deal as a relevant competitive development in the broader inflammatory disease arena.
- In January 2025, MoonLake Immunotherapeutics announced that patient screening had started for three new sonelokimab trials, including a study in axial spondyloarthritis. The company said this expanded its clinical program into axSpA alongside existing studies in hidradenitis suppurativa and active psoriatic arthritis.
Report Scope
| Report Attribute | Details |
| Market size value in 2025 | USD 6707.16 million |
| Revenue forecast in 2032 | USD 9066.55 million |
| Growth rate (CAGR) | 4.4% (2025–2032) |
| Base year | 2025 |
| Forecast period | 2026-2032 |
| Quantitative units | USD million |
| Segments covered | By Disease Type; By Drug Class; By Route of Administration; By Distribution Channel |
| Regional scope | North America, Europe, Asia Pacific, Latin America, Middle East & Africa |
| Key companies profiled | AbbVie Inc., Novartis AG, UCB S.A., Eli Lilly and Company, Pfizer Inc., Johnson & Johnson, Janssen Biotech, Amgen Inc., Kyowa Kirin Co., Ltd., Bristol Myers Squibb / Celgene Corporation |
| No.of Pages | 326 |
Segmentation
By Disease Type
- Radiographic Axial Spondyloarthritis / Ankylosing Spondylitis
- Non-radiographic Axial Spondyloarthritis
By Drug Class
- NSAIDs
- TNF Inhibitors
- IL-17 Inhibitors
- JAK Inhibitors
- Corticosteroids
- Conventional DMARDs / Other Therapies
By Route of Administration
- Oral
- Injectable / Subcutaneous
- Intravenous
By Distribution Channel
- Hospital Pharmacies
- Retail Pharmacies
- Online Pharmacies
By Region
- North America
- U.S.
- Canada
- Mexico
- Europe
- Germany
- France
- U.K.
- Italy
- Spain
- Rest of Europe
- Asia Pacific
- China
- Japan
- India
- South Korea
- South-east Asia
- Rest of Asia Pacific
- Latin America
- Brazil
- Argentina
- Rest of Latin America
- Middle East & Africa
- GCC Countries
- South Africa
- Rest of the Middle East and Africa
Request a Free Sample
Fill in your details and we'll send you a free sample report.
- Sample data tables & charts
- Research methodology
Market Dynamics
Earlier diagnosis and expanding treated prevalence
Advances in imaging and clearer clinical classification are enabling earlier identification of inflammatory back pain, allowing more patients to enter the treatment pathway before irreversible damage occurs. This increases the number of patients eligible for disease-modifying therapies and extends therapy duration.
Therapeutic innovation and broader mechanism choice
The introduction of new targeted therapies and biologics with diverse mechanisms of action is improving disease control for patients who do not respond to first-line treatments. This expands treatment options, supports personalized care, and sustains demand across multiple therapy lines.
Payer coverage evolution and biosimilar-driven access expansion
Wider adoption of biosimilars and evolving payer policies are reducing affordability barriers and increasing access to advanced therapies. This encourages earlier initiation of biologics and supports market growth by expanding the treated patient base.
Convenience, adherence support, and shifting care delivery models
Patient preference for convenient administration routes, such as subcutaneous injections and oral therapies, is driving therapy selection and persistence. Enhanced specialty pharmacy services, home delivery, and digital adherence programs further support long-term therapy continuity and market expansion.
Need a Custom Version of This Report?
Tailor the scope, geography, or segments to your exact requirements.
- Custom geography or segment scope
- Direct access to our analyst team
Frequently Asked Questions
What is the market size of the Axial Spondyloarthritis Market in 2025 and what is the forecast for 2032?
What is the CAGR of the Axial Spondyloarthritis Market during 2025–2032?
Which is the largest segment in the Axial Spondyloarthritis Market?
What factors are driving growth in the Axial Spondyloarthritis Market?
Who are the leading companies in the Axial Spondyloarthritis Market?
Which region leads the Axial Spondyloarthritis Market in 2025?
Table of Content
Chapter 1 Market Segmentation
- 1.1 Segmentation Framework
- 1.1.1 Product and Service Classification
- 1.1.2 Application and End-Use Classification
- 1.1.3 Technology and Solution Classification
- 1.1.4 Customer and Distribution Channel Classification
- 1.1.5 Geographic Segmentation
- 1.1.6 Market Segment Definitions and Boundaries
- 1.2 By Drug Class
- 1.2.1 NSAIDs
- 1.2.2 TNF Inhibitors
- 1.2.3 IL-17 Inhibitors
- 1.2.4 JAK Inhibitors
- 1.2.5 Corticosteroids
- 1.2.6 Conventional DMARDs / Other Therapies
- 1.3 By Disease Type
- 1.3.1 Radiographic Axial Spondyloarthritis / Ankylosing Spondylitis
- 1.3.2 Non-radiographic Axial Spondyloarthritis
- 1.4 By Route of Administration
- 1.4.1 Oral
- 1.4.2 Injectable / Subcutaneous
- 1.4.3 Intravenous
Chapter 2 Introduction
- 2.1 Report Objectives and Scope
- 2.2 Product Definition and Industry Terminology
- 2.3 Market Inclusions and Exclusions
- 2.4 Research Process
- 2.4.1 Primary Research and Expert Interviews
- 2.4.2 Secondary Research and Source Review
- 2.4.3 Top-Down and Bottom-Up Estimation
- 2.4.4 Data Triangulation and Verification
- 2.5 Market Size Measurement Basis
- 2.5.1 2025: USD 6,707.16 million → 2032: USD 9,066.55 million
- 2.6 Historical and Forecast Reference Periods
- 2.6.1 Base Year: 2025
- 2.6.2 Forecast Period: 2025-2032
- 2.7 Research Assumptions and Limitations
Chapter 3 Executive Summary
- 3.1 Market Snapshot and Key Findings
- 3.2 Base-Year Market Size, 2025
- 3.3 Forecast Market Size, 2032
- 3.4 Revenue and Volume Growth Outlook
- 3.5 Key Demand and Supply Indicators
- 3.6 Leading Market Segments
- 3.7 Fastest-Growing Market Opportunities
- 3.8 Regional Performance Highlights
- 3.9 Technology and Industry Transformation
- 3.10 Competitive Landscape Summary
- 3.11 Analyst View and Strategic Implications
Chapter 4 Global Axial Spondyloarthritis Market Trends and Developments
- 4.1 Historical Industry Development
- 4.2 Recent Market Trends and Developments
- 4.3 Demand and Customer Behavior Trends
- 4.4 Technology and Product Innovation
- 4.5 Artificial Intelligence, Automation and Digitalization
- 4.6 Local Manufacturing and Supply Chain Realignment
- 4.7 Industry Partnerships, Mergers and Acquisitions
- 4.8 Sustainability and Circular Economy Developments
- 4.9 Government and Private Sector Investment Trends
- 4.10 Emerging Business Models and Commercialization
- 4.11 Industry Developments and Announcements
Chapter 5 Global Axial Spondyloarthritis Market Production, Supply and Demand Analysis
- 5.1 Demand Trend and Consumption Analysis
- 5.2 Demand Forecast, 2025-2032
- 5.3 Production and Output Trend
- 5.4 Production and Output Forecast, 2025-2032
- 5.5 Installed Capacity and Capacity Utilization
- 5.6 Company-Wise Production Plants and Statistics
- 5.6.1 Installed Production Capacity
- 5.6.2 Actual Production
- 5.6.3 Planned Capacity and Expansion Targets
- 5.7 Supply Chain Structure and Procurement Trends
- 5.8 Supply-Demand Gap and Bottlenecks
- 5.9 Import Dependence and Sourcing Structure
- 5.10 Contract Manufacturing and Outsourcing
- 5.11 Regional Supply and Demand Concentration
Chapter 6 Global Axial Spondyloarthritis Market Pricing Analysis
- 6.1 Pricing Structure and Measurement
- 6.2 Historical Pricing Trends
- 6.3 Pricing Outlook, 2025-2032
- 6.4 Average Selling Price and Unit Economics
- 6.5 Pricing by Product and Market Segment
- 6.6 Geographic Pricing Differences
- 6.7 Key Input, Energy, Labor and Logistics Costs
- 6.8 Contract Pricing and Purchasing Models
- 6.9 Pricing Sensitivity and Competitive Positioning
- 6.10 Price, Margin and Profitability Implications
Chapter 7 Global Axial Spondyloarthritis Market Dynamics
- 7.1 Market Growth Drivers
- 7.1.1 Demand-Side Drivers
- 7.1.2 Technology and Innovation Drivers
- 7.1.3 Infrastructure and Investment Drivers
- 7.1.4 Regulatory and Policy Drivers
- 7.2 Market Restraints
- 7.2.1 Cost and Affordability Constraints
- 7.2.2 Technology and Adoption Barriers
- 7.2.3 Supply Chain and Operational Constraints
- 7.3 Market Challenges
- 7.3.1 Competitive Pressure and Margin Erosion
- 7.3.2 Skills, Infrastructure and Implementation Gaps
- 7.4 Emerging Market Opportunities
- 7.5 Market Dynamics Impact and Time-Horizon Assessment
Chapter 8 Global Axial Spondyloarthritis Value Chain Analysis
- 8.1 Industry Value Chain Overview
- 8.2 Upstream Suppliers and Critical Inputs
- 8.3 Technology and Component Providers
- 8.4 Manufacturing or Service Delivery
- 8.5 Distribution, Channel Partners and Integrators
- 8.6 Downstream Applications and End Users
- 8.7 Value Addition and Profit Pools
- 8.8 Vertical Integration and Outsourcing
- 8.9 Supplier Concentration and Risk
- 8.10 Supply Chain Localization and Resilience
Chapter 9 Global Axial Spondyloarthritis Market Regulations and Policies
- 9.1 Relevant Laws, Standards and Compliance Frameworks
- 9.2 Product, Service, Safety and Quality Requirements
- 9.3 Government Policies, Incentives and Subsidies
- 9.4 Imports, Exports and Trade Barriers
- 9.5 Public Procurement and Local Content Requirements
- 9.6 Environmental and Sustainability Compliance
- 9.7 Upcoming Policy Changes and Market Implications
Chapter 10 Global Axial Spondyloarthritis Market Hotspots and Opportunities
- 10.1 Market Opportunity Mapping and Growth Hotspots
- 10.2 High-Growth Applications and Customer Groups
- 10.3 Underserved Markets and White-Space Opportunities
- 10.4 Emerging Technology and Product Opportunities
- 10.5 New Capacity and Investment Hotspots
- 10.6 Market Entry and Expansion Opportunities
- 10.7 Distribution and Partnership Opportunities
- 10.8 Near-Term and Long-Term Commercial Potential
- 10.9 Opportunity Attractiveness and Execution Risks
Chapter 11 Global Axial Spondyloarthritis Market Outlook, 2025-2032
- 11.1 Market Size and Analysis
- 11.1.1 Revenue (Market Measurement: 2025: USD 6,707.16 million → 2032: USD 9,066.55 million)
- 11.1.2 Market Volume and Quantity Sold
- 11.1.3 Historical Market Size
- 11.1.4 Base-Year Market Size, 2025
- 11.2 Market Forecast, 2025-2032
- 11.2.1 Revenue Forecast to 2032
- 11.2.2 Volume Forecast to 2032
- 11.2.3 CAGR and Year-on-Year Growth
- 11.2.4 Incremental Revenue Opportunity
- 11.3 Forecast Assumptions and Scenario Analysis
- 11.3.1 Base-Case Forecast
- 11.3.2 Optimistic and Conservative Scenarios
- 11.3.3 Technology, Pricing and Policy Sensitivities
- 11.4 Market Attractiveness and Growth Outlook
Chapter 12 Global Axial Spondyloarthritis Market Segmentation and Outlook
- 12.1 Segmentation Summary and Market Shares, 2025
- 12.2 Largest and Fastest-Growing Segments
- 12.3 By Drug Class - Market Size and Forecast, 2025-2032
- 12.3.1 Segment Definition and Scope
- 12.3.2 Historical Market Size
- 12.3.3 Revenue Forecast, 2025-2032
- 12.3.4 Volume Forecast, 2025-2032
- 12.3.5 Base-Year Market Share, 2025
- 12.3.6 Segment CAGR and Growth Drivers
- 12.3.7 Subsegment Market Size and Forecast
- 12.3.7.1 NSAIDs
- 12.3.7.2 TNF Inhibitors
- 12.3.7.3 IL-17 Inhibitors
- 12.3.7.4 JAK Inhibitors
- 12.3.7.5 Corticosteroids
- 12.3.7.6 Conventional DMARDs / Other Therapies
- 12.3.8 Subsegment Pricing and Adoption Trends
- 12.3.9 Leading Suppliers and Competition
- 12.3.10 Regional Demand and Opportunities
- 12.4 By Disease Type - Market Size and Forecast, 2025-2032
- 12.4.1 Segment Definition and Scope
- 12.4.2 Historical Market Size
- 12.4.3 Revenue Forecast, 2025-2032
- 12.4.4 Volume Forecast, 2025-2032
- 12.4.5 Base-Year Market Share, 2025
- 12.4.6 Segment CAGR and Growth Drivers
- 12.4.7 Subsegment Market Size and Forecast
- 12.4.7.1 Radiographic Axial Spondyloarthritis / Ankylosing Spondylitis
- 12.4.7.2 Non-radiographic Axial Spondyloarthritis
- 12.4.8 Subsegment Pricing and Adoption Trends
- 12.4.9 Leading Suppliers and Competition
- 12.4.10 Regional Demand and Opportunities
- 12.5 By Route of Administration - Market Size and Forecast, 2025-2032
- 12.5.1 Segment Definition and Scope
- 12.5.2 Historical Market Size
- 12.5.3 Revenue Forecast, 2025-2032
- 12.5.4 Volume Forecast, 2025-2032
- 12.5.5 Base-Year Market Share, 2025
- 12.5.6 Segment CAGR and Growth Drivers
- 12.5.7 Subsegment Market Size and Forecast
- 12.5.7.1 Oral
- 12.5.7.2 Injectable / Subcutaneous
- 12.5.7.3 Intravenous
- 12.5.8 Subsegment Pricing and Adoption Trends
- 12.5.9 Leading Suppliers and Competition
- 12.5.10 Regional Demand and Opportunities
- 12.6 Segment Growth Comparison
- 12.7 Segment Attractiveness and Priority Matrix
Chapter 13 Global Axial Spondyloarthritis Geographic Market Outlook, 2025-2032
- 13.1 Regional Market Size and Share, 2025
- 13.2 Regional Market Forecast, 2025-2032
- 13.3 Regional Pricing, Production and Demand Differences
- 13.4 North America
- 13.4.1 United States
- 13.4.2 Canada
- 13.4.3 Mexico
- 13.5 Europe
- 13.5.1 Germany
- 13.5.2 France
- 13.5.3 Italy
- 13.5.4 United Kingdom
- 13.5.5 Spain
- 13.5.6 Poland
- 13.5.7 Russia
- 13.5.8 Netherlands
- 13.5.9 Belgium
- 13.5.10 Sweden
- 13.5.11 Denmark
- 13.5.12 Norway
- 13.5.13 Rest of Europe
- 13.6 Asia Pacific
- 13.6.1 China
- 13.6.2 India
- 13.6.3 Japan
- 13.6.4 South Korea
- 13.6.5 Thailand
- 13.6.6 Indonesia
- 13.6.7 Vietnam
- 13.6.8 Malaysia
- 13.6.9 Australia
- 13.6.10 Rest of Asia Pacific
- 13.7 Latin America
- 13.7.1 Brazil
- 13.7.2 Argentina
- 13.7.3 Colombia
- 13.7.4 Chile
- 13.7.5 Rest of Latin America
- 13.8 Middle East
- 13.8.1 Saudi Arabia
- 13.8.2 United Arab Emirates
- 13.8.3 Turkey
- 13.8.4 Israel
- 13.8.5 Iran
- 13.8.6 Rest of the Middle East
- 13.9 Africa
- 13.9.1 South Africa
- 13.9.2 Egypt
- 13.9.3 Nigeria
- 13.9.4 Morocco
- 13.9.5 Rest of Africa
- 13.10 Regional Investment, Policy and Supply Chain Differences
- 13.11 Regional Competitive Landscape
- 13.12 Geographic Growth Hotspots
Chapter 14 Global Axial Spondyloarthritis Technology, Innovation and Sustainability Outlook
- 14.1 Technology Landscape and Maturity
- 14.2 Product, Process and Service Innovation
- 14.3 AI, Automation and Digital Tools in the Industry
- 14.4 Technology Adoption and Performance Benchmarking
- 14.5 Innovation Pipeline and R&D Investment
- 14.6 Patent and Intellectual Property Trends
- 14.7 Energy Efficiency and Resource Management
- 14.8 Sustainability, Recycling and Circularity
- 14.9 Technology Roadmap, 2025-2032
- 14.10 Risks of Obsolescence and Technology Substitution
Chapter 15 Global Axial Spondyloarthritis Market Key Strategic Imperatives
- 15.1 Growth and Market Entry Priorities
- 15.2 High-Return Products and Segments
- 15.3 Pricing, Profitability and Cost Optimization
- 15.4 Technology Investment and Product Differentiation
- 15.5 Supply Chain Localization and Resilience
- 15.6 Distribution and Customer Acquisition
- 15.7 Partnership, Acquisition and Capacity Strategy
- 15.8 Regional Expansion Priorities
- 15.9 Short-, Medium- and Long-Term Actions
Chapter 16 Competition Outlook
- 16.1 Industry Competition Characteristics
- 16.2 Market Structure and Concentration
- 16.3 Market Share and Competitive Positioning, 2025
- 16.4 Company-Wise Revenue and Product Benchmarking
- 16.5 Production and Service Capacity Benchmarking
- 16.6 Technology, Pricing and Differentiation
- 16.7 Regional Footprint and Distribution Strength
- 16.8 Mergers, Acquisitions and Strategic Alliances
- 16.9 New Entrants and Competitive Threats
- 16.10 Porter's Five Forces and Industry Attractiveness
- 16.11 Competitive Outlook, 2025-2032
Chapter 17 Company Profiles
- 17.1 Company Coverage and Selection Criteria
- 17.2 AbbVie Inc.
- 17.2.1 Business Description
- 17.2.2 Company Ownership and Geographic Presence
- 17.2.3 Product and Service Portfolio
- 17.2.4 Manufacturing and Operating Footprint
- 17.2.5 Production Capacity and Expansion Plans
- 17.2.6 Financial Performance and Investment
- 17.2.7 Market Share and Competitive Position
- 17.2.8 Technology and Innovation Capabilities
- 17.2.9 Strategic Alliances or Partnerships
- 17.2.10 Recent Developments
- 17.2.11 Growth Strategy and Outlook
- 17.3 Novartis AG
- 17.4 UCB S.A.
- 17.5 Eli Lilly and Company
- 17.6 Pfizer Inc.
- 17.7 Johnson & Johnson
- 17.8 Janssen Biotech
- 17.9 Amgen Inc.
- 17.10 Kyowa Kirin Co., Ltd.
- 17.11 Bristol Myers Squibb / Celgene Corporation
- 17.12 Other Relevant Market Participants
Note: Every listed company is profiled on the structure shown under the first company. The company list is preliminary and may change based on research findings, market developments, data availability and client requirements.
Chapter 18 Disclaimer
- 18.1 Research and Forecast Disclaimer
- 18.2 Data Source and Estimation Limitations
Note: The depth of individual sections depends on data availability for this market. Volume, capacity, trade and other unit-based metrics are included where applicable.

