
Biopharmaceutical Fermentation Market Overview:
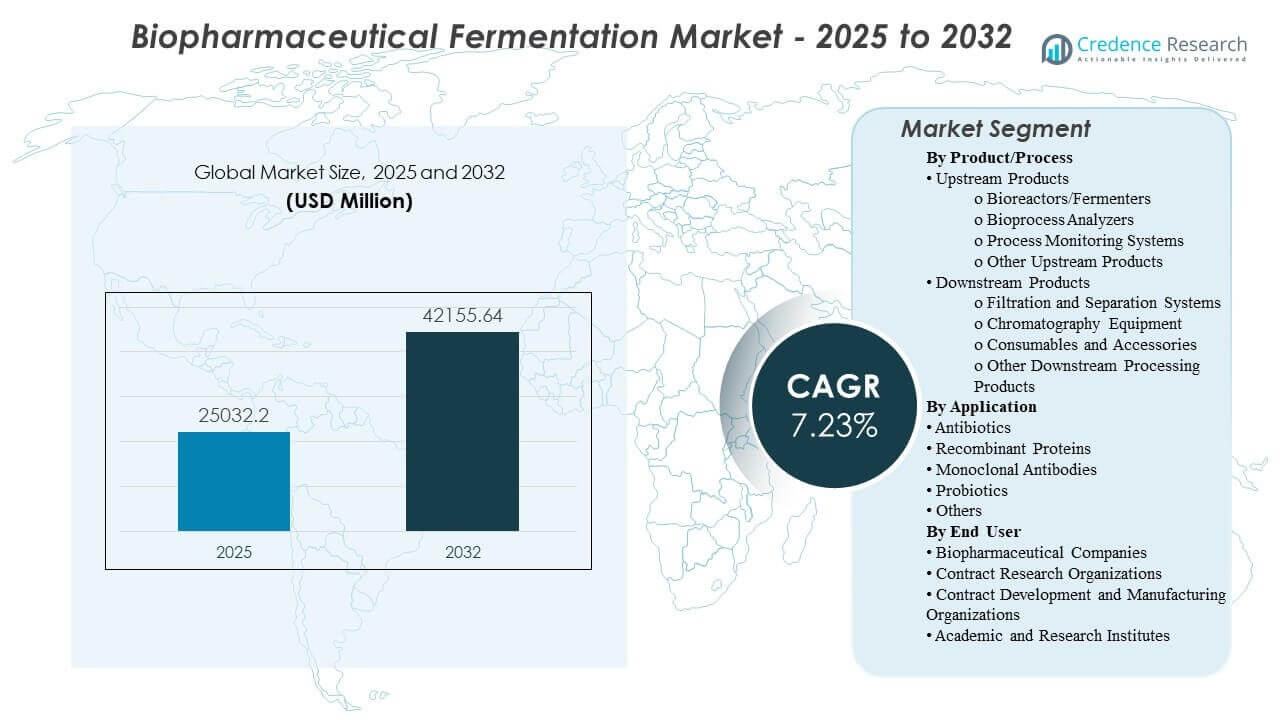
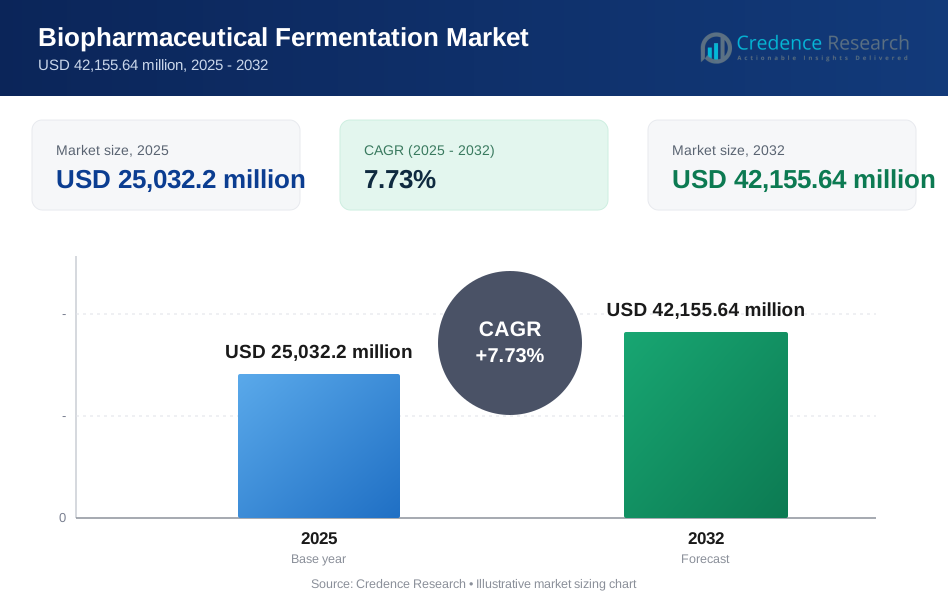
The global Biopharmaceutical Fermentation Market size was estimated at USD 25,032.2 million in 2025 and is expected to reach USD 42,155.64 million by 2032, growing at a CAGR of 7.73% from 2025 to 2032. Demand is primarily driven by the scale-up of biologics pipelines that require higher, more reproducible yields and tighter process control across development-to-commercial manufacturing. Capacity buildouts and process standardization across major biopharma hubs continue to strengthen spending on fermentation systems, monitoring, and purification toolchains.
| REPORT ATTRIBUTE | DETAILS |
|---|---|
| Historical Period | 2020-2024 |
| Base Year | 2025 |
| Forecast Period | 2026-2032 |
| Biopharmaceutical Fermentation Market Size 2025 | USD 25,032.2 million |
| Biopharmaceutical Fermentation Market, CAGR | 7.73% |
| Biopharmaceutical Fermentation Market Size 2032 | USD 42,155.64 million |
Key Market Trends & Insights
- The market is projected to expand from USD 25,032.2 million (2025) to USD 42,155.64 million (2032) at a 7.73% CAGR (2025–2032).
- North America accounted for 43.6% in 2025, reflecting its concentration of commercial biologics manufacturing and process development capacity.
- Europe held 27.4% share in 2025, supported by strong bioprocess innovation and established biologics production networks.
- Asia Pacific reached 17.8% share in 2025, underpinned by capacity additions and localized manufacturing programs in key markets.
- Downstream Products led with 46.4% share (2025), showing purification and separation as the largest spend area within the fermentation workflow.
Segment Analysis
Biopharmaceutical fermentation purchasing is shaped by performance under real operating conditions, particularly repeatability of yields, contamination control, and the ability to scale without process drift. Buyers increasingly prioritize validation readiness, documentation depth, and service responsiveness because fermentation steps must integrate tightly with downstream purification and quality systems. Total cost of ownership decisions tend to consider consumable usage, changeover time, and batch success probability alongside equipment pricing.
The workflow continues to polarize between scalable upstream execution and downstream bottleneck management, as higher-value biologics increase purification complexity and throughput constraints. Standardized platforms and harmonized operating models across sites support repeatable production and faster tech transfer. As a result, demand is reinforced for integrated toolchains spanning bioreactors, analytics, process monitoring, filtration, chromatography, and associated consumables.
By Product/Process Insights
Downstream Products accounted for the largest share of 46.4% in 2025. This leadership reflects how purification, separation, and polishing steps often determine end-to-end throughput and product quality performance for biologics. Buyers prioritize robust filtration and chromatography performance to manage impurities and ensure consistent critical quality attributes at scale. The recurring nature of consumables and accessories usage also strengthens downstream revenue share, particularly in multi-product facilities with frequent campaign changeovers.
By Application Insights
Recombinant Proteins accounted for the largest share of 43.0% in 2025. The segment benefits from broad therapeutic and industrial relevance, sustaining steady demand for fermentation capacity across development and manufacturing stages. Manufacturers emphasize reproducibility and scalable process performance, which increases pull-through for monitoring and analytical systems that control critical process parameters. Continuous optimization efforts to improve yield and quality further support ongoing upgrades and replacement cycles across core fermentation platforms.
By End User Insights
Biopharmaceutical Companies accounted for the largest share of 41.6% in 2025. Large manufacturers sustain recurring demand through internal capacity expansion, process improvement programs, and multi-site standardization initiatives. In-house strategies typically favor validated platforms and proven supplier quality systems to minimize operational and compliance risk. These organizations also invest in integrated upstream-to-downstream stacks to reduce cycle time and improve batch success rates across routine production campaigns.
Biopharmaceutical Fermentation Market Drivers
Biologics Pipeline Scale-Up and Commercial Manufacturing Expansion
Biopharmaceutical pipelines continue to expand across multiple modalities, increasing the need for scalable fermentation capacity and repeatable process performance. Manufacturers invest in platforms that support robust scale-up from development to commercial volumes with minimal process drift. Strong demand for validated workflows increases adoption of standardized equipment, monitoring, and analytical solutions. As facilities run more campaigns, the pull-through effect strengthens demand for consumables, maintenance, and lifecycle services.
- For instance, Samsung Biologics announced Plant 5 as a 180,000-liter manufacturing facility within a 96,000 m2 Bio Campus II expansion, which the company said would lift its total site capacity to 784,000 liters upon completion, underscoring how large-scale biologics players are quantifying commercial manufacturing build-out.
Process Control, Monitoring, and Data-Driven Bioprocessing
Fermentation outcomes depend on tight control of critical parameters, driving uptake of bioprocess analyzers and process monitoring systems. Buyers prioritize solutions that improve visibility into performance drivers such as pH, dissolved oxygen, metabolites, and productivity indicators. Improved monitoring reduces variability and supports faster troubleshooting, which can improve batch success probability. Integration readiness with digital quality and manufacturing systems further reinforces procurement of compatible monitoring stacks.
Downstream Throughput Constraints and Purification Complexity
Downstream steps often define overall throughput and product quality, especially as impurity profiles and purification requirements become more demanding. Investments rise in filtration, separation, and chromatography systems that can deliver repeatable performance under scale and time pressure. Facilities also prioritize validated purification workflows to meet stringent quality specifications and consistency expectations. The recurring spend on consumables and accessories supports steady revenue even when capital cycles fluctuate.
- For instance, Sartorius reported that its Sartobind Rapid A platform reached around 40 g/L dynamic binding capacity, maintained yields from 98.0% to 99.4% across 1.2 mL, 10 mL, and 70 mL device sizes, and supported average cycle times of 10 to 11 minutes, highlighting how newer capture technologies are targeting both speed and consistency in high-throughput purification.
Standardization and Tech Transfer Across Multi-Site Networks
Large biopharma organizations increasingly harmonize process platforms across sites to simplify tech transfer and shorten manufacturing readiness timelines. Standardization reduces training burden, improves comparability of outcomes, and supports scalable capacity planning. Platform approaches also streamline validation and documentation practices across networks. This trend supports consolidated purchasing and longer-term supplier relationships focused on reliability, service coverage, and qualification support.
Biopharmaceutical Fermentation Market Challenges
Biopharmaceutical fermentation programs face operational risk from contamination, batch failure, and variability when processes move across scales or sites. Maintaining consistency requires strong environmental controls, validated cleaning strategies, and disciplined process control, which can raise cost and complexity. Qualification expectations and documentation demands can lengthen procurement and deployment timelines, particularly for regulated production environments. Supply continuity for critical consumables can also create bottlenecks when facilities run high utilization or operate multi-product schedules.
- For instance, Thermo Fisher Scientific states that its DynaDrive single-use bioreactor platform spans 50 L, 500 L, 3,000 L, and 5,000 L systems, with turndown ratios of 10:1 at 50 L, 20:1 at 500 L, 12.5:1 at 3,000 L, and 20:1 at 5,000 L, and that the platform is optimized for cell culture processes above 100 million cells/mL, illustrating how suppliers are engineering scale consistency and contamination-risk reduction into commercial bioprocess hardware.
Workforce and execution constraints can slow adoption of advanced monitoring and integrated workflows, especially where teams must balance legacy processes with modernization priorities. Scale-up and tech transfer often expose gaps in comparability, requiring additional development time to stabilize performance. Downstream capacity planning is particularly sensitive, since purification constraints can delay end-to-end throughput even when upstream performance improves. In addition, integrating new systems into quality and manufacturing infrastructure can require careful change control and validation planning.
Market Trends and Opportunities
Single-use and modular bioprocessing approaches continue to expand where faster changeovers and reduced cross-contamination risk are strategic priorities. This supports opportunities across integrated hardware, fluid management, and consumables ecosystems that simplify campaign execution. Standardized platform purchasing also creates room for suppliers that can provide end-to-end support, including method development assistance and validation documentation. As more facilities target speed-to-clinic and flexibility, demand rises for solutions that shorten deployment timelines and reduce operational burden.
- For instance, Cytiva states that its FlexFactory single-use platform can be fully qualified and ready to run 6 to 9 months after conceptual design, or 9 to 12 months across the full project timeline, can support up to 4 x 2000 L bioreactors on a single downstream processing train, and has nearly 200 operational processing lines installed worldwide.
Process intensification and productivity improvement remain key opportunities, especially where manufacturers aim to increase output without proportional footprint expansion. Adoption of stronger analytics and monitoring enables tighter control, faster troubleshooting, and improved repeatability across batches. Downstream innovations that address purification bottlenecks can unlock significant value by improving end-to-end cycle time. Service-led models that accelerate tech transfer and scale-up support also expand opportunities with organizations balancing internal capacity and external partnerships.
Regional Insights
North America
North America accounted for 43.6% share in 2025, supported by a dense concentration of biopharmaceutical innovators, large-scale manufacturing capacity, and established ecosystems for process development and validation. Demand is reinforced by ongoing biologics scale-up activity and continuous improvement programs that sustain recurring equipment and consumables spend. Buyers in this region often emphasize qualification readiness, service coverage, and integration compatibility with quality and manufacturing systems.
Europe
Europe held 27.4% share in 2025, reflecting strong biologics production capacity and a mature supplier ecosystem across major pharmaceutical hubs. Regional demand benefits from process innovation, established regulatory operating practices, and sustained investment in production modernization. Multi-site manufacturing networks and standardization initiatives also support platform-based procurement and recurring downstream consumables usage.
Asia Pacific
Asia Pacific represented 17.8% share in 2025, driven by expanding biologics manufacturing capacity, localization programs, and rising output from regional biopharmaceutical and contract manufacturing ecosystems. Investments often prioritize scalable platforms that can support rapid tech transfer and consistent performance under increasing utilization. Growth momentum is reinforced by efforts to build resilient supply chains and strengthen regional manufacturing self-sufficiency.
Latin America
Latin America accounted for 6.9% share in 2025, supported by selective growth in localized pharmaceutical manufacturing and gradual development of biologics capabilities. Demand is typically concentrated in priority markets where health system needs and local production strategies encourage investment. Buyers often focus on cost-effective solutions with reliable service support and validated performance for core workflows.
Middle East & Africa
Middle East & Africa held 4.3% share in 2025, reflecting a smaller installed base of large-scale biologics fermentation hubs but growing interest in localization and healthcare manufacturing initiatives. Demand is often project-driven, linked to strategic programs and targeted capacity additions. Procurement priorities commonly include reliability, training support, and solutions that simplify qualification and operational execution.
Competitive Landscape
Competition is shaped by the breadth of upstream-to-downstream portfolios, depth of application support, global service footprint, and the ability to meet qualification and validation expectations in regulated manufacturing settings. Suppliers differentiate through integrated ecosystems that link fermentation equipment, process monitoring, and downstream purification workflows, along with strong lifecycle service and consumables availability. Customers also weigh vendor performance on tech-transfer support, lead times, and documentation quality that reduces deployment friction. Strategic positioning increasingly favors providers that can support end-to-end workflows across multiple sites and modalities.
Thermo Fisher Scientific Inc. is positioned to compete through a broad bioprocess toolkit that supports customers across development, scale-up, and commercial manufacturing needs. Its approach emphasizes integration across equipment, workflow consumables, and services that reduce operational complexity for fermentation-driven manufacturing programs. The company’s scale and service coverage can support global customers seeking standardization across multi-site networks. Ongoing ecosystem depth strengthens its ability to serve both high-throughput production and platform-based process development environments.
The industry research and growth report includes detailed analyses of the competitive landscape of the market and information about key companies, including:
- Thermo Fisher Scientific Inc.
- Danaher Corporation
- Cytiva
- Sartorius Stedim Biotech
- Merck KGaA
- Eppendorf AG
- Lonza Group AG
- Agilent Technologies
- F. Hoffmann-La Roche Ltd.
- Becton, Dickinson and Company (BD)
- GEA Group
Qualitative and quantitative analysis of companies has been conducted to help clients understand the wider business environment as well as the strengths and weaknesses of key industry players. Data is qualitatively analyzed to categorize companies as pure play, category-focused, industry-focused, and diversified; it is quantitatively analyzed to categorize companies as dominant, leading, strong, tentative, and weak.
Recent Developments
- In February 2026, Cytiva expanded its Fast Trak process development and validation facility in Bengaluru, India, to help biopharma companies shorten development timelines, reduce manufacturing risk, and scale production more confidently.
- In April 2025, Sartorius Stedim Biotech partnered with Tulip to deliver digital solutions for single-use bioprocessing, targeting operational challenges in biopharma manufacturing environments.
- In October 2025, Merck KGaA announced the acquisition of JSR Life Sciences’ Protein A chromatography technology platform to strengthen its bioprocessing portfolio and support more efficient, scalable monoclonal-antibody manufacturing.
- In December 2024, Eppendorf AG entered a strategic collaboration with DataHow AG to integrate DataHowLab with Eppendorf’s BioNsight cloud platform, improving data management and analytics for bioprocess development.
Report Scope
| Report Attribute | Details |
| Market size value in 2025 | USD 25,032.2 million |
| Revenue forecast in 2032 | USD 42,155.64 million |
| Growth rate (CAGR) | 7.73% (2025–2032) |
| Base year | 2025 |
| Forecast period | 2026–2032 |
| Quantitative units | USD million |
| Segments covered | By Product/Process: Upstream Products, Downstream Products; By Application: Antibiotics, Recombinant Proteins, Monoclonal Antibodies, Probiotics, Others; By End User: Biopharmaceutical Companies, CROs, CDMOs, Academic & Research Institutes |
| Regional scope | North America, Europe, Asia Pacific, Latin America, Middle East & Africa |
| Key companies profiled | Thermo Fisher Scientific Inc.; Danaher Corporation; Cytiva; Sartorius Stedim Biotech; Merck KGaA; Eppendorf AG; Lonza Group AG; Agilent Technologies; F. Hoffmann-La Roche Ltd.; Becton, Dickinson and Company (BD); GEA Group |
| No. of pages | 320 |
Segmentation
By Product/process
- Upstream Products [Bioreactors/Fermenters, Bioprocess Analyzers, Process Monitoring Systems, Other Upstream Products]
- Downstream Products [Filtration and Separation Systems, Chromatography Equipment, Consumables and Accessories, Other Downstream Processing Products]
By Application
- Antibiotics
- Recombinant Proteins
- Monoclonal Antibodies
- Probiotics
- Others
By End user
- Biopharmaceutical Companies
- Contract Research Organizations (CROs)
- Contract Development and Manufacturing Organizations (CDMOs)
- Academic and Research Institutes
By Region
- North America
- U.S.
- Canada
- Mexico
- Europe
- Germany
- France
- U.K.
- Italy
- Spain
- Rest of Europe
- Asia Pacific
- China
- Japan
- India
- South Korea
- South-east Asia
- Rest of Asia Pacific
- Latin America
- Brazil
- Argentina
- Rest of Latin America
- Middle East & Africa
- GCC Countries
- South Africa
- Rest of the Middle East and Africa
Request a Free Sample
Fill in your details and we'll send you a free sample report.
- Sample data tables & charts
- Research methodology
Need a Custom Version of This Report?
Tailor the scope, geography, or segments to your exact requirements.
- Custom geography or segment scope
- Direct access to our analyst team
Frequently Asked Questions
What is the market size of the Biopharmaceutical Fermentation Market in 2025?
What will be the Biopharmaceutical Fermentation Market size by 2032?
What is the CAGR of the Biopharmaceutical Fermentation Market during 2025–2032?
Which region leads the Biopharmaceutical Fermentation Market in 2025?
What is the leading product/process segment in 2025?
Which application segment leads the market in 2025?
Table of Content
Chapter 1. Report Introduction
- 1.1 Report Description & Purpose
- 1.1.1 Report Title & Market Definition
- 1.1.2 Unique Selling Propositions (USP) & Key Differentiators
- 1.1.3 Value Proposition for Stakeholders
- 1.2 Research Objectives
- 1.2.1 Market Sizing Objectives (Volume & Revenue) (Volume Where Applicable)
- 1.2.2 Segmentation Objectives
- 1.2.3 Competitive Intelligence Objectives
- 1.2.4 Forecast & Scenario Objectives
- 1.3 Report Scope
- 1.3.1 Biopharmaceutical Fermentation Scope – Segments & Subsegments Covered
- 1.3.2 Geographic Scope – Regions & Countries Covered
- 1.3.3 Historical Period, Base Year & Forecast Period (2025; forecast to 2032)
- 1.3.4 Inclusions & Exclusions
- 1.4 Industry Classification & Applicable Codes
- 1.5 Currency, Measurement Units & Valuation Basis
- 1.6 Target Stakeholders
- 1.7 Limitations & Assumptions
Chapter 2. Executive Summary
- 2.1 Global Biopharmaceutical Fermentation Market Snapshot
- 2.1.1 Market Size – Historical (2025) & Forecast (2025-2032) (2025: USD 25,032.2 million → 2032: USD 42,155.64 million)
- 2.1.2 Volume & Revenue – Global Totals (Volume Where Applicable)
- 2.1.3 Key Market Highlights – Top Five Facts
- 2.2 Biopharmaceutical Fermentation Market Segmentation Snapshot
- 2.2.1 Market Split by Region – 2025 vs. 2032
- 2.3 Competitive Snapshot
- 2.3.1 Top 10 Players by Revenue Share – 2025
- 2.3.2 Top 10 Players by Volume Share – 2025 (Volume Where Applicable)
- 2.3.3 Recent Strategic Developments (18-Month Summary)
- 2.4 Key Investment Highlights & Strategic Conclusions
Chapter 3. Biopharmaceutical Fermentation Market Dynamics & Industry Analysis
- 3.1 Market Overview & Context
- 3.1.1 Biopharmaceutical Fermentation Market Position in the Broader Industry Value Chain
- 3.1.2 Demand Structure & Purchasing Dynamics
- 3.1.3 Market Maturity & Development Stage by Region
- 3.2 Biopharmaceutical Fermentation Market Drivers
- 3.3 Biopharmaceutical Fermentation Market Restraints & Challenges
- 3.4 Biopharmaceutical Fermentation Market Opportunities
- 3.5 Porter's Five Forces Analysis
- 3.5.1 Threat of New Entrants
- 3.5.2 Bargaining Power of Suppliers
- 3.5.3 Bargaining Power of Buyers
- 3.5.4 Threat of Substitutes
- 3.5.5 Competitive Rivalry – Intensity Assessment
- 3.6 Biopharmaceutical Fermentation Value Chain Analysis
- 3.6.1 Upstream – Key Inputs, Resources & Suppliers
- 3.6.1.1 Key Input/Resource 1
- 3.6.1.2 Key Input/Resource 2
- 3.6.1.3 Key Input/Resource 3
- 3.6.2 Midstream – Core Operations & Value Creation
- 3.6.2.1 Operating Model & Process Overview
- 3.6.2.2 Key Operating Locations & Capabilities by Company
- 3.6.3 Downstream – Market Channels & End Users
- 3.6.3.1 Direct Sales & Customer Engagement Channels
- 3.6.3.2 Indirect Sales, Intermediaries & Partner Channels
- 3.6.4 Value Chain Profitability Analysis
- 3.6.1 Upstream – Key Inputs, Resources & Suppliers
- 3.7 PESTEL Analysis
- 3.7.1 Political Factors
- 3.7.2 Economic Factors
- 3.7.3 Social Factors
- 3.7.4 Technological Factors
- 3.7.5 Environmental Factors
- 3.7.6 Legal Factors
- 3.8 Biopharmaceutical Fermentation Supply Chain Analysis
- 3.8.1 Critical Input & Resource Availability Risk Assessment
- 3.8.2 Supplier & Operational Concentration Risk (Geographic Exposure)
- 3.8.3 Supply & Service Disruption Impact Analysis
- 3.9 Regulatory & Policy Landscape
Note: The regulatory and policy landscape section covers regulations based on their applicability to the market, Biopharmaceutical Fermentation category, geography, and scope of the study. Only regulatory frameworks with a material impact on operations, compliance, trade, sustainability, or market access are analyzed in detail.
Chapter 4. Key Investment Pockets & Opportunity Analysis
- 4.1 Biopharmaceutical Fermentation Market Attractiveness Analysis
- 4.1.1 By Region – Investment Attractiveness Matrix (Market Size × CAGR)
- 4.2 Absolute Revenue Growth Opportunity
- 4.2.1 By Region – Absolute Revenue Growth Through 2032
- 4.3 Incremental Demand Opportunity
- 4.3.1 By Region – Incremental Demand Through 2032
- 4.3.2 Segment – Incremental Demand
- 4.4 Emerging Submarket Opportunity Deep Dive (Subject to Applicability)
- 4.5 Priority Market Opportunity Scorecards
- 4.5.1 United States
- 4.5.2 Europe
- 4.5.3 Asia
- 4.5.4 Middle East & Africa
Note: Priority market opportunity scorecards reflect the geographic scope and strategic relevance of the study. Listed markets are indicative and may be adapted to the industry.
Chapter 5. Biopharmaceutical Fermentation Cross-Border Trade & Market Access Analysis
- 5.1 International Trade & Cross-Border Activity Overview
- 5.1.1 Global Export Value by Country (2025)
- 5.1.2 Global Export Volume by Country (2025) (Volume Where Applicable)
- 5.1.3 Global Import Value by Country (2025)
- 5.1.4 Global Import Volume by Country (2025) (Volume Where Applicable)
- 5.1.5 Net Trade Balance by Country (2025)
- 5.2 Export Analysis – Segment
- 5.2.1 Category 1 (Applicable Classification Code)
- 5.2.2 Category 2 (Applicable Classification Code)
- 5.2.3 Category 3 (Applicable Classification Code)
- 5.2.4 Category 4 (Applicable Classification Code)
- 5.2.5 Category 5 (Applicable Classification Code)
- 5.3 Import Analysis – Segment
- 5.3.1 Category 1 (Applicable Classification Code)
- 5.3.2 Category 2 (Applicable Classification Code)
- 5.3.3 Category 3 (Applicable Classification Code)
- 5.3.4 Category 4 (Applicable Classification Code)
- 5.3.5 Category 5 (Applicable Classification Code)
- 5.4 Cross-Border Pricing & Transaction Benchmarks
- 5.4.1 Export Pricing – Segment & Country
- 5.4.2 Import Pricing – Segment & Source Country
- 5.4.3 Price Trends (2025)
- 5.5 Key Cross-Border Trade & Delivery Routes
- 5.5.1 Cross-Border Trade/Delivery Route 1
- 5.5.2 Cross-Border Trade/Delivery Route 2
- 5.5.3 Cross-Border Trade/Delivery Route 3
- 5.5.4 Cross-Border Trade/Delivery Route 4
- 5.5.5 Cross-Border Trade/Delivery Route 5
- 5.6 Trade Policy & Market Access Impact Assessment
- 5.6.1 Tariff & Non-Tariff Barriers
- 5.6.2 Regional Trade & Economic Integration Frameworks
- 5.6.3 Bilateral & Multilateral Trade Agreements
- 5.6.4 Cross-Border Operating, Licensing & Localization Requirements
Note: This chapter applies where cross-border trade or delivery is relevant to Biopharmaceutical Fermentation. Goods, services, and digital offerings are assessed using applicable classifications and transaction measures. Import-export volumes, trade balances, and route analyses are included only where meaningful to the market.
Chapter 6. Competitive Landscape & Company Benchmarking
- 6.1 Biopharmaceutical Fermentation Market Concentration & Structure
- 6.1.1 Herfindahl-Hirschman Index (HHI) – vs. 2025
- 6.1.2 Leading, Mid-Sized & Emerging Player Structure
- 6.1.3 Global, Regional & Local Player Dynamics
- 6.2 Biopharmaceutical Fermentation Market Share Analysis – 2025
- 6.2.1 Global Revenue Share by Company
- 6.2.2 Global Volume Share by Company (Volume Where Applicable)
- 6.2.3 Regional Revenue Share
- 6.2.4 Market Share Evolution ( vs. 2025)
- 6.2.5 Company Market Share by Key Segment
- 6.2.6 Company Market Share by Customer Group
- 6.3 Operating Scale, Capacity & Infrastructure Analysis
- 6.3.1 Global Operating Scale & Supply Capacity
- 6.3.2 Resource Utilization & Operating Efficiency
- 6.3.3 Output, Service Delivery & Activity Metrics
- 6.3.4 Operating Footprint & Infrastructure Map
- 6.3.5 Planned Operational & Capacity Expansion
- 6.4 Biopharmaceutical Fermentation Competitive Benchmarking Matrix
- 6.4.1 Revenue, Growth, Profitability & Operating Metric Comparison
- 6.4.2 Channel Revenue Mix
- 6.4.3 Geographic Revenue Exposure
- 6.4.4 R&D Intensity
- 6.4.5 Sustainability Maturity
- 6.5 Strategic Developments in Biopharmaceutical Fermentation (Last 24 Months)
- 6.5.1 Mergers, Acquisitions & Divestments
- 6.5.2 New Products, Services & Solutions in Biopharmaceutical Fermentation
- 6.5.3 Operational & Infrastructure Expansions
- 6.5.4 Strategic Alliances, Joint Ventures & Partnerships
- 6.5.5 Distribution Expansion & Market Entry
- 6.5.6 Sustainability & ESG Initiatives
- 6.6 Competitive Strategy Mapping
- 6.6.1 Leader, Challenger, Follower & Niche Classification
- 6.6.2 Pricing Strategy Comparison
- 6.6.3 Channel Strategy Matrix
Note: Strategic developments are included based on their materiality and the availability of reliable information.
Chapter 7. Global Biopharmaceutical Fermentation Market – By Sales & Delivery Channel
- 7.1 Segment Overview
- 7.1.1 Volume & Revenue Split by Channel (2025 & 2032) (Volume Where Applicable)
- 7.1.2 Channel Mix Evolution (2025-2032)
Chapter 8. Regional Market Analysis – Global Overview
- 8.1 Global Regional Overview
- 8.1.1 Regional Volume Share (Volume Where Applicable)
- 8.1.2 Regional Revenue Share
- 8.1.3 Regional Volume by Region (Volume Where Applicable)
- 8.1.4 Regional Revenue by Region
- 8.1.5 Regional Forecast Through 2032
- 8.2 Cross-Regional Segment Analysis
- 8.2.1 By Sales & Delivery Channel
- 8.2.2 By Competitive Positioning & Price Tier
Chapter 9. North America Biopharmaceutical Fermentation Market
- 9.1 United States
- 9.2 Canada
- 9.3 Mexico
Chapter 10. Europe Biopharmaceutical Fermentation Market
- 10.1 Germany
- 10.2 France
- 10.3 Italy
- 10.4 United Kingdom
- 10.5 Spain
- 10.6 Poland
- 10.7 Russia
- 10.8 Netherlands
- 10.9 Belgium
- 10.10 Sweden
- 10.11 Denmark
- 10.12 Norway
- 10.13 Rest of Europe
Chapter 11. Asia Pacific Biopharmaceutical Fermentation Market
- 11.1 China
- 11.2 India
- 11.3 Japan
- 11.4 South Korea
- 11.5 Thailand
- 11.6 Indonesia
- 11.7 Vietnam
- 11.8 Malaysia
- 11.9 Australia
- 11.10 Rest of Asia Pacific
Chapter 12. Latin America Biopharmaceutical Fermentation Market
- 12.1 Brazil
- 12.2 Argentina
- 12.3 Colombia
- 12.4 Chile
- 12.5 Rest of Latin America
Chapter 13. Middle East Biopharmaceutical Fermentation Market
- 13.1 Saudi Arabia
- 13.2 United Arab Emirates
- 13.3 Turkey
- 13.4 Israel
- 13.5 Iran
- 13.6 Rest of the Middle East
Chapter 14. Africa Biopharmaceutical Fermentation Market
- 14.1 South Africa
- 14.2 Egypt
- 14.3 Nigeria
- 14.4 Morocco
- 14.5 Rest of Africa
Chapter 15. Biopharmaceutical Fermentation Company Profiles
- 15.1 [Company 01]
- 15.1.1 Company Overview
- 15.1.2 Key Management Personnel
- 15.1.3 Products & Services Portfolio
- 15.1.4 Financial Performance
- 15.1.5 Key Market Focus & Geographic Presence
- 15.1.6 Recent Developments & Strategic Initiatives
Note: The company profile list is preliminary and may change based on research findings, market developments, data availability, and client requirements.
Chapter 16. Appendices
- Appendix A – List of Abbreviations & Acronyms
- Appendix B – Industry Classification Code Reference – Full Series
- Appendix C – Supply, Output & Operating Capacity Data Tables
- Appendix D – End-Use & Demand Base Tables
- Appendix E – Demand, Adoption & Usage Assumptions
- Appendix F – Pricing & Revenue Metric Reference Tables
- Appendix G – Company Operations & Infrastructure Database
- Appendix H – Cross-Border Trade & Activity Data Tables (Where Applicable)
- Appendix I – Regulatory Summary Tables
- Appendix J – Primary Research Participant List (Anonymized)
- Appendix K – Primary Research Questionnaire Framework
- Appendix L – Data Sources & Bibliography
- Appendix M – Market Size Divergence & Source Comparison
Chapter 17. Research Methodology
- 17.1 Research Framework & Philosophy
- 17.2 Secondary Research – Sources, Hierarchy & Data Extraction
- 17.3 Data Modeling – Bottom-Up & Top-Down Market Sizing
- 17.4 Primary Research – Stakeholder Framework, LOI & Sample Sizes
- 17.5 Forecast Methodology – Regression, Scenario & Sensitivity Analysis
- 17.6 Quality Control – Four-Layer Validation Framework
- 17.7 Limitations & Standard Assumptions
- 17.8 Disclaimer
