Bioreactor Market Overview:
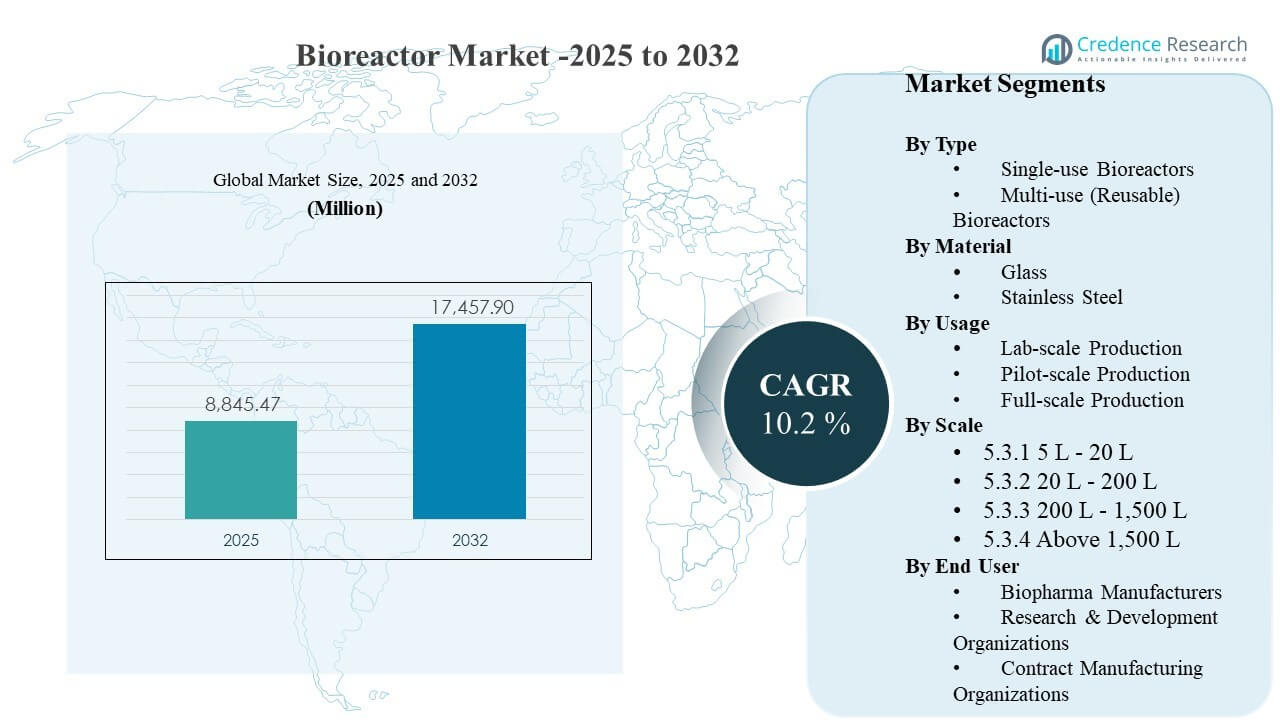
The global Bioreactor Market size was estimated at USD 8845.47 million in 2025 and is expected to reach USD 17457.9 million by 2032, growing at a CAGR of 10.2% from 2025 to 2032. Expansion in biologics, vaccines, and advanced therapy manufacturing is increasing demand for scalable upstream capacity that can maintain tight process control and consistent yields. Capacity build-outs across established biomanufacturing hubs and newer investment corridors are also accelerating replacement and upgrade cycles, particularly where facilities prioritize faster changeovers and automation-ready platforms.
| REPORT ATTRIBUTE |
DETAILS |
| Historical Period |
2020-2024 |
| Base Year |
2025 |
| Forecast Period |
2026-2032 |
| Bioreactor Market Size 2025 |
USD 8845.47 million |
| Bioreactor Market, CAGR |
10.2% |
| Bioreactor Market Size 2032 |
USD 17457.9million |
Key Market Trends & Insights
- Commercial Production accounted for the largest share of 57.6% in 2025, reflecting sustained purchasing from GMP manufacturing environments.
- North America held 41.8% revenue share in 2025, supported by a high concentration of commercial biologics and CDMO capacity.
- Multi-use (Reusable) Bioreactors represented 74.8% share in 2025, indicating continued reliance on reusable fleets for large-volume manufacturing.
- The 200 L – 1,500 L scale segment captured 38.2% share in 2025, highlighting the importance of mid-scale systems for scale-up and validation workflows.
- The market is projected to expand at a 10.2% CAGR over 2025–2032, underpinned by ongoing biologics pipeline progression and manufacturing footprint expansion.
Segment Analysis
Purchasing behavior in the Bioreactor Market is shaped by a balancing act between throughput requirements and operational flexibility. Commercial manufacturing remains the primary demand center because production sites prioritize high uptime, consistent batch performance, and validated process control systems that reduce deviation risk. At the same time, development and clinical operations continue to expand as pipelines diversify, which increases demand for standardized platforms that can support rapid process development and smoother technology transfer into production settings.
System selection increasingly reflects total cost of ownership, facility utilization rates, and compliance burden. Reusable systems remain favored in high-volume environments where established SOPs, long equipment lifecycles, and large-batch economics remain compelling. However, adoption of flexible configurations is rising in multi-product and fast-changeover facilities, where reduced turnaround times, simplified cleaning validation, and quicker deployment can improve capacity utilization and reduce time-to-market.
Access crucial information at unmatched prices!
Request your sample report today & start making informed decisions powered by Credence Research Inc.!
Download Sample
Type Insights
Multi-use (Reusable) Bioreactors accounted for the largest share of 74.8% in 2025. This leadership is driven by strong installed base in commercial biologics manufacturing where long run times and high-volume production economics favor reusable trains. Many large facilities also maintain established qualification histories and operator familiarity, which reduces operational risk and supports consistent compliance performance. Reusable platforms remain attractive where utilities and maintenance infrastructure are already optimized for large-scale operations.
Material Insights
Stainless Steel accounted for the largest share of 46.1% in 2025. Stainless steel leadership is supported by durability, established validation pathways, and suitability for sustained commercial operations that require robust containment and repeatable cleaning cycles. Large-scale production environments typically prefer stainless systems for their longevity and stable performance under intensive utilization. In addition, existing service networks and spare-parts ecosystems reinforce continued purchasing and lifecycle support.
Usage Insights
Commercial Production accounted for the largest share of 57.6% in 2025. Commercial plants are the primary buyers because they invest in reliability, automation, and consistent process outcomes to protect batch value and meet delivery schedules. Replacement demand is also meaningful as facilities upgrade control systems, analytics integration, and closed-processing features. Outsourcing growth further increases demand because CDMOs often expand multi-client capacity and standardize around scalable production platforms.
Scale Insights
200 L – 1,500 L accounted for the largest share of 38.2% in 2025. This scale range is widely used for scale-up, process characterization, and validation activities that bridge early development and commercial readiness. Mid-scale systems enable parallel development programs and reduce technology transfer friction by keeping platform continuity across stages. The segment also benefits from broad applicability across modalities, from monoclonal antibodies to newer therapeutic formats with varying production intensity.
End User Insights
Biopharma manufacturers remain the primary demand center within the end-user landscape due to direct ownership of production capacity and ongoing investments in process robustness. Procurement priorities in this group typically emphasize compliance performance, batch repeatability, and lifecycle service coverage. Contract manufacturing organizations also contribute significantly as they expand flexible capacity to serve multi-client pipelines and accelerate scale-up timelines. Research and development organizations sustain steady demand for smaller and mid-scale systems designed for fast iteration and process optimization.
Bioreactor Market Drivers
Expansion of biologics and vaccine manufacturing capacity
Biologics volume growth continues to increase the requirement for reliable upstream capacity across commercial facilities and high-output CDMOs. Manufacturers prioritize bioreactor platforms that can deliver consistent yields across long production campaigns and support validated process control. Capacity additions also trigger purchases of associated control systems, sensors, and single-use assemblies, increasing total platform value. As facility networks expand geographically, standardization across sites becomes a key driver, strengthening demand for scalable equipment families.
- For instance, Samsung Biologics’ fifth plant in Songdo is designed to add 180,000 liters of bioreactor capacity, bringing its total installed capacity to 784,000 liters across a standardized network of large-scale bioreactor trains to support global biologics programs.
Increasing focus on operational flexibility and faster changeovers
Multi-product facilities and CDMOs benefit from platforms that reduce downtime and simplify transitions between campaigns. Flexible setups improve scheduling efficiency and allow manufacturers to respond to pipeline changes without long reconfiguration cycles. Shorter turnaround times are especially valuable when facilities run multiple smaller lots, frequent tech transfers, or accelerated programs. This flexibility requirement also increases interest in modular layouts and standardized workflows that can be replicated across suites.
Demand for higher process control, data integration, and automation readiness
Bioprocessing buyers increasingly evaluate bioreactors based on control precision, data capture, and ease of integration with plant systems. Modern platforms support tighter parameter management, improved reproducibility, and more consistent quality outcomes, which reduces deviation risk. Automation readiness also supports workforce efficiency by reducing manual interventions and limiting variability introduced by operator handling. These needs drive upgrades in legacy fleets and influence selection decisions for new capacity.
- For instance, Cytiva’s Figurate automation solutions and ÄKTA process DCS systems are predesigned to integrate directly with Emerson’s DeltaV distributed control system via Ethernet/IP, allowing standardized control recipes and consistent data interfaces to be reused across multiple skids and sites to improve automation readiness and reduce errors
Growth in outsourcing and scale-up intensity across therapy pipelines
Outsourcing growth increases multi-site expansion among CDMOs, which accelerates purchases of standardized bioreactor platforms that can serve diverse clients. Scale-up intensity also rises as therapies progress from clinical to commercial stages, increasing demand for equipment continuity to reduce transfer friction. Buyers typically prefer systems with predictable performance across volume families to maintain product comparability and process knowledge. This dynamic supports both new installations and replacement spending as facilities align fleets to evolving client and pipeline requirements.
Bioreactor Market Challenges
Supply chain and lead-time variability can disrupt expansion schedules, particularly for specialized components, control modules, and consumables that require qualification. Buyers often mitigate this risk through dual sourcing, buffer inventory, and supplier qualification programs, but these steps increase procurement complexity. Qualification timelines can also extend when facilities introduce new platforms that require documentation alignment and performance verification. Together, these issues can slow commissioning and reduce near-term capacity utilization.
- For instance, MilliporeSigma states that its Mobius® Stock single-use assemblies can ship within 24 hours and its Mobius® Select assemblies are available with a six-week lead time, yet the company also notes that adding a new supplier qualification request can take up to 12 months, depending on audit scheduling, which can delay validation work and full cGMP implementation.
Cost pressure remains a persistent challenge in biomanufacturing, shaping purchasing decisions toward platforms with predictable lifecycle costs and strong service coverage. Facilities must balance capital expenditure with ongoing operating costs related to maintenance, utilities, cleaning, and consumable usage. In regulated environments, process changes can introduce comparability work, increasing total program cost and timeline risk. This can limit rapid platform switching even when newer systems offer operational advantages.
Bioreactor Market Trends and Opportunities
Platform standardization across development and manufacturing is becoming a priority as companies seek faster scale-up and smoother technology transfers. Organizations increasingly adopt equipment families that maintain consistent control architecture and workflow design across volumes. This approach reduces training burden, supports data comparability, and lowers transfer friction between sites and stages. Vendors that can offer integrated ecosystems across hardware, consumables, and software are positioned to benefit from this standardization trend.
- For instance, Sartorius states that its BIOSTAT STR Generation 3 platform combines BIOSTAT STR bioreactors, Flexsafe STR bags, the Biobrain automation platform, and BioPAT Process Insights software, with the equipment family ranging from 50 L to 2,000 L and supporting scale-up from Ambr 250 to 2,000 L through conserved geometry for smoother tech transfer into GMP manufacturing.
There is growing opportunity in modernization programs that upgrade legacy systems with improved automation, data connectivity, and advanced control capabilities. Facilities aim to improve reproducibility and reduce operator dependence, particularly where throughput requirements increase. Expanded adoption of modular suites and flexible facility concepts also creates demand for configurations that can be deployed quickly and reconfigured as pipelines change. These opportunities support sustained investment cycles beyond greenfield capacity builds.
Regional Insights
North America
North America represented 41.8% of revenue share in 2025, supported by high concentration of commercial biologics production and strong CDMO ecosystems. Procurement often emphasizes platform reliability, validated performance, and integration with established quality systems. Replacement and upgrade cycles remain active as facilities modernize controls and analytics connectivity. Ongoing manufacturing expansions maintain demand across both production and development environments.
Europe
Europe accounted for 25.1% share in 2025, driven by a mature biopharma base and a sizable network of regulated manufacturing sites. Purchasing patterns often focus on standardization, compliance documentation quality, and lifecycle service support across multi-site operations. Capacity additions and modernization initiatives support steady demand for production-oriented systems. The regional footprint also benefits from established supplier and service infrastructure for bioprocess equipment.
Asia Pacific
Asia Pacific held 22.3% share in 2025, reflecting expanding biologics manufacturing footprints and increasing scale-up activity across key markets. Buyers in the region frequently prioritize scalable platforms that can support rapid capacity commissioning and workforce training at new sites. Competitive dynamics also encourage adoption of standardized equipment to accelerate time-to-market for both originator biologics and biosimilars. Growing CDMO capacity supports additional demand for flexible, multi-client configurations.
Latin America
Latin America represented 6.2% share in 2025, with demand concentrated in select national manufacturing hubs and expansion programs. Purchasing is often driven by targeted capacity upgrades, technology transfer initiatives, and selective localization of biologics production. Facilities may prioritize robust systems with strong service availability due to smaller installed bases and fewer specialized maintenance resources. Growth is supported by incremental investments rather than large-scale greenfield build-outs.
Middle East & Africa
Middle East & Africa accounted for 4.6% share in 2025, supported by emerging investments in healthcare manufacturing and selective bioprocessing capability development. Buyers often focus on proven platforms that can be commissioned reliably and supported through strong service models. Demand is typically tied to strategic initiatives, public-private capacity programs, and localized production priorities. The region remains smaller in installed base but shows increasing interest in scalable upstream infrastructure.
Competitive Landscape
Competition in the Bioreactor Market is shaped by platform breadth, process performance credibility, and the ability to offer integrated ecosystems that combine hardware, consumables, control software, and service coverage. Suppliers differentiate through validated performance at scale, automation readiness, and strong lifecycle support that reduces operational risk for regulated buyers. Pricing competitiveness is increasingly evaluated alongside total cost of ownership, lead-time reliability, and documentation quality. Partnerships with CDMOs and large biopharma networks also influence preferred vendor status and long-term fleet standardization.
Thermo Fisher Scientific maintains a strong position by aligning bioreactor offerings with end-to-end bioprocess workflows, supported by broad consumables coverage and scalable platform continuity across development and manufacturing use cases. The company’s approach typically emphasizes deployment simplicity, compatibility with downstream and analytics ecosystems, and service infrastructure designed for regulated environments. Continued investment in automation-ready configurations and platform standardization supports multi-site adoption and repeat purchasing. This positioning is particularly relevant for organizations seeking consistency across scale-up stages and facility networks.
The industry research and growth report includes detailed analyses of the competitive landscape of the market and information about key companies, including:
Qualitative and quantitative analysis of companies has been conducted to help clients understand the wider business environment as well as the strengths and weaknesses of key industry players. Data is qualitatively analyzed to categorize companies as pure play, category-focused, industry-focused, and diversified; it is quantitatively analyzed to categorize companies as dominant, leading, strong, tentative, and weak.
Shape Your Report to Specific Countries or Regions & Enjoy 30% Off!
Recent Developments
- In March 2025, Cytiva expanded its Xcellerex X-platform portfolio by adding 500 L and 2,000 L bioreactors to support growing bioprocessing needs. The company said the new single-use systems are intended to improve operational efficiency, increase production capacity, and support scale-up for advanced therapeutics manufacturing.
- In April 2025, Thermo Fisher Scientific launched the 5L DynaDrive Single-Use Bioreactor, with the announcement dated April 14, 2025. The company stated that this new bench-scale bioreactor extends its DynaDrive portfolio and offers scalability from 1 L to 5,000 L to help speed process development and transition from bench to commercialization.
- In August 2025, Cytiva and Culture Biosciences expanded their strategic collaboration, with Cytiva announcing the update on August 6, 2025. Under the partnership, Cytiva became the exclusive global distributor of Culture’s Stratyx 250 bioreactor platform and related consumables, while both companies also agreed to jointly develop additional bioreactor formats.
Report Scope
| Report Attribute |
Details |
| Market size value in 2025 |
USD 8845.47 million |
| Revenue forecast in 2032 |
USD 17457.9 million |
| Growth rate (CAGR) |
10.2% (2025–2032) |
| Base year |
2025 |
| Forecast period |
2026-2032 |
| Quantitative units |
USD million |
| Segments covered |
By Type Outlook: Single-use Bioreactors, Multi-use (Reusable) Bioreactors; By Material Outlook: Glass, Stainless Steel; By Usage Outlook: Developmental / Preclinical / Clinical, Commercial Production; By Scale Outlook: 5 L – 20 L, 20 L – 200 L, 200 L – 1,500 L, Above 1,500 L; By End User Outlook: Biopharma Manufacturers, Research & Development Organizations, Contract Manufacturing Organizations |
| Regional scope |
North America, Europe, Asia Pacific, Latin America, Middle East & Africa |
| Key companies profiled |
Thermo Fisher Scientific, Sartorius AG, Danaher Corporation, Merck KGaA, Eppendorf SE, GE HealthCare, PBS Biotech, Inc., ABEC, Inc., Repligen Corporation, Getinge AB companies |
| No.of Pages |
330 |
By Segmentation
By Type
- Single-use Bioreactors
- Multi-use (Reusable) Bioreactors
By Material
By Usage
- Developmental / Preclinical / Clinical
- Commercial Production
By Scale
- 5 L – 20 L
- 20 L – 200 L
- 200 L – 1,500 L
- Above 1,500 L
By End User
- Biopharma Manufacturers
- Research & Development Organizations
- Contract Manufacturing Organizations
By Region
- North America
- Europe
- Germany
- France
- U.K.
- Italy
- Spain
- Rest of Europe
- Asia Pacific
- China
- Japan
- India
- South Korea
- South-east Asia
- Rest of Asia Pacific
- Latin America
- Brazil
- Argentina
- Rest of Latin America
- Middle East & Africa
- GCC Countries
- South Africa
- Rest of the Middle East and Africa


