Market Overview
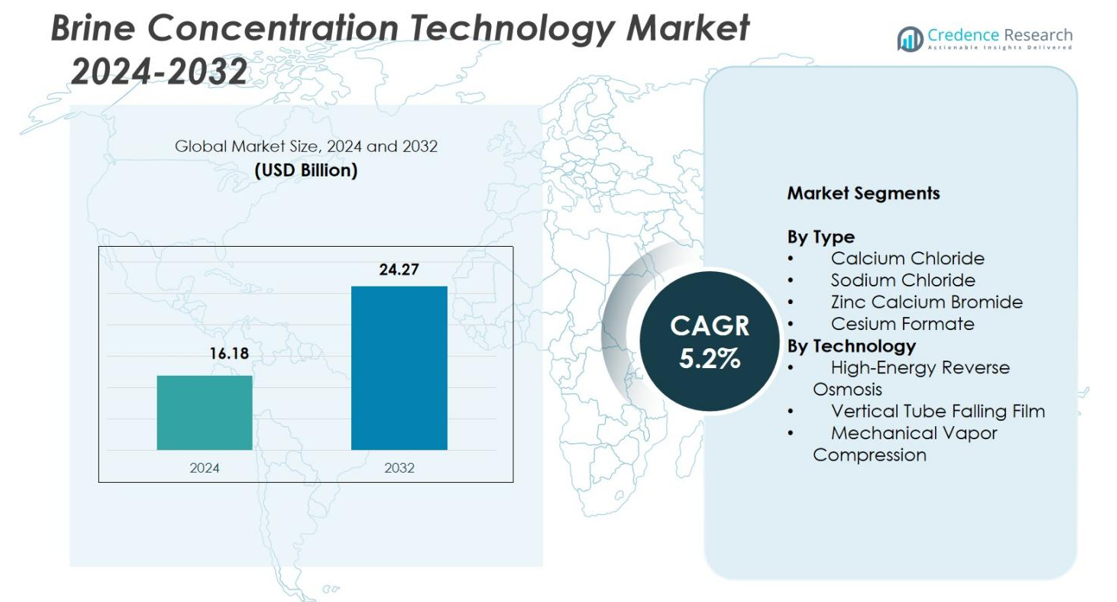
Brine Concentration Technology Market size was valued at USD 16.18 Billion in 2024 and is anticipated to reach USD 24.27 Billion by 2032, at a CAGR of 5.2% during the forecast period.
| REPORT ATTRIBUTE |
DETAILS |
| Historical Period |
2020-2023 |
| Base Year |
2024 |
| Forecast Period |
2025-2032 |
| Brine Concentration Technology Market Size 2024 |
USD 16.18 Billion |
| Brine Concentration Technology Market, CAGR |
5.2% |
| Brine Concentration Technology Market Size 2032 |
USD 24.27 Billion |
Brine Concentration Technology Market features leading players such as Saltworks Technologies, Aquatech International LLC, Samco Technologies, Koch Separation Solutions, Gradient, IDE Technologies, Aquachem, Evoqua Water Technologies, H2O Innovations, and Veolia Water Technologies, all driving advancements in high-efficiency brine treatment and ZLD systems. These companies strengthen their presence through innovations in membrane-thermal hybrids, MVC systems, and resource recovery solutions that address rising industrial wastewater challenges. Regionally, North America led the market with a 34.2% share in 2024, supported by stringent regulations and strong industrial adoption, while Asia-Pacific and Europe followed with expanding desalination and industrial wastewater treatment initiatives.
Market Insights
- Brine Concentration Technology Market size reached USD 16.18 Billion in 2024 and will grow at a CAGR of 5.2% through 2032.
- Market growth is driven by rising ZLD adoption across power, mining, and chemical industries, along with expanding desalination capacity in water-stressed regions.
- A key trend includes increasing use of hybrid membrane–thermal systems, with Mechanical Vapor Compression holding a 46.2% share and gaining traction for high-efficiency brine reduction.
- Major players such as Saltworks Technologies, Aquatech International LLC, Samco Technologies, and Veolia Water Technologies advance system innovation and expand project deployments across industrial markets.
- Regionally, North America led with a 34.2% share, followed by Asia-Pacific at 28.9% and Europe at 26.7%, while Calcium Chloride remained the dominant type segment with a 38.6% share in 2024.
Access crucial information at unmatched prices!
Request your sample report today & start making informed decisions powered by Credence Research Inc.!
Download Sample
Market Segmentation Analysis
By Type
Calcium Chloride led the Brine Concentration Technology Market in 2024 with a 38.6% share, driven by its extensive use in industrial wastewater treatment, de-icing operations, and enhanced oil recovery applications that require high-strength brine formulations. Sodium Chloride accounted for 31.4% due to its widespread availability and adoption in desalination brine management. Zinc Calcium Bromide held 18.7% as it remains essential in high-density drilling fluids, while Cesium Formate captured 11.3%, supported by its premium performance in specialized offshore drilling operations demanding environmentally safe high-density brines.
- For instance, Saltworks Technologies reported continued deployment of its BRINEX™ systems in 2023-2024 to treat high-TDS calcium-rich brines in mining and industrial operations.
By Technology
Mechanical Vapor Compression (MVC) dominated the market with a 46.2% share, propelled by rising demand for high-efficiency zero-liquid-discharge (ZLD) systems across power generation, mining, and chemical industries. High-Energy Reverse Osmosis accounted for 33.5%, driven by its energy efficiency and increasing adoption for brine minimization in desalination plants. Vertical Tube Falling Film technology held 20.3%, supported by its strong suitability for high-scaling brines and heavy industrial effluents, particularly in regions emphasizing strict discharge regulations and recovery-based wastewater treatment strategies.
- For instance, Aquatech International continued integrating falling-film evaporators and other advanced thermal technologies into its Zero Liquid Discharge (ZLD) solutions in 2024 to support strict industrial discharge compliance.
Key Growth Drivers
Rising Adoption of Zero-Liquid-Discharge (ZLD) Systems
The Brine Concentration Technology Market grows significantly as industries increasingly adopt zero-liquid-discharge solutions to meet stringent wastewater disposal regulations. Power plants, mining operations, and chemical manufacturers rely on advanced brine concentration technologies to minimize effluent volumes and achieve compliance. ZLD requirements drive investment in high-efficiency systems such as mechanical vapor compression (MVC) and high-energy reverse osmosis, supporting sustainable water management. Governments and environmental agencies worldwide continue tightening discharge norms, accelerating the demand for technologies that enhance water recovery while reducing ecological impact.
- For instance, IDE Technologies reported continued global adoption of its high-recovery RO platforms in 2024 as governments strengthened water-reuse targets and industrial discharge limits.
Expansion of Desalination Capacity Across Water-Stressed Regions
Global expansion of desalination infrastructure directly stimulates market growth as operators seek efficient brine management solutions to reduce environmental risks associated with hyper-saline discharges. The rapid adoption of large-scale desalination plants in the Middle East, North Africa, and Asia-Pacific boosts the need for high-performance brine concentration systems to optimize recovery ratios and limit marine impact. Integration of energy-efficient concentration technologies helps utilities lower operational costs, improve sustainability metrics, and support long-term freshwater supply strategies, reinforcing steady demand across municipal and industrial desalination networks.
- For instance, Veolia continued expanding its evaporative and membrane-based brine treatment installations in 2024 to support long-term water-security strategies across regional desalination networks.
Growing Demand from Oil & Gas and Mining Industries
Oil & gas and mining sectors increasingly depend on robust brine concentration technologies to manage high-TDS (total dissolved solids) wastewater generated from drilling, produced water treatment, and mineral extraction. Rising exploration activities and enhanced recovery processes require reliable systems capable of handling complex brines while ensuring regulatory compliance. Advancements in thermal and membrane-based technologies enable cost-effective onsite treatment, reducing transportation needs and environmental risks. Industries prioritize solutions that maximize water reuse and resource recovery, strengthening adoption across upstream and downstream applications.
Key Trends & Opportunities
Shift Toward Energy-Efficient and Hybrid Brine Concentration Systems
A major trend shaping the market is the transition toward low-energy and hybrid brine concentration technologies that integrate membrane and thermal processes. High-energy reverse osmosis, coupled with mechanical vapor compression, delivers lower operational costs and improved recovery rates. Growing focus on decarbonization encourages industries to replace energy-intensive evaporators with optimized systems powered by renewable sources. This shift creates strong opportunities for manufacturers developing modular, automated, and energy-adaptive brine concentration units that support sustainable operations across desalination, industrial wastewater treatment, and mining ecosystems.
- For instance, Aquatech International has successfully deployed its LoWatt® and High Efficiency RO platforms in multiple industrial ZLD projects to lower energy consumption while improving brine concentration performance.
Increasing Emphasis on Resource Recovery and Circular Water Economy
The market benefits from rising interest in recovering valuable salts, minerals, and chemicals from concentrated brines, aligning with the global circular economy movement. Technologies capable of extracting sodium chloride, magnesium, lithium, and high-value industrial chemicals present new revenue opportunities for end users. Advancements in crystallization, solvent extraction, and ion exchange processes enhance commercial viability. Industries seek solutions that transform waste brine into marketable products, lowering disposal costs and improving sustainability performance, positioning brine concentration technologies as enablers of integrated resource recovery strategies.
- For instance, Saltworks Technologies’ FusionRO system uses cascaded reverse osmosis and nanofiltration membranes to concentrate brine beyond 200,000 mg/L from sources like cooling tower blowdown, enabling up to 99% freshwater recovery and integration with scaling ion removal for further processing.
Key Challenges
High Capital and Operational Costs of Advanced Brine Concentration Technologies
Despite strong demand, high initial investment and energy-intensive operation remain major barriers to widespread adoption. Technologies such as MVC and falling-film evaporators require significant capital expenditure, making them less accessible for small and mid-sized industries. Additionally, operational costs related to energy consumption, maintenance, and periodic replacement of components elevate lifecycle expenses. Cost challenges limit deployment in regions lacking financial incentives or adequate funding, compelling manufacturers to innovate more affordable, energy-efficient systems that reduce total cost of ownership.
Management of Scaling, Fouling, and Complex Brine Compositions
Another major challenge is the treatment of brines containing complex mixtures of dissolved solids, organics, and scaling agents that hinder process efficiency. Scaling and fouling increase downtime, reduce equipment lifespan, and raise maintenance expenses. Harsh brine chemistries require advanced pre-treatment and robust materials of construction, which further elevate system costs. Industries operating in mining, textiles, and petrochemicals often confront variability in wastewater composition, making it difficult to standardize solutions. Overcoming these challenges demands continuous technological innovation and improved predictive monitoring mechanisms.
Regional Analysis
North America
North America held a 34.2% share of the Brine Concentration Technology Market in 2024, driven by strong adoption across power generation, oil & gas, and mining sectors requiring advanced brine minimization and ZLD solutions. The United States leads regional demand due to strict wastewater discharge regulations and widespread deployment of MVC and hybrid membrane-thermal systems. Growing investments in lithium extraction and produced-water treatment further accelerate technology uptake. Canada contributes steadily through its expanding industrial wastewater management programs, reinforcing the region’s focus on sustainability, resource recovery, and high-efficiency brine treatment operations.
Europe
Europe accounted for a 26.7% share owing to stringent EU environmental standards that mandate reduced brine discharge and improved water recovery across industrial facilities. Countries such as Germany, the Netherlands, and the United Kingdom actively invest in advanced concentration systems for chemical manufacturing, pharmaceuticals, and desalination support operations. The region benefits from accelerated integration of energy-efficient technologies aligned with decarbonization targets. Growth is further fuelled by rising adoption of circular economy practices, particularly resource recovery from brines containing salts and critical minerals, positioning Europe as a hub for sustainable brine treatment innovation.
Asia-Pacific
Asia-Pacific captured a 28.9% share, emerging as one of the fastest-growing regions due to extensive industrialization, large-scale desalination expansions, and increasing water scarcity. China, India, and Australia lead demand as industries prioritize ZLD adoption in textiles, power generation, mining, and chemicals. Government-backed environmental reforms encourage investment in advanced brine concentration technologies that support higher recovery rates and reduced environmental discharge. Rapid infrastructure development, growing energy needs, and the region’s focus on sustainability amplify market expansion, with rising opportunities in lithium brine processing and industrial effluent management.
Latin America
Latin America held a 6.4% share, supported by increasing investment in mining, particularly in Chile and Brazil, where high-TDS wastewater management drives adoption of robust concentration systems. Rising demand for resource recovery, especially lithium and industrial salts, strengthens the need for efficient brine handling technologies. Regional desalination projects in coastal areas also contribute to market growth as governments address water shortages. Though adoption levels vary across countries, industrial modernization and environmental regulations progressively encourage deployment of membrane and thermal concentration technologies throughout the region.
Middle East & Africa
The Middle East & Africa region accounted for a 3.8% share, primarily driven by its rapidly expanding desalination sector, which requires advanced solutions to manage hypersaline brine streams. Saudi Arabia, the UAE, and Israel lead demand as utilities invest in technologies that improve recovery rates and reduce marine discharge impact. Mining operations in Africa, especially in South Africa and Namibia, also support market growth through increased need for high-efficiency brine management. The region’s strategic push toward sustainable water infrastructure and energy-optimized concentration systems continues to unlock long-term development potential.
Market Segmentations
By Type
- Calcium Chloride
- Sodium Chloride
- Zinc Calcium Bromide
- Cesium Formate
By Technology
- High-Energy Reverse Osmosis
- Vertical Tube Falling Film
- Mechanical Vapor Compression
By Geography
- North America
- Europe
- Germany
- France
- U.K.
- Italy
- Spain
- Rest of Europe
- Asia Pacific
- China
- Japan
- India
- South Korea
- South-east Asia
- Rest of Asia Pacific
- Latin America
- Brazil
- Argentina
- Rest of Latin America
- Middle East & Africa
- GCC Countries
- South Africa
- Rest of the Middle East and Africa
Competitive Landscape
The competitive landscape of the Brine Concentration Technology Market features key players such as Saltworks Technologies, Aquatech International LLC, Samco Technologies, Koch Separation Solutions, Gradient, IDE Technologies, Aquachem, Evoqua Water Technologies, H2O Innovations, and Veolia Water Technologies driving innovation and market expansion. These companies actively enhance their technology portfolios with advanced membrane systems, mechanical vapor compression units, and hybrid ZLD solutions to address rising industrial and municipal wastewater challenges. Strategic initiatives such as technology collaborations, R&D investments, and large-scale project deployments strengthen their market presence. Leading players focus on improving energy efficiency, reducing operational costs, and supporting resource recovery applications, aligning with the global shift toward sustainable water management. With increasing demand across desalination, power generation, mining, and oil & gas industries, companies expand their geographic footprint and customize solutions to meet diverse industrial requirements, reinforcing a dynamic and innovation-driven market environment.
Shape Your Report to Specific Countries or Regions & Enjoy 30% Off!
Key Player Analysis
Recent Developments
- In December 2025, LibertyStream Infrastructure Partners announced commencement of lithium carbonate production from produced oilfield brine in Reeves County, Texas, using its newly commissioned continuous-flow refining unit a milestone for brine-based lithium recovery & concentration.
- In March 2023, Aquatech and Fluid Technology Solutions (FTS) announced a strategic partnership to deliver next-generation advanced separation, brine concentration and water-reuse solutions.
Report Coverage
The research report offers an in-depth analysis based on Type, Technology and Geography. It details leading market players, providing an overview of their business, product offerings, investments, revenue streams, and key applications. Additionally, the report includes insights into the competitive environment, SWOT analysis, current market trends, as well as the primary drivers and constraints. Furthermore, it discusses various factors that have driven market expansion in recent years. The report also explores market dynamics, regulatory scenarios, and technological advancements that are shaping the industry. It assesses the impact of external factors and global economic changes on market growth. Lastly, it provides strategic recommendations for new entrants and established companies to navigate the complexities of the market.
Future Outlook
- The market will experience steady adoption as industries intensify their shift toward zero-liquid-discharge compliance.
- Demand for hybrid membrane–thermal systems will grow as end users prioritize energy-efficient brine management.
- Desalination operators will increasingly invest in high-recovery brine concentration technologies to reduce environmental discharge.
- Mining and lithium extraction sectors will expand their use of advanced systems to support resource recovery initiatives.
- Adoption of automated and digital monitoring technologies will enhance process reliability and operational efficiency.
- Manufacturers will focus on developing modular, compact systems suitable for decentralized industrial installations.
- Growth in renewable-powered concentration technologies will strengthen sustainability-driven investments.
- Oil & gas operators will accelerate upgrades to treat complex produced-water brines more efficiently.
- Regional markets in Asia-Pacific and the Middle East will lead expansion due to rising industrialization and water scarcity.
- Advancements in corrosion-resistant materials and anti-scaling solutions will support long-term operational performance.


