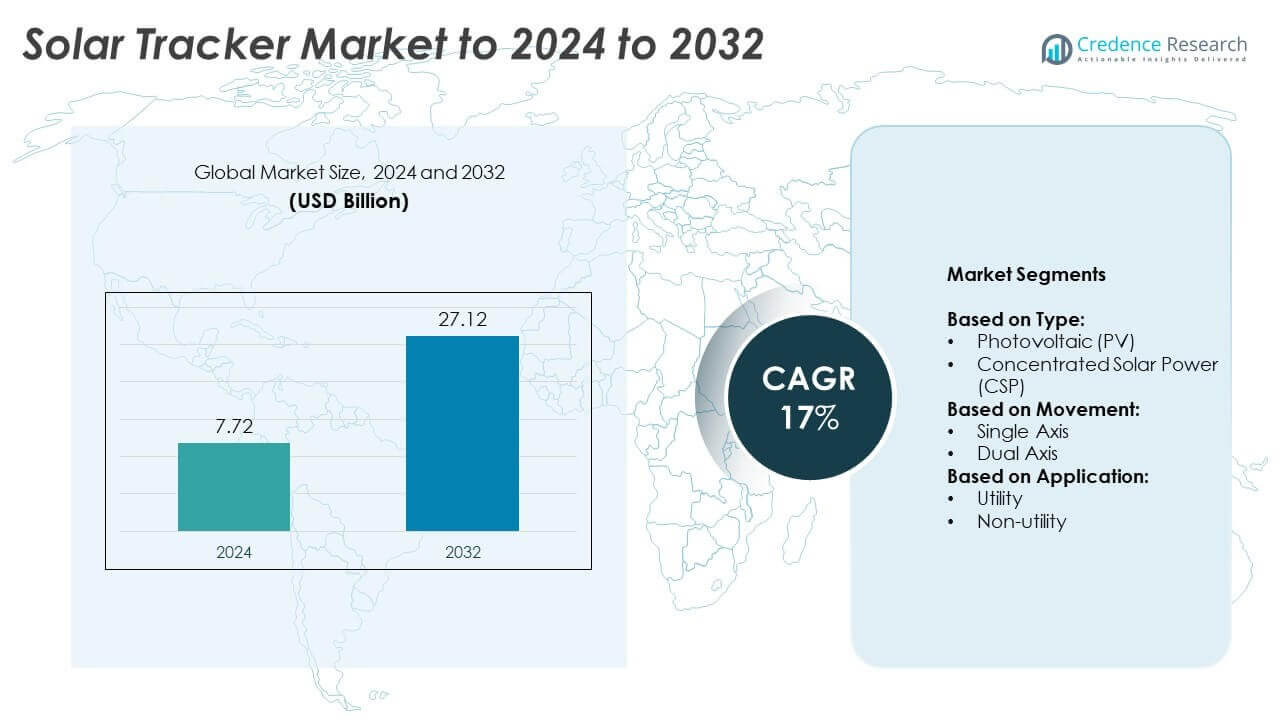
Home » Energy » Energy Utilities » Solar Tracker Market

Solar Tracker Market

Solar Tracker Market By Type of Solar Tracker: (Single Axis Solar Trackers, Horizontal Single Axis Trackers (HSAT), Vertical Single Axis Trackers (VSAT), Dual Axis Solar Trackers) By Tracking Technology: (Active Solar Trackers, Passive Solar Trackers) By Application: (Utility-scale Solar Power Plants, Commercial and Industrial (C&I) Solar Installations, Residential Solar Installations, Concentrated Solar Power (CSP) Plants) – Growth, Future Prospects & Competitive Analysis, 2024 – 2032

Price: $4699

Published: | Report ID: 10534 | Report Format : Excel, PDF
REPORT ATTRIBUTE DETAILS
Historical Period 2019-2022
Base Year 2023
Forecast Period 2024-2032
Solar Tracker Market Size 2023 USD 7152.2 Million
Solar Tracker Market, CAGR 14.50%
Solar Tracker Market Size 2032 USD 24192.96 Million

Market Insights

  • The Solar Tracker Market attained a valuation of USD 7152.2 Million in 2023 and is anticipated to escalate to USD 24192.96 Million by 2032, exhibiting a robust CAGR of 14.50% during the forecast period from 2024 to 2032.
  • Among the key segments, Single Axis solar trackers emerged as the market leader by type, constituting approximately 40-43% of the total market share in 2023. However, Dual Axis Solar Trackers are projected to witness the highest CAGR during the forecast period.
  • Utility-scale Solar Power Plants currently hold the largest market share approx. 50-55% in 2023 owing to economies of scale, government subsidies, and investor preferences toward utility-scale projects. Concentrated Solar Power (CSP) Plants are projected to witness the highest CAGR during the forecast period owing to their thermal storage capabilities.
  • Active Solar Trackers currently hold the largest market share approx. 50-60% in 2023 due to their accuracy in solar tracking. Passive Solar Trackers are projected to witness the highest CAGR during the forecast period.
  • Asia Pacific held the largest share around 38-42% of the market in 2023. North America and Europe collectively account for just under 55% share in 2023.
  • The rising demand for clean energy, technological advancements, and electrification and decentralization initiatives are also contributing to the market growth.
  • Key opportunities in the market include continued advances in material science, IoT integration, data analytics, and artificial intelligence, as well as innovations in dual-axis and distributed tracking systems. Strategic partnerships, collaborations among market players, and investments in R&D can further boost market expansion.

Executive Summary

Market Definition

A solar tracker is a technological system that allows solar devices to track the sun throughout the day, maximize solar radiation, and increase their energy consumption.  The solar tracker market is characterized by the industry they participate in the design, construction, installation, and maintenance of these systems. Solar trackers are commonly used in large solar panels but are becoming increasingly popular in residential and commercial areas as well. They come in a variety of formats, such as single- and double-sided tracers, which vary depending on the number of arrows they can pass through. Single-axis trackers rotate along a single axis, while dual-axis trackers can follow two axes, allowing greater flexibility following the movement of the sun. The solar tracker market has been growing rapidly due to several factors, such as increasing demand for renewable energy, government encouragement and policies that promote clean energy, and technological advances that make solar experiments affordable and create jobs.

Design Element 2

Access crucial information at unmatched prices!

Request your sample report today & start making informed decisions powered by Credence Research!

Download Sample

CTA Design Element 3

Market Overview

The Solar Tracker Market has exhibited substantial growth and is anticipated to maintain a robust Compound Annual Growth Rate (CAGR) of 14.50% from 2024 to 2032. Valued at USD 7152.2 million in 2023, this market is forecasted to reach USD 24192.96 million by 2032.

Among the primary segments, Single Axis solar trackers dominated the market landscape by type, comprising approximately 40-43% of the total market share in 2023. However, Dual Axis Solar Trackers are expected to observe the highest CAGR over the forecast period.

Utility-scale Solar Power Plants currently hold the largest market share approx 50-55% in 2023, driven by economies of scale, government subsidies, and investor preferences towards large-scale projects. Concentrated Solar Power (CSP) Plants are projected to witness the highest CAGR during the forecast period owing to their thermal storage capabilities.

Active Solar Trackers currently hold the largest market share approx 50-60% in 2023, driven by their accuracy in solar tracking. Passive Solar Trackers are projected to witness the highest CAGR during the forecast period.

Asia Pacific constituted a significant portion of the market in 2023, followed by North America and Europe, collectively representing just under 55% of the market share.

The surge in demand for clean energy, driven by factors such as increasing government support, technological advancements, and the transition to renewable energy sources, fosters market growth, especially in regions like Asia Pacific.

Rapid advancement in Solar Tracker technology, including the adoption of IoT integration and data analytics, is driving market demand, especially in regions like Asia Pacific where the growth of the Solar Tracker industry is significant.

Segmentation by Type of Solar Tracker

  • Single Axis solar trackers currently hold the largest market share approx. 40-43% in 2023. This can be attributed to its simplicity, lower cost compared to dual-axis trackers, and better performance than fixed-tilt systems.
  • Dual Axis Solar Trackers are projected to witness the highest CAGR during the forecast period due to the increasing demand for high power consumption and performance which is advanced. Dual-axis trackers better align with the position of the sun during the day, maximizing energy production.

Segmentation by Application

  • Utility-scale Solar Power Plants currently hold the largest market share approx. 50-55% in 2023 owing to economies of scale, government subsidies, and investor preferences towards utility-scale projects.
  • Concentrated Solar Power (CSP) Plants are projected to witness the highest CAGR during the forecast period owing to their thermal storage capabilities.

Segmentation by Tracking Technology

  • Active Solar Trackers currently hold the largest market share approx. 50-60% in 2023 due to their accuracy in solar tracking. Active solar trackers are used to change the orientation of the solar panels based on real-time data collected through sensors or GPS systems that drive the market.
  • Passive Solar Trackers are projected to witness the highest CAGR during the forecast period. Passive solar systems rely on natural processes rather than electronic controls or mechanical parts, they experience fewer malfunctions and breakdowns.

Segmentation by Region

  • Asia Pacific held largest share around 38-42% of the market in 2023. The presence of advanced technologies, China’s dominant presence as a key player in solar PV manufacturing and installation activities. Other emerging markets such as India, Japan, South Korea, Australia, etc. continue to encourage market growth.
  • North America and Europe collectively account for just under 55% share in 2023, with North America holding over 20% share in the same year.
  • The rest of the world, including Latin America, the Middle East, and Africa, supplies the remaining demand for solar tracker.

Rising demand for clean energy, technological advancements, and electrification and decentralization initiatives are also contributing to the market growth.

The Asia Pacific region holds the largest market share in the Solar Tracker market owing to countries such as China, India, Japan and South Korea’s contribute in the market. This growth can be attributed to several factors, such as increased government support for energy a renewable services, falling photovoltaic (PV) costs ) systems, and a growing demand for clean and sustainable energy sources. China is one of the primary drivers of this growth, as it has been actively promoting the use of renewable energy through various policies and incentives. For instance, China’s 14th Five-Year Plan (FYP) for Renewable Energy Development (FYP) aims to significantly expand renewable energy production to 3.3 billion kilowatt-hours by 2025, up from 2.2 billion kilowatt-hours by 2020. It set a target of 33% renewable It accounts for half of electricity consumption through 2025 and mandates that half of China’s new electricity consumption must come from renewable sources before 2021-2025. This initiative reinforces China’s commitment to transition to a low-carbon economy. Furthermore, The Indian government has also implemented policies aimed at increasing the adoption of renewable energy, such as subsidies and tax credits for solar projects. For instance, Phase II of the rooftop solar scheme launched by MNRE by the end of 2022 provides Central Financial Assistance (CFA) for residential installation of RTS, which is transferred through the Direct Benefit Transfer (DBT) scheme. Other incentives include country-specific net metering rules that enable debt collection, which have been accelerated for businesses, capital subsidies for educational institutions, public sector buildings & healthcare, and lower GST on solar panels all contribute to lower costs and greater economic interest.

North America holds a significant market share of the global solar tracker market due to favorable government policies, falling solar module costs, and an increased emphasis on sustainable renewable energy The United States and Canada are two major contributors to this regional growth. The U.S. federal government supports renewable energy development through the Investment Tax Credit (ITC) for solar projects, which provides a 26% income tax rate for pre-established commercial solar projects by 2023. In addition, many states offer additional incentives, such as rebate programs, property tax exemptions, and service fees, which limit solar monitoring the treatments are more attractive. Furthermore, in April 2022, the Biden-Harris Administration announced that the U.S. Environmental Protection Agency (EPA) has selected 60 applicants to receive $7 billion in grants through the Solar for All program. Canada is also witnessing significant growth in the solar tracker market due to supportive policies and falling costs. County governments offer a variety of incentives, including food stamps, production-based incentives, and residential housing discounts. For instance, in Canada Greener Homes Grant, the federal government currently offers Canadian homeowners a grant of $1.00 per watt for the purchase of a solar voltaic system, up to a total of $5,000. Such features encourage the widespread use of solar monitoring devices at various scales and applications further boosting the market growth.

Solar Tracker Market

Key Highlights of the Report

The Solar Tracker Market is segmented by Type, Application, Tracking Technology, and Region. The growing demand for solar trackers is propelled by factors such as increasing government support for renewable energy, technological advancements, and the transition to sustainable energy sources, particularly in utility-scale solar power plants, concentrated solar power (CSP) plants, and residential installations.

Single Axis solar trackers dominate the segment, offering cost-effective solutions suitable for various solar energy projects. Utility-scale Solar Power Plants hold a significant market share, driven by economies of scale and government incentives for large-scale solar projects.

Dual Axis Solar Trackers are projected to witness the highest CAGR during the forecast period, offering advanced tracking capabilities and maximizing energy production.

Asia Pacific held the largest share of the solar tracker market, supported by countries like China, India, and Japan with significant investments in renewable energy infrastructure. Government initiatives and partnerships with solar panel manufacturers also contribute to the region’s dominance in the market.

Key players like NEXTracker, Array Technologies, and Trina Solar compete in the market, focusing on product innovation, partnerships, and technological advancements to maintain competitiveness. Collaborations and advancements in tracking technology contribute to Asia Pacific’s leadership in the Solar Tracker Market, with major players expanding their offerings to meet diverse customer needs in the region.

What Are The Main Drivers Of The Global Solar Tracker Market?

The global Solar Tracker market is driven by various factors such as increasing demand for renewable energy and a push towards achieving sustainability goals. Technological advances, such as more efficient and reliable solar tracking systems, also contribute significantly. Moreover, favorable government policies and incentives aimed at promoting the use of solar panels play an important role in market growth. Additionally, the cost of solar photovoltaic power systems is decreasing, and the need to increase efficiency is driving the demand for solar analytics to further drive the market.

What Are The Major Challenges Faced By The Global Solar Tracker Market?

The global solar tracker market is mainly challenged including high initial investment costs associated with installation and maintenance. Variable weather conditions can affect tracker performance, reducing performance. Moreover, supply disruptions and material shortages can affect construction and project timelines also hinder market growth.

What Are The Growth Opportunities In The Global Solar Tracker Market?

The global Solar Tracker market presents numerous growth opportunities including continued advances in material science, IoT integration, data analytics, and artificial intelligence pave the way for improved production efficiency, operational quality, and maintenance practices. Moreover, innovations in dual-axis and distributed tracking systems unlock potential in niche applications such as urban solar installations. Also, strategic partnerships, collaborations among market players, and investments in R&D can boost the market.

Market Drivers

Increasing demand for renewable energy

The global Solar Tracker market has significant growth, driven by increasing demand for renewable energy. As countries and businesses prioritize sustainability, solar backplanes are emerging as a key to optimizing solar energy production. The ability to actively direct the sun with solar panels maximizes energy capture, improving overall system efficiency. These increased applications, coupled with cost reductions and technological advances, make solar monitoring more attractive for solar project users. For instance, according to NEA, China’s solar power capacity jumped 55% in 2023 to exceed 609 GW, while wind power reached 441 GW following a 21% rise. Total installed capacity grew nearly 14% to approximately 2,920 GW. Aided by the Five-Year Plan (2020), China seeks to attain peak emissions by 2030 and carbon neutrality by 2060, targeting 1,200 GW of renewable capacity by 2030. Due to the adoption of renewable energy acceleration worldwide, the solar tracking market is poised for continued expansion, and clean sustainable energy plays a key role in facilitating the transition to the future.

Market Restraints

High initial investment costs associated with installation and maintenance

High initial investment costs associated with installation and maintenance restrained the demand of solar tracker market. Compared to fixed-tilt solar panel systems, solar trackers typically involve greater expenses in terms of hardware purchases, government work, labor, communications, and interconnection. For instance, the cost of solar panels can range anywhere from $8,500 to $30,500, with the average cost of a 6kW solar system being around $12,700. Ongoing maintenance such as periodic inspection, cleaning and replacement of parts makes the overall lifetime expense burden.

Opportunities

Adoption of various strategies among market players

The adoption of various strategies among market players creates significant opportunities for the market. The major companies serving the global solar tracker market are NEXTracker (U.S.), Array Technologies (U.S.), Trina Solar (China), SunPower Corporation (U.S.), ArcelorMittal Projects (Luxembourg), Soltec (Spain), among others. The market players are considerably contributing to the market growth by the adoption of various strategies including mergers & acquisitions, collaborations, funding, and new product launches, to stay competitive in the market. For instance, in April 2024, Nextracker launched its NX Horizon solar tracker system boasting up to 35% lower carbon footprint, achieved through electric arc furnace (EAF) manufacturing, recycled steel utilization, and strategic logistic placement close to project locations. This announcement highlights Nextracker’s dedication to delivering eco-friendly solar energy solutions.

Competitive Landscape

Key Players

The global Solar Tracker market is highly competitive, with several key players. Some of the major players in the market and their market share are as follows:

  • NEXTracker (U.S.)
  • Array Technologies (U.S.)
  • Trina Solar (China)
  • SunPower Corporation (U.S.)
  • ArcelorMittal Projects (Luxembourg)
  • Soltec (Spain)
  • Convert Italia (Italy)
  • PV Hardware (Spain)
  • Arctech Solar (U.S.)
  • Solar Steel (Spain)
  • Ideematec (Germany)
  • SunPower (U.S.)
  • Scorpius Trackers (India)
  • Sun Action Trackers (U.S.)
  • Others

These organizations prioritize product innovation, distribution channel expansion, and mergers and acquisitions to stay competitive.

The global Solar Tracker market’s key players continually seek to stay ahead by offering new products and developments.

In February 2024, Array Technologies launched dual-row solar tracker featuring precision, efficiency, and flexibility through a novel driveline motion transmission system, solidifying Array’s standing as a global leader in utility-scale solar tracking solutions.

In May 2023, Trina Solar launched its new-gen 210mm n-type series, p-type Vertex 670W, TrinaTracker Vanguard 2P, and energy storage systems, emphasizing its dedication to pioneering smart energy solutions for a net-zero future. Products exhibit exceptional technical proficiency, aligning with industry trends.

Summary of Key Findings

  • The Solar Tracker Market is experiencing substantial growth driven by increasing demand for renewable energy across various sectors such as utility-scale solar power plants, concentrated solar power (CSP) plants, and residential installations. This growth is fueled by factors like government support, technological advancements, and the global transition to sustainable energy sources.
  • Market segmentation encompasses various factors including type, application, tracking technology, and region, reflecting the diverse requirements and preferences within the solar tracker industry.
  • Single Axis solar trackers emerge as the dominant segment, offering cost-effective solutions suitable for different solar energy projects. Dual Axis Solar Trackers are expected to witness the highest growth, driven by their advanced tracking capabilities and increased energy production efficiency.
  • Asia Pacific holds the largest share of the market, driven by countries like China, India, and Japan investing significantly in renewable energy infrastructure. Major players like NEXTracker, Array Technologies, and Trina Solar are competing in the market, focusing on innovation and technological advancements to maintain competitiveness.

Future Outlook

  • The Solar Tracker Market presents promising growth opportunities, particularly in regions like Asia Pacific where government initiatives and partnerships with solar panel manufacturers drive demand. Anticipated challenges include supply chain disruptions and competition from alternative energy sources. To address these challenges, industry players should focus on innovation, cost-effectiveness, and efficiency improvement.
  • Strategies for maintaining competitiveness include continuous research and development, strategic partnerships, and expanding product offerings to meet evolving market demands and sustain growth in the dynamic Solar Tracker Market.

How CXOs Can Benefit from the Credence Research Solar Tracker Networks Market Report

The Credence Research Solar Tracker Networks Market Report provides CXOs with a comprehensive overview of the market, including:

  • Market size and growth forecast: The report provides detailed estimates of the global Solar Tracker networks market size, segmented by type, application, tracking technology, and region. It also includes forecasts for the market through 2032, based on key trends and drivers.
  • Market segmentation: The report segments the Solar Tracker networks market by type, application, tracking technology, and region. The increasing demand for advanced solutions is driven. This segmentation provides CXOs with a granular understanding of the market and the opportunities in each segment.
  • Competitive landscape: The report profiles the key players in the Solar Tracker networks market and provides insights into their strategies, product offerings, and financial performance. This information can help CXOs to identify and assess their competition.
  • Key trends and drivers: The report identifies and analyzes the key trends and drivers that are shaping the Solar Tracker networks market. This information can help CXOs to make informed decisions about their investments and strategies.

CXOs can use the insights from the Credence Research Solar Tracker Networks Market Report to:

  • Identify growth opportunities: The report can help CXOs to identify new growth opportunities in the Solar Tracker networks market. For example, the report identifies the growing demand for Solar Tracker networks from cloud computing providers and telecom companies as a key opportunity.
  • Make informed investment decisions: The report can help CXOs to make informed investment decisions about Solar Tracker networks. For example, the report provides insights into the key factors to consider when evaluating Solar Tracker providers and selecting Solar Tracker solutions.
  • Develop competitive strategies: The report can help CXOs to develop competitive strategies for their Solar Tracker networks businesses. For example, the report identifies the key strategies that Solar Tracker providers are using to differentiate themselves from their competitors.
  • Track market developments: The report can help CXOs to track market developments and stay ahead of the curve. For example, the report provides insights into the latest trends and innovations in the Solar Tracker networks market.

Overall, the Credence Research Solar Tracker Networks Market Report is a valuable resource for CXOs who are looking to gain a deeper understanding of the market and identify opportunities for growth.

Shape Your Report to Specific Countries or Regions & Enjoy 30% Off!

Segmentation

  • By Type of Solar Tracker:

    • Single Axis Solar Trackers
    • Horizontal Single Axis Trackers (HSAT)
    • Vertical Single Axis Trackers (VSAT)
    • Dual Axis Solar Trackers
  • By Tracking Technology:

    • Active Solar Trackers
    • Passive Solar Trackers
  • By Application:

    • Utility-scale Solar Power Plants
    • Commercial and Industrial (C&I) Solar Installations
    • Residential Solar Installations
    • Concentrated Solar Power (CSP) Plants
  • By Region

    • North America
      • US
      • Canada
      • Mexico
    • Europe
      • Germany
      • France
      • UK.
      • Italy
      • Spain
      • Rest of Europe
    • Asia Pacific
      • China
      • Japan
      • India
      • South Korea
      • South-east Asia
      • Rest of Asia Pacific
    • Latin America
      • Brazil
      • Argentina
      • Rest of Latin America
    • Middle East & Africa
      • GCC Countries
      • South Africa
      • Rest of Middle East and Africa

Adjacent Markets

In the Solar Tracker market, there are several adjacent markets which has high revenue growth opportunities. The key adjacent markets for Solar Tracker market –

                                                        Adjacent Markets

Solar Panel Manufacturing IoT in Energy Electric Vehicle Charging Infrastructure
Renewable Energy Storage Solar Inverter Market Green Building Technologies
Smart Grid Technologies Energy Management Systems Solar Farm Development

1. Preface

1.1. Report Description

1.1.1. Purpose of the Report

1.1.2. Target Audience

1.1.3. USP and Key Offerings

1.2. Research Scope

1.3. Market Introduction

2. Executive Summary

2.1. Market Snapshot: Global Solar Tracker Market

2.1.1. Global Solar Tracker Market, By Type of Solar Tracker

2.1.2. Global Solar Tracker Market, By Application

2.1.3. Global Solar Tracker Market, By Tracking Technology

2.1.4. Global Solar Tracker Market, By Region

2.2. Insights from Primary Respondents

3. Market Dynamics & Factors Analysis

3.1. Introduction

3.1.1. Global Solar Tracker Market Value, 2019-2032, (US$ Mn)

3.1.2. Y-o-Y Growth Trend Analysis

3.2. Market Dynamics

3.2.1. Wired  Drivers

3.2.2. Solar Tracker Market Restraints

3.2.3. Solar Tracker Market Opportunities

3.2.4. Major Solar Tracker Industry Challenges

3.3. Growth and Development Patterns

3.4. Investment Feasibility Analysis

3.5. Market Opportunity Analysis

3.5.1. Type of Solar Tracker

3.5.2. Application

3.5.3. Tracking Technology

3.5.4. Geography

4. Market Competitive Landscape Analysis

4.1. Company Market Share Analysis, 2023

4.1.1. Global Solar Tracker Market: Company Market Share, Value 2023

4.1.2. Global Solar Tracker Market: Top 6 Company Market Share, Value 2023

4.1.3. Global Solar Tracker Market: Top 3 Company Market Share, Value 2023

4.2. Global Solar Tracker Market: Company Revenue Share Analysis, 2023

4.3. Company Assessment Metrics, 2023

4.3.1. Stars

4.3.2. Emerging Leaders

4.3.3. Pervasive Players

4.3.4. Participants

4.4. Startups/ SMEs Assessment Metrics, 2023

4.4.1. Progressive Companies

4.4.2. Responsive Companies

4.4.3. Dynamic Companies

4.4.4. Starting Blocks

4.5. Strategic Development

4.5.1. Acquisition and Mergers

4.5.2. New Product Launch

4.5.3. Regional Expansion

4.5.4. Partnerships

4.6. Key Player Product Matrix

4.7. Potential for New Players in the Global Solar Tracker Market

5. Premium Insights

5.1. STAR (Situation, Task, Action, Results) Analysis

5.2. Porter’s Five Forces Analysis

5.2.1. Threat of New Entrants

5.2.2. Bargaining Power of Buyers/Consumers

5.2.3. Bargaining Power of Suppliers

5.2.4. Threat of Substitute Types

5.2.5. Intensity of Competitive Rivalry

5.3. PESTEL Analysis

5.3.1. Political Factors

5.3.2. Economic Factors

5.3.3. Social Factors

5.3.4. Technological Factors

5.3.5. Environmental Factors

5.3.6. Legal Factors

5.4. Key Market Trends

5.4.1. Demand Side Trends

5.4.2. Supply Side Trends

5.5. Value Chain Analysis

5.6. Technology Analysis

5.6.1. Research and development in the global market

5.6.2. Patent Analysis

5.6.3. Emerging technologies and their potential disruption to the market

5.7. Consumer Behaviour Analysis

5.7.1. Consumer Preferences and Expectations

5.7.2. Factors Influencing Consumer Buying Decisions

5.7.2.1. North America

5.7.2.2. Europe

5.7.2.3. Asia Pacific

5.7.2.4. Latin America

5.7.2.5. Middle East and Africa

5.7.3. Consumer Pain Points

5.8. Analysis and Recommendations

5.9. Adjacent Market Analysis

6. Market Positioning of Key Players, 2023

6.1. Company market share of key players, 2023

6.2. Competitive Benchmarking

6.3. Market Positioning of Key Vendors

6.4. Geographical Presence Analysis

6.5. Major Strategies Adopted by Key Players

6.5.1. Key Strategies Analysis

6.5.2. Mergers and Acquisitions

6.5.3. Partnerships

6.5.4. Product Launch

6.5.5. Geographical Expansion

6.5.6. Others

7. Impact Analysis of COVID 19 and Russia – Ukraine War on Solar Tracker Market

7.1. Ukraine-Russia War Impact

7.1.1. Uncertainty and Economic Instability

7.1.2. Supply chain disruptions

7.1.3. Regional market shifts

7.1.4. Shift in government priorities

7.2. COVID-19 Impact Analysis

7.2.1. Supply Chain Disruptions

7.2.2. Demand Fluctuations

7.2.3. Shift in Product Mix

7.2.4. Reduced Industrial Activity

7.2.5. Regional Impact Analysis

7.2.5.1. North America

7.2.5.2. Europe

7.2.5.3. Asia Pacific

7.2.5.4. Latin America

7.2.5.5. Middle East and Africa

8. Global Solar Tracker Market, By Type of Solar Tracker

8.1. Global Solar Tracker Market Overview, by Type of Solar Tracker

8.1.1. Global Solar Tracker Market Revenue Share, By Type of Solar Tracker, 2023 Vs 2032 (in %)

8.2. Single Axis Solar Trackers

8.2.1. Global Solar Tracker Market, By Single Axis Solar Trackers, By Region, 2019-2032(US$ Mn)

8.2.2. Market Dynamics for Single Axis Solar Trackers

8.2.2.1. Drivers

8.2.2.2. Restraints

8.2.2.3. Opportunities

8.2.2.4. Trends

8.3. Horizontal Single Axis Trackers (HSAT)

8.3.1. Global Solar Tracker Market, By Horizontal Single Axis Trackers (HSAT), By Region, 2019-2032 (US$ Mn)

8.3.2. Market Dynamics for Horizontal Single Axis Trackers (HSAT)

8.3.2.1. Drivers

8.3.2.2. Restraints

8.3.2.3. Opportunities

8.3.2.4. Trends

8.4. Vertical Single Axis Trackers (VSAT)

8.4.1. Global Solar Tracker Market, By Vertical Single Axis Trackers (VSAT), By Region, 2019-2032 (US$ Mn)

8.4.2. Market Dynamics for Vertical Single Axis Trackers (VSAT)

8.4.2.1. Drivers

8.4.2.2. Restraints

8.4.2.3. Opportunities

8.4.2.4. Trends

8.5. Dual Axis Solar Trackers

8.5.1. Global Solar Tracker Market, By Dual Axis Solar Trackers, By Region, 2019-2032 (US$ Mn)

8.5.2. Market Dynamics for Dual Axis Solar Trackers

8.5.2.1. Drivers

8.5.2.2. Restraints

8.5.2.3. Opportunities

8.5.2.4. Trends

9. Global Solar Tracker Market, By Application

9.1. Global Solar Tracker Market Overview, by Application

9.1.1. Global Solar Tracker Market Revenue Share, By Application, 2023 Vs 2032 (in %)

9.2. Utility-scale Solar Power Plants

9.2.1. Global Solar Tracker Market, By Utility-scale Solar Power Plants, By Region, 2019-2032 (US$ Mn)

9.2.2. Market Dynamics for Utility-scale Solar Power Plants

9.2.2.1. Drivers

9.2.2.2. Restraints

9.2.2.3. Opportunities

9.2.2.4. Trends

9.3. Commercial and Industrial (C&I) Solar Installations

9.3.1. Global Solar Tracker Market, By Commercial and Industrial (C&I) Solar Installations, By Region, 2019-2032 (US$ Mn)

9.3.2. Market Dynamics for Commercial and Industrial (C&I) Solar Installations

9.3.2.1. Drivers

9.3.2.2. Restraints

9.3.2.3. Opportunities

9.3.2.4. Trends

9.4. Residential Solar Installations

9.4.1. Global Solar Tracker Market, By Residential Solar Installations, By Region, 2019-2032 (US$ Mn)

9.4.2. Market Dynamics for Residential Solar Installations

9.4.2.1. Drivers

9.4.2.2. Restraints

9.4.2.3. Opportunities

9.4.2.4. Trends

9.5. Concentrated Solar Power (CSP) Plants

9.5.1. Global Solar Tracker Market, By Concentrated Solar Power (CSP) Plants, By Region, 2019-2032 (US$ Mn)

9.5.2. Market Dynamics for Concentrated Solar Power (CSP) Plants

9.5.2.1. Drivers

9.5.2.2. Restraints

9.5.2.3. Opportunities

9.5.2.4. Trends

10. Global Solar Tracker Market, By Tracking Technology

10.1. Global Solar Tracker Market Overview, by Tracking Technology

10.1.1. Global Solar Tracker Market Revenue Share, By Tracking Technology, 2023 Vs 2032 (in %)

10.2. Active Solar Trackers

10.2.1. Global Solar Tracker Market, By Active Solar Trackers, By Region, 2019-2032 (US$ Mn)

10.2.2. Market Dynamics for Active Solar Trackers

10.2.2.1. Drivers

10.2.2.2. Restraints

10.2.2.3. Opportunities

10.2.2.4. Trends

10.3. Passive Solar Trackers

10.3.1. Global Solar Tracker Market, By Passive Solar Trackers, By Region, 2019-2032 (US$ Mn)

10.3.2. Market Dynamics for Passive Solar Trackers

10.3.2.1. Drivers

10.3.2.2. Restraints

10.3.2.3. Opportunities

10.3.2.4. Trends

11. North America Solar Tracker Market Analysis

11.1. Overview

11.1.1. Market Dynamics for North America

11.1.1.1. Drivers

11.1.1.2. Restraints

11.1.1.3. Opportunities

11.1.1.4. Trends

11.2. North America Solar Tracker Market, by Type of Solar Tracker, 2019-2032(US$ Mn)

11.2.1. Overview

11.2.2. SRC Analysis

11.3. North America Solar Tracker Market, by Application, 2019-2032(US$ Mn)

11.3.1. Overview

11.3.2. SRC Analysis

11.4. North America Solar Tracker Market, by Tracking Technology, 2019-2032(US$ Mn)

11.4.1. Overview

11.4.2. SRC Analysis

11.5. North America Solar Tracker Market, by Country, 2019-2032(US$ Mn)

11.5.1. North America Solar Tracker Market, by Country, 2023 Vs 2032 (in%)

11.5.2. U.S.

11.5.3. Canada

11.5.4. Mexico

12. Europe Solar Tracker Market Analysis

12.1. Overview

12.1.1. Market Dynamics for North America

12.1.1.1. Drivers

12.1.1.2. Restraints

12.1.1.3. Opportunities

12.1.1.4. Trends

12.2. Europe Solar Tracker Market, by Type of Solar Tracker, 2019-2032(US$ Mn)

12.2.1. Overview

12.2.2. SRC Analysis

12.3. Europe Solar Tracker Market, by Application, 2019-2032(US$ Mn)

12.3.1. Overview

12.3.2. SRC Analysis

12.4. Europe Solar Tracker Market, by Tracking Technology, 2019-2032(US$ Mn)

12.4.1. Overview

12.4.2. SRC Analysis

12.5. Europe Solar Tracker Market, by Country, 2019-2032 (US$ Mn)

12.5.1. Europe Solar Tracker Market, by Country, 2023 Vs 2032 (in%)

12.5.2. UK

12.5.3. France

12.5.4. Germany

12.5.5. Italy

12.5.6. Spain

12.5.7. Benelux

12.5.8. Russia

12.5.9. Rest of Europe

13. Asia Pacific Solar Tracker Market Analysis

13.1. Overview

13.1.1. Market Dynamics for North America

13.1.1.1. Drivers

13.1.1.2. Restraints

13.1.1.3. Opportunities

13.1.1.4. Trends

13.2. Asia Pacific Solar Tracker Market, by Type of Solar Tracker, 2019-2032(US$ Mn)

13.2.1. Overview

13.2.2. SRC Analysis

13.3. Asia Pacific Solar Tracker Market, by Application, 2019-2032(US$ Mn)

13.3.1. Overview

13.3.2. SRC Analysis

13.4. Asia Pacific Solar Tracker Market, by Tracking Technology, 2019-2032(US$ Mn)

13.4.1. Overview

13.4.2. SRC Analysis

13.5. Asia Pacific Solar Tracker Market, by Country, 2019-2032 (US$ Mn)

13.5.1. Asia Pacific Solar Tracker Market, by Country, 2023 Vs 2032 (in%)

13.5.2. China

13.5.3. Japan

13.5.4. India

13.5.5. South Korea

13.5.6. South East Asia

13.5.7. Rest of Asia Pacific

14. Latin America Solar Tracker Market Analysis

14.1. Overview

14.1.1. Market Dynamics for North America

14.1.1.1. Drivers

14.1.1.2. Restraints

14.1.1.3. Opportunities

14.1.1.4. Trends

14.2. Latin America Solar Tracker Market, by Type of Solar Tracker, 2019-2032(US$ Mn)

14.2.1. Overview

14.2.2. SRC Analysis

14.3. Latin America Solar Tracker Market, by Application, 2019-2032(US$ Mn)

14.3.1. Overview

14.3.2. SRC Analysis

14.4. Latin America Solar Tracker Market, by Tracking Technology, 2019-2032(US$ Mn)

14.4.1. Overview

14.4.2. SRC Analysis

14.5. Latin America Solar Tracker Market, by Country, 2019-2032 (US$ Mn)

14.5.1. Latin America Solar Tracker Market, by Country, 2023 Vs 2032 (in%)

14.5.2. Brazil

14.5.3. Argentina

14.5.4. Rest of Latin America

15. Middle East Solar Tracker Market Analysis

15.1. Overview

15.1.1. Market Dynamics for North America

15.1.1.1. Drivers

15.1.1.2. Restraints

15.1.1.3. Opportunities

15.1.1.4. Trends

15.2. Middle East Solar Tracker Market, by Type of Solar Tracker, 2019-2032(US$ Mn)

15.2.1. Overview

15.2.2. SRC Analysis

15.3. Middle East Solar Tracker Market, by Application, 2019-2032(US$ Mn)

15.3.1. Overview

15.3.2. SRC Analysis

15.4. Middle East Solar Tracker Market, by Tracking Technology, 2019-2032(US$ Mn)

15.4.1. Overview

15.4.2. SRC Analysis

15.5. Middle East Solar Tracker Market, by Country, 2019-2032 (US$ Mn)

15.5.1. Middle East Solar Tracker Market, by Country, 2023 Vs 2032 (in%)

15.5.2. UAE

15.5.3. Saudi Arabia

15.5.4. Rest of Middle East

16. Africa Solar Tracker Market Analysis

16.1. Overview

16.1.1. Market Dynamics for North America

16.1.1.1. Drivers

16.1.1.2. Restraints

16.1.1.3. Opportunities

16.1.1.4. Trends

16.2. Africa Solar Tracker Market, by Type of Solar Tracker, 2019-2032(US$ Mn)

16.2.1. Overview

16.2.2. SRC Analysis

16.3. Africa Solar Tracker Market, by Application, 2019-2032(US$ Mn)

16.3.1. Overview

16.3.2. SRC Analysis

16.4. Africa Solar Tracker Market, by Tracking Technology, 2019-2032(US$ Mn)

16.4.1. Overview

16.4.2. SRC Analysis

16.5. Africa Solar Tracker Market, by Country, 2019-2032 (US$ Mn)

16.5.1. Middle East Solar Tracker Market, by Country, 2023 Vs 2032 (in%)

16.5.2. South Africa

16.5.3. Egypt

16.5.4. Rest of Africa

17. Company Profiles

17.1. NEXTracker (U.S.)

17.1.1. Company Overview

17.1.2. Products/Services Portfolio

17.1.3. Geographical Presence

17.1.4. SWOT Analysis

17.1.5. Financial Summary

17.1.5.1. Market Revenue and Net Profit (2019-2023)

17.1.5.2. Business Segment Revenue Analysis

17.1.5.3. Geographical Revenue Analysis

17.2. Array Technologies (U.S.)

17.3. Trina Solar (China)

17.4. SunPower Corporation (U.S.)

17.5. ArcelorMittal Projects (Luxembourg)

17.6. Soltec (Spain)

17.7. Convert Italia (Italy)

17.8. PV Hardware (Spain)

17.9. Arctech Solar (U.S.)

17.10. Solar Steel (Spain)

17.11. Ideematec (Germany)

17.12. SunPower (U.S.)

17.13. Scorpius Trackers (India)

17.14. Sun Action Trackers (U.S.)

17.15. others

18. Research Methodology

18.1. Research Methodology

18.2. Phase I – Secondary Research

18.3. Phase II – Data Modelling

18.3.1. Company Share Analysis Model

18.3.2. Revenue Based Modelling

18.4. Phase III – Primary Research

18.5. Research Limitations

18.5.1. Assumptions

List of Figures

FIG. 1 Global Solar Tracker Market: Research Methodology

FIG. 2 Market Size Estimation – Top Down & Bottom up Approach

FIG. 3 Global Solar Tracker Market Segmentation

FIG. 4 Global Solar Tracker Market, by Type of Solar Tracker, 2023 (US$ Mn)

FIG. 5 Global Solar Tracker Market, by Application, 2023 (US$ Mn)

FIG. 6 Global Solar Tracker Market, by Tracking Technology, 2023 (US$ Mn)

FIG. 7 Global Solar Tracker Market, by Geography, 2023 (US$ Mn)

FIG. 8 Attractive Investment Proposition, by Type of Solar Tracker, 2023

FIG. 9 Attractive Investment Proposition, by Application, 2023

FIG. 10 Attractive Investment Proposition, by Tracking Technology, 2023

FIG. 11 Attractive Investment Proposition, by Geography, 2023

FIG. 12 Global Market Share Analysis of Key Solar Tracker Market Manufacturers, 2023

FIG. 13 Global Market Positioning of Key Solar Tracker Market Manufacturers, 2023

FIG. 14 Global Solar Tracker Market Value Contribution, By Type of Solar Tracker, 2023&2032 (Value %)

FIG. 15 Global Solar Tracker Market, by Single Axis Solar Trackers, By Region, 2019-2023 (US$ Mn)

FIG. 16 Global Solar Tracker Market, by Horizontal Single Axis Trackers (HSAT), By Region, 2019-2023 (US$ Mn)

FIG. 17 Global Solar Tracker Market, by Vertical Single Axis Trackers (VSAT), By Region, 2019-2023 (US$ Mn)

FIG. 18 Global Solar Tracker Market, by Dual Axis Solar Trackers, By Region, 2019-2023 (US$ Mn)

FIG. 19 Global Solar Tracker Market Value Contribution, By Application, 2023&2032 (Value %)

FIG. 20 Global Solar Tracker Market, by Utility-scale Solar Power Plants, By Region, 2019-2023 (US$ Mn)

FIG. 21 Global Solar Tracker Market, by Commercial and Industrial (C&I) Solar Installations, By Region, 2019-2023 (US$ Mn)

FIG. 22 Global Solar Tracker Market, by Residential Solar Installations, By Region, 2019-2023 (US$ Mn)

FIG. 23 Global Solar Tracker Market, by Concentrated Solar Power (CSP) Plants, By Region, 2019-2023 (US$ Mn)

FIG. 24 Global Solar Tracker Market Value Contribution, By Tracking Technology, 2023&2032 (Value %)

FIG. 25 Global Solar Tracker Market, by Active Solar Trackers, By Region, 2019-2023 (US$ Mn)

FIG. 26 Global Solar Tracker Market, by Passive Solar Trackers, By Region, 2019-2023 (US$ Mn)

FIG. 27 North America Solar Tracker Market, 2019-2032 (US$ Mn)

FIG. 28 U.S. Solar Tracker Market, 2019-2032 (US$ Mn)

FIG. 29 Canada Solar Tracker Market, 2019-2032 (US$ Mn)

FIG. 30 Mexico Solar Tracker Market, 2019-2032 (US$ Mn)

FIG. 31 Europe Solar Tracker Market, 2019-2032 (US$ Mn)

FIG. 32 Germany Solar Tracker Market, 2019-2032 (US$ Mn)

FIG. 33 France Solar Tracker Market, 2019-2032 (US$ Mn)

FIG. 34 U.K. Solar Tracker Market, 2019-2032 (US$ Mn)

FIG. 35 Italy Solar Tracker Market, 2019-2032 (US$ Mn)

FIG. 36 Spain Solar Tracker Market, 2019-2032 (US$ Mn)

FIG. 37 Benelux Solar Tracker Market, 2019-2032 (US$ Mn)

FIG. 38 Russia Solar Tracker Market, 2019-2032 (US$ Mn)

FIG. 39 Rest of Europe Solar Tracker Market, 2019-2032 (US$ Mn)

FIG. 40 Asia Pacific Solar Tracker Market, 2019-2032 (US$ Mn)

FIG. 41 China Solar Tracker Market, 2019-2032 (US$ Mn)

FIG. 42 Japan Solar Tracker Market, 2019-2032 (US$ Mn)

FIG. 43 India Solar Tracker Market, 2019-2032 (US$ Mn)

FIG. 44 South Korea Solar Tracker Market, 2019-2032 (US$ Mn)

FIG. 45 South-East Asia Solar Tracker Market, 2019-2032 (US$ Mn)

FIG. 46 Rest of Asia Pacific Solar Tracker Market, 2019-2032 (US$ Mn)

FIG. 47 Latin America Solar Tracker Market, 2019-2032 (US$ Mn)

FIG. 48 Brazil Solar Tracker Market, 2019-2032 (US$ Mn)

FIG. 49 Argentina Solar Tracker Market, 2019-2032 (US$ Mn)

FIG. 50 Rest of Latin America Solar Tracker Market, 2019-2032 (US$ Mn)

FIG. 51 Middle East Solar Tracker Market, 2019-2032 (US$ Mn)

FIG. 52 UAE Solar Tracker Market, 2019-2032 (US$ Mn)

FIG. 53 Saudi Arabia Solar Tracker Market, 2019-2032 (US$ Mn)

FIG. 54 Rest of Middle East Solar Tracker Market, 2019-2032 (US$ Mn)

FIG. 55 Africa Solar Tracker Market, 2019-2032 (US$ Mn)

FIG. 56 South Africa Solar Tracker Market, 2019-2032 (US$ Mn)

FIG. 57 Egypt Solar Tracker Market, 2019-2032 (US$ Mn)

FIG. 58 Rest of Africa Solar Tracker Market, 2019-2032 (US$ Mn)


List of Tables

TABLE 1 Market Snapshot: Global Solar Tracker Market

TABLE 2 Global Solar Tracker Market: Market Drivers Impact Analysis

TABLE 3 Global Solar Tracker Market: Market Restraints Impact Analysis

TABLE 4 Global Solar Tracker Market, by Competitive Benchmarking, 2023

TABLE 5 Global Solar Tracker Market, by Geographical Presence Analysis, 2023

TABLE 6 Global Solar Tracker Market, by Key Strategies Analysis, 2023

TABLE 7 Global Solar Tracker Market, by Single Axis Solar Trackers, By Region, 2019-2023 (US$ Mn)

TABLE 8 Global Solar Tracker Market, by Single Axis Solar Trackers, By Region, 2024-2032 (US$ Mn)

TABLE 9 Global Solar Tracker Market, by Horizontal Single Axis Trackers (HSAT), By Region, 2019-2023 (US$ Mn)

TABLE 10 Global Solar Tracker Market, by Horizontal Single Axis Trackers (HSAT), By Region, 2019-2023 (US$ Mn)

TABLE 11 Global Solar Tracker Market, by Vertical Single Axis Trackers (VSAT), By Region, 2019-2023 (US$ Mn)

TABLE 12 Global Solar Tracker Market, by Vertical Single Axis Trackers (VSAT), By Region, 2019-2023 (US$ Mn)

TABLE 13 Global Solar Tracker Market, by Dual Axis Solar Trackers, By Region, 2019-2023 (US$ Mn)

TABLE 14 Global Solar Tracker Market, by Dual Axis Solar Trackers, By Region, 2019-2023 (US$ Mn)

TABLE 15 Global Solar Tracker Market, by Utility-scale Solar Power Plants, By Region, 2019-2023 (US$ Mn)

TABLE 16 Global Solar Tracker Market, by Utility-scale Solar Power Plants, By Region, 2019-2023 (US$ Mn)

TABLE 17 Global Solar Tracker Market, by Commercial and Industrial (C&I) Solar Installations, By Region, 2019-2023 (US$ Mn)

TABLE 18 Global Solar Tracker Market, by Commercial and Industrial (C&I) Solar Installations, By Region, 2019-2023 (US$ Mn)

TABLE 19 Global Solar Tracker Market, by Residential Solar Installations, By Region, 2019-2023 (US$ Mn)

TABLE 20 Global Solar Tracker Market, by Residential Solar Installations, By Region, 2019-2023 (US$ Mn)

TABLE 21 Global Solar Tracker Market, by Concentrated Solar Power (CSP) Plants, By Region, 2019-2023 (US$ Mn)

TABLE 22 Global Solar Tracker Market, by Concentrated Solar Power (CSP) Plants, By Region, 2019-2023 (US$ Mn)

TABLE 23 Global Solar Tracker Market, by Active Solar Trackers, By Region, 2019-2023 (US$ Mn)

TABLE 24 Global Solar Tracker Market, by Active Solar Trackers, By Region, 2019-2023 (US$ Mn)

TABLE 25 Global Solar Tracker Market, by Passive Solar Trackers, By Region, 2019-2023 (US$ Mn)

TABLE 26 Global Solar Tracker Market, by Passive Solar Trackers, By Region, 2019-2023 (US$ Mn)

TABLE 27 Global Solar Tracker Market, by Type of Solar Tracker, 2019-2023 (US$ Mn)

TABLE 28 Global Solar Tracker Market, by Type of Solar Tracker, 2024-2032 (US$ Mn)

TABLE 29 Global Solar Tracker Market, by Application, 2019-2023 (US$ Mn)

TABLE 30 Global Solar Tracker Market, by Application, 2024-2032 (US$ Mn)

TABLE 31 Global Solar Tracker Market, by Tracking Technology, 2019-2023 (US$ Mn)

TABLE 32 Global Solar Tracker Market, by Tracking Technology, 2024-2032 (US$ Mn)

TABLE 33 Global Solar Tracker Market, by Region, 2019-2023 (US$ Mn)

TABLE 34 Global Solar Tracker Market, by Region, 2024-2032 (US$ Mn)

TABLE 35 North America Solar Tracker Market, by Type of Solar Tracker, 2019-2023 (US$ Mn)

TABLE 36 North America Solar Tracker Market, by Type of Solar Tracker, 2024-2032 (US$ Mn)

TABLE 37 North America Solar Tracker Market, by Application, 2019-2023 (US$ Mn)

TABLE 38 North America Solar Tracker Market, by Application, 2024-2032 (US$ Mn)

TABLE 39 North America Solar Tracker Market, by Tracking Technology, 2019-2023 (US$ Mn)

TABLE 40 North America Solar Tracker Market, by Tracking Technology, 2024-2032 (US$ Mn)

TABLE 41 North America Solar Tracker Market, by Country, 2019-2023 (US$ Mn)

TABLE 42 North America Solar Tracker Market, by Country, 2024-2032 (US$ Mn)

TABLE 43 United States Solar Tracker Market, by Type of Solar Tracker, 2019-2023 (US$ Mn)

TABLE 44 United States Solar Tracker Market, by Type of Solar Tracker, 2024-2032 (US$ Mn)

TABLE 45 United States Solar Tracker Market, by Application, 2019-2023 (US$ Mn)

TABLE 46 United States Solar Tracker Market, by Application, 2024-2032 (US$ Mn)

TABLE 47 United States Solar Tracker Market, by Tracking Technology, 2019-2023 (US$ Mn)

TABLE 48 United States Solar Tracker Market, by Tracking Technology, 2024-2032 (US$ Mn)

TABLE 49 Canada Solar Tracker Market, by Type of Solar Tracker, 2019-2023 (US$ Mn)

TABLE 50 Canada Solar Tracker Market, by Type of Solar Tracker, 2024-2032 (US$ Mn)

TABLE 51 Canada Solar Tracker Market, by Application, 2019-2023 (US$ Mn)

TABLE 52 Canada Solar Tracker Market, by Application, 2024-2032 (US$ Mn)

TABLE 53 Canada Solar Tracker Market, by Tracking Technology, 2019-2023 (US$ Mn)

TABLE 54 Canada Solar Tracker Market, by Tracking Technology, 2024-2032 (US$ Mn)

TABLE 55 Mexico Solar Tracker Market, by Type of Solar Tracker, 2019-2023 (US$ Mn)

TABLE 56 Mexico Solar Tracker Market, by Type of Solar Tracker, 2024-2032 (US$ Mn)

TABLE 57 Mexico Solar Tracker Market, by Application, 2019-2023 (US$ Mn)

TABLE 58 Mexico Solar Tracker Market, by Application, 2024-2032 (US$ Mn)

TABLE 59 Mexico Solar Tracker Market, by Tracking Technology, 2019-2023 (US$ Mn)

TABLE 60 Mexico Solar Tracker Market, by Tracking Technology, 2024-2032 (US$ Mn)

TABLE 61 Europe Solar Tracker Market, by Type of Solar Tracker, 2019-2023 (US$ Mn)

TABLE 62 Europe Solar Tracker Market, by Type of Solar Tracker, 2024-2032 (US$ Mn)

TABLE 63 Europe Solar Tracker Market, by Application, 2019-2023 (US$ Mn)

TABLE 64 Europe Solar Tracker Market, by Application, 2024-2032 (US$ Mn)

TABLE 65 Europe Solar Tracker Market, by Tracking Technology, 2019-2023 (US$ Mn)

TABLE 66 Europe Solar Tracker Market, by Tracking Technology, 2024-2032 (US$ Mn)

TABLE 67 Europe Solar Tracker Market, by Country, 2019-2023 (US$ Mn)

TABLE 68 Europe Solar Tracker Market, by Country, 2024-2032 (US$ Mn)

TABLE 69 Germany Solar Tracker Market, by Type of Solar Tracker, 2019-2023 (US$ Mn)

TABLE 70 Germany Solar Tracker Market, by Type of Solar Tracker, 2024-2032 (US$ Mn)

TABLE 71 Germany Solar Tracker Market, by Application, 2019-2023 (US$ Mn)

TABLE 72 Germany Solar Tracker Market, by Application, 2024-2032 (US$ Mn)

TABLE 73 Germany Solar Tracker Market, by Tracking Technology, 2019-2023 (US$ Mn)

TABLE 74 Germany Solar Tracker Market, by Tracking Technology, 2024-2032 (US$ Mn)

TABLE 75 France Solar Tracker Market, by Type of Solar Tracker, 2019-2023 (US$ Mn)

TABLE 76 France Solar Tracker Market, by Type of Solar Tracker, 2024-2032 (US$ Mn)

TABLE 77 France Solar Tracker Market, by Application, 2019-2023 (US$ Mn)

TABLE 78 France Solar Tracker Market, by Application, 2024-2032 (US$ Mn)

TABLE 79 France Solar Tracker Market, by Tracking Technology, 2019-2023 (US$ Mn)

TABLE 80 France Solar Tracker Market, by Tracking Technology, 2024-2032 (US$ Mn)

TABLE 81 United Kingdom Solar Tracker Market, by Type of Solar Tracker, 2019-2023 (US$ Mn)

TABLE 82 United Kingdom Solar Tracker Market, by Type of Solar Tracker, 2024-2032 (US$ Mn)

TABLE 83 United Kingdom Solar Tracker Market, by Application, 2019-2023 (US$ Mn)

TABLE 84 United Kingdom Solar Tracker Market, by Application, 2024-2032 (US$ Mn)

TABLE 85 United Kingdom Solar Tracker Market, by Tracking Technology, 2019-2023 (US$ Mn)

TABLE 86 United Kingdom Solar Tracker Market, by Tracking Technology, 2024-2032 (US$ Mn)

TABLE 87 Italy Solar Tracker Market, by Type of Solar Tracker, 2019-2023 (US$ Mn)

TABLE 88 Italy Solar Tracker Market, by Type of Solar Tracker, 2024-2032 (US$ Mn)

TABLE 89 Italy Solar Tracker Market, by Application, 2019-2023 (US$ Mn)

TABLE 90 Italy Solar Tracker Market, by Application, 2024-2032 (US$ Mn)

TABLE 91 Italy Solar Tracker Market, by Tracking Technology, 2019-2023 (US$ Mn)

TABLE 92 Italy Solar Tracker Market, by Tracking Technology, 2024-2032 (US$ Mn)

TABLE 93 Spain Solar Tracker Market, by Type of Solar Tracker, 2019-2023 (US$ Mn)

TABLE 94 Spain Solar Tracker Market, by Type of Solar Tracker, 2024-2032 (US$ Mn)

TABLE 95 Spain Solar Tracker Market, by Application, 2019-2023 (US$ Mn)

TABLE 96 Spain Solar Tracker Market, by Application, 2024-2032 (US$ Mn)

TABLE 97 Spain Solar Tracker Market, by Tracking Technology, 2019-2023 (US$ Mn)

TABLE 98 Spain Solar Tracker Market, by Tracking Technology, 2024-2032 (US$ Mn)

TABLE 99 Benelux Solar Tracker Market, by Type of Solar Tracker, 2019-2023 (US$ Mn)

TABLE 100 Benelux Solar Tracker Market, by Type of Solar Tracker, 2024-2032 (US$ Mn)

TABLE 101 Benelux Solar Tracker Market, by Application, 2019-2023 (US$ Mn)

TABLE 102 Benelux Solar Tracker Market, by Application, 2024-2032 (US$ Mn)

TABLE 103 Benelux Solar Tracker Market, by Tracking Technology, 2019-2023 (US$ Mn)

TABLE 104 Benelux Solar Tracker Market, by Tracking Technology, 2024-2032 (US$ Mn)

TABLE 105 Russia Solar Tracker Market, by Type of Solar Tracker, 2019-2023 (US$ Mn)

TABLE 106 Russia Solar Tracker Market, by Type of Solar Tracker, 2024-2032 (US$ Mn)

TABLE 107 Russia Solar Tracker Market, by Application, 2019-2023 (US$ Mn)

TABLE 108 Russia Solar Tracker Market, by Application, 2024-2032 (US$ Mn)

TABLE 109 Russia Solar Tracker Market, by Tracking Technology, 2019-2023 (US$ Mn)

TABLE 110 Russia Solar Tracker Market, by Tracking Technology, 2024-2032 (US$ Mn)

TABLE 111 Rest of Europe Solar Tracker Market, by Type of Solar Tracker, 2019-2023 (US$ Mn)

TABLE 112 Rest of Europe Solar Tracker Market, by Type of Solar Tracker, 2024-2032 (US$ Mn)

TABLE 113 Rest of Europe Solar Tracker Market, by Application, 2019-2023 (US$ Mn)

TABLE 114 Rest of Europe Solar Tracker Market, by Application, 2024-2032 (US$ Mn)

TABLE 115 Rest of Europe Solar Tracker Market, by Tracking Technology, 2019-2023 (US$ Mn)

TABLE 116 Rest of Europe Solar Tracker Market, by Tracking Technology, 2024-2032 (US$ Mn)

TABLE 117 Asia Pacific Solar Tracker Market, by Type of Solar Tracker, 2019-2023 (US$ Mn)

TABLE 118 Asia Pacific Solar Tracker Market, by Type of Solar Tracker, 2024-2032 (US$ Mn)

TABLE 119 Asia Pacific Solar Tracker Market, by Application, 2019-2023 (US$ Mn)

TABLE 120 Asia Pacific Solar Tracker Market, by Application, 2024-2032 (US$ Mn)

TABLE 121 Asia Pacific Solar Tracker Market, by Tracking Technology, 2019-2023 (US$ Mn)

TABLE 122 Asia Pacific Solar Tracker Market, by Tracking Technology, 2024-2032 (US$ Mn)

TABLE 123 China Solar Tracker Market, by Type of Solar Tracker, 2019-2023 (US$ Mn)

TABLE 124 China Solar Tracker Market, by Type of Solar Tracker, 2024-2032 (US$ Mn)

TABLE 125 China Solar Tracker Market, by Application, 2019-2023 (US$ Mn)

TABLE 126 China Solar Tracker Market, by Application, 2024-2032 (US$ Mn)

TABLE 127 China Solar Tracker Market, by Tracking Technology, 2019-2023 (US$ Mn)

TABLE 128 China Solar Tracker Market, by Tracking Technology, 2024-2032 (US$ Mn)

TABLE 129 Japan Solar Tracker Market, by Type of Solar Tracker, 2019-2023 (US$ Mn)

TABLE 130 Japan Solar Tracker Market, by Type of Solar Tracker, 2024-2032 (US$ Mn)

TABLE 131 Japan Solar Tracker Market, by Application, 2019-2023 (US$ Mn)

TABLE 132 Japan Solar Tracker Market, by Application, 2024-2032 (US$ Mn)

TABLE 133 Japan Solar Tracker Market, by Tracking Technology, 2019-2023 (US$ Mn)

TABLE 134 Japan Solar Tracker Market, by Tracking Technology, 2024-2032 (US$ Mn)

TABLE 135 India Solar Tracker Market, by Type of Solar Tracker, 2019-2023 (US$ Mn)

TABLE 136 India Solar Tracker Market, by Type of Solar Tracker, 2024-2032 (US$ Mn)

TABLE 137 India Solar Tracker Market, by Application, 2019-2023 (US$ Mn)

TABLE 138 India Solar Tracker Market, by Application, 2024-2032 (US$ Mn)

TABLE 139 India Solar Tracker Market, by Tracking Technology, 2019-2023 (US$ Mn)

TABLE 140 India Solar Tracker Market, by Tracking Technology, 2024-2032 (US$ Mn)

TABLE 141 South Korea Solar Tracker Market, by Type of Solar Tracker, 2019-2023 (US$ Mn)

TABLE 142 South Korea Solar Tracker Market, by Type of Solar Tracker, 2024-2032 (US$ Mn)

TABLE 143 South Korea Solar Tracker Market, by Application, 2019-2023 (US$ Mn)

TABLE 144 South Korea Solar Tracker Market, by Application, 2024-2032 (US$ Mn)

TABLE 145 South Korea Solar Tracker Market, by Tracking Technology, 2019-2023 (US$ Mn)

TABLE 146 South Korea Solar Tracker Market, by Tracking Technology, 2024-2032 (US$ Mn)

TABLE 147 South-East Asia Solar Tracker Market, by Type of Solar Tracker, 2019-2023 (US$ Mn)

TABLE 148 South-East Asia Solar Tracker Market, by Type of Solar Tracker, 2024-2032 (US$ Mn)

TABLE 149 South-East Asia Solar Tracker Market, by Application, 2019-2023 (US$ Mn)

TABLE 150 South-East Asia Solar Tracker Market, by Application, 2024-2032 (US$ Mn)

TABLE 151 South-East Asia Solar Tracker Market, by Tracking Technology, 2019-2023 (US$ Mn)

TABLE 152 South-East Asia Solar Tracker Market, by Tracking Technology, 2024-2032 (US$ Mn)

TABLE 153 Rest of Asia Pacific Solar Tracker Market, by Type of Solar Tracker, 2019-2023 (US$ Mn)

TABLE 154 Rest of Asia Pacific Solar Tracker Market, by Type of Solar Tracker, 2024-2032 (US$ Mn)

TABLE 155 Rest of Asia Pacific Solar Tracker Market, by Application, 2019-2023 (US$ Mn)

TABLE 156 Rest of Asia Pacific Solar Tracker Market, by Application, 2024-2032 (US$ Mn)

TABLE 157 Rest of Asia Pacific Solar Tracker Market, by Tracking Technology, 2019-2023 (US$ Mn)

TABLE 158 Rest of Asia Pacific Solar Tracker Market, by Tracking Technology, 2024-2032 (US$ Mn)

TABLE 159 Latin America Solar Tracker Market, by Type of Solar Tracker, 2019-2023 (US$ Mn)

TABLE 160 Latin America Solar Tracker Market, by Type of Solar Tracker, 2024-2032 (US$ Mn)

TABLE 161 Latin America Solar Tracker Market, by Application, 2019-2023 (US$ Mn)

TABLE 162 Latin America Solar Tracker Market, by Application, 2024-2032 (US$ Mn)

TABLE 163 Latin America Solar Tracker Market, by Tracking Technology, 2019-2023 (US$ Mn)

TABLE 164 Latin America Solar Tracker Market, by Tracking Technology, 2024-2032 (US$ Mn)

TABLE 165 Brazil Solar Tracker Market, by Type of Solar Tracker, 2019-2023 (US$ Mn)

TABLE 166 Brazil Solar Tracker Market, by Type of Solar Tracker, 2024-2032 (US$ Mn)

TABLE 167 Brazil Solar Tracker Market, by Application, 2019-2023 (US$ Mn)

TABLE 168 Brazil Solar Tracker Market, by Application, 2024-2032 (US$ Mn)

TABLE 169 Brazil Solar Tracker Market, by Tracking Technology, 2019-2023 (US$ Mn)

TABLE 170 Brazil Solar Tracker Market, by Tracking Technology, 2024-2032 (US$ Mn)

TABLE 171 Argentina Solar Tracker Market, by Type of Solar Tracker, 2019-2023 (US$ Mn)

TABLE 172 Argentina Solar Tracker Market, by Type of Solar Tracker, 2024-2032 (US$ Mn)

TABLE 173 Argentina Solar Tracker Market, by Application, 2019-2023 (US$ Mn)

TABLE 174 Argentina Solar Tracker Market, by Application, 2024-2032 (US$ Mn)

TABLE 175 Argentina Solar Tracker Market, by Tracking Technology, 2019-2023 (US$ Mn)

TABLE 176 Argentina Solar Tracker Market, by Tracking Technology, 2024-2032 (US$ Mn)

TABLE 177 Rest of Latin America Solar Tracker Market, by Type of Solar Tracker, 2019-2023 (US$ Mn)

TABLE 178 Rest of Latin America Solar Tracker Market, by Type of Solar Tracker, 2024-2032 (US$ Mn)

TABLE 179 Rest of Latin America Solar Tracker Market, by Application, 2019-2023 (US$ Mn)

TABLE 180 Rest of Latin America Solar Tracker Market, by Application, 2024-2032 (US$ Mn)

TABLE 181 Rest of Latin America Solar Tracker Market, by Tracking Technology, 2019-2023 (US$ Mn)

TABLE 182 Rest of Latin America Solar Tracker Market, by Tracking Technology, 2024-2032 (US$ Mn)

TABLE 183 Middle East Solar Tracker Market, by Type of Solar Tracker, 2019-2023 (US$ Mn)

TABLE 184 Middle East Solar Tracker Market, by Type of Solar Tracker, 2024-2032 (US$ Mn)

TABLE 185 Middle East Solar Tracker Market, by Application, 2019-2023 (US$ Mn)

TABLE 186 Middle East Solar Tracker Market, by Application, 2024-2032 (US$ Mn)

TABLE 187 Middle East Solar Tracker Market, by Tracking Technology, 2019-2023 (US$ Mn)

TABLE 188 Middle East Solar Tracker Market, by Tracking Technology, 2024-2032 (US$ Mn)

TABLE 189 UAE Solar Tracker Market, by Type of Solar Tracker, 2019-2023 (US$ Mn)

TABLE 190 UAE Solar Tracker Market, by Type of Solar Tracker, 2024-2032 (US$ Mn)

TABLE 191 UAE Solar Tracker Market, by Application, 2019-2023 (US$ Mn)

TABLE 192 UAE Solar Tracker Market, by Application, 2024-2032 (US$ Mn)

TABLE 193 UAE Solar Tracker Market, by Tracking Technology, 2019-2023 (US$ Mn)

TABLE 194 UAE Solar Tracker Market, by Tracking Technology, 2024-2032 (US$ Mn)

TABLE 195 Saudi Arabia Solar Tracker Market, by Type of Solar Tracker, 2019-2023 (US$ Mn)

TABLE 196 Saudi Arabia Solar Tracker Market, by Type of Solar Tracker, 2024-2032 (US$ Mn)

TABLE 197 Saudi Arabia Solar Tracker Market, by Application, 2019-2023 (US$ Mn)

TABLE 198 Saudi Arabia Solar Tracker Market, by Application, 2024-2032 (US$ Mn)

TABLE 199 Saudi Arabia Solar Tracker Market, by Tracking Technology, 2019-2023 (US$ Mn)

TABLE 200 Saudi Arabia Solar Tracker Market, by Tracking Technology, 2024-2032 (US$ Mn)

TABLE 201 Rest of Middle East Solar Tracker Market, by Type of Solar Tracker, 2019-2023 (US$ Mn)

TABLE 202 Rest of Middle East Solar Tracker Market, by Type of Solar Tracker, 2024-2032 (US$ Mn)

TABLE 203 Rest of Middle East Solar Tracker Market, by Application, 2019-2023 (US$ Mn)

TABLE 204 Rest of Middle East Solar Tracker Market, by Application, 2024-2032 (US$ Mn)

TABLE 205 Rest of Middle East Solar Tracker Market, by Tracking Technology, 2019-2023 (US$ Mn)

TABLE 206 Rest of Middle East Solar Tracker Market, by Tracking Technology, 2024-2032 (US$ Mn)

TABLE 207 Africa Solar Tracker Market, by Type of Solar Tracker, 2019-2023 (US$ Mn)

TABLE 208 Africa Solar Tracker Market, by Type of Solar Tracker, 2024-2032 (US$ Mn)

TABLE 209 Africa Solar Tracker Market, by Application, 2019-2023 (US$ Mn)

TABLE 210 Africa Solar Tracker Market, by Application, 2024-2032 (US$ Mn)

TABLE 211 Africa Solar Tracker Market, by Tracking Technology, 2019-2023 (US$ Mn)

TABLE 212 Africa Solar Tracker Market, by Tracking Technology, 2024-2032 (US$ Mn)

TABLE 213 South Africa Solar Tracker Market, by Type of Solar Tracker, 2019-2023 (US$ Mn)

TABLE 214 South Africa Solar Tracker Market, by Type of Solar Tracker, 2024-2032 (US$ Mn)

TABLE 215 South Africa Solar Tracker Market, by Application, 2019-2023 (US$ Mn)

TABLE 216 South Africa Solar Tracker Market, by Application, 2024-2032 (US$ Mn)

TABLE 217 South Africa Solar Tracker Market, by Tracking Technology, 2019-2023 (US$ Mn)

TABLE 218 South Africa Solar Tracker Market, by Tracking Technology, 2024-2032 (US$ Mn)

TABLE 219 Egypt Solar Tracker Market, by Type of Solar Tracker, 2019-2023 (US$ Mn)

TABLE 220 Egypt Solar Tracker Market, by Type of Solar Tracker, 2024-2032 (US$ Mn)

TABLE 221 Egypt Solar Tracker Market, by Application, 2019-2023 (US$ Mn)

TABLE 222 Egypt Solar Tracker Market, by Application, 2024-2032 (US$ Mn)

TABLE 223 Egypt Solar Tracker Market, by Tracking Technology, 2019-2023 (US$ Mn)

TABLE 224 Egypt Solar Tracker Market, by Tracking Technology, 2024-2032 (US$ Mn)

TABLE 225 Rest of Africa Solar Tracker Market, by Type of Solar Tracker, 2019-2023 (US$ Mn)

TABLE 226 Rest of Africa Solar Tracker Market, by Type of Solar Tracker, 2024-2032 (US$ Mn)

TABLE 227 Rest of Africa Solar Tracker Market, by Application, 2019-2023 (US$ Mn)

TABLE 228 Rest of Africa Solar Tracker Market, by Application, 2024-2032 (US$ Mn)

TABLE 229 Rest of Africa Solar Tracker Market, by Tracking Technology, 2019-2023 (US$ Mn)

TABLE 230 Rest of Africa Solar Tracker Market, by Tracking Technology, 2024-2032 (US$ Mn)

Frequently Asked Questions:

What is the current size of the global Solar Tracker market?

The global Solar Tracker market was valued at USD 7152.2 Million in 2023.

What is the expected growth rate of the Solar Tracker market between 2024 and 2032?

The Solar Tracker market is expected to grow at a CAGR of 14.50% between 2024 and 2032, reaching USD 24192.96 Million in 2032.

Which segment is leading the market share in terms of Type of Solar Tracker?

Single Axis solar trackers currently hold the largest market share approx. 40-43% in 2023. This can be attributed to its simplicity, lower cost compared to dual-axis trackers, and better performance than fixed-tilt systems.

Which Application segments governs the demand for Solar Trackers in the world?

Utility-scale Solar Power Plants currently hold the largest market share approx. 50-55% in 2023 owing to economies of scale, government subsidies, and investor preferences towards utility-scale projects.

Which Tracking Technology segment is expected to post the highest CAGR during the forecast period?

Passive Solar Trackers are projected to witness the highest CAGR during the forecast period. Passive solar systems rely on natural processes rather than electronic controls or mechanical parts, they experience fewer malfunctions and breakdowns.

Which region is fueling the growth of the Solar Tracker industry?

Asia Pacific held largest share around 38-42% of the market in 2023.

Who are the major players in the global Solar Tracker market?

The top players include NEXTracker (U.S.), Array Technologies (U.S.), Trina Solar (China), SunPower Corporation (U.S.), ArcelorMittal Projects (Luxembourg), Soltec (Spain), Convert Italia (Italy), PV Hardware (Spain), Arctech Solar (U.S.), Solar Steel (Spain), Ideematec (Germany), SunPower (U.S.), among others.

What are the major market drivers of the Solar Tracker industry?

The global Solar Tracker market is driven by various factors such as increasing demand for renewable energy and a push towards achieving sustainability goals. Technological advances, such as more efficient and reliable solar tracking systems, also contribute significantly. Moreover, favorable government policies and incentives aimed at promoting the use of solar panels play an important role in market growth.

What are the major market restraints of the Solar Tracker industry?

The global solar tracker market is mainly restraints by high initial investment costs associated with installation and maintenance.

What are the major market opportunities of the Solar Tracker industry?

The global Solar Tracker market presents numerous growth opportunities including continued advances in material science, IoT integration, data analytics, and artificial intelligence pave the way for improved production efficiency, operational quality, and maintenance practices. Moreover, innovations in dual-axis and distributed tracking systems unlock potential in niche applications such as urban solar installations.

Solar Energy Storage System Market

Published:
Report ID: 101561

Solar PV Tracker Market

Published:
Report ID: 99785

Solar Carport Market

Published:
Report ID: 98870

Commercial Solar Water Heater Market

Published:
Report ID: 98458

Solar Electric Energy and Power Market

Published:
Report ID: 96703

Solar Battery Storage Inverter Market

Published:
Report ID: 96707

Residential Solar Energy Storage System Market

Published:
Report ID: 92429

Solar Panel Mounting Structures Market

Published:
Report ID: 89476

Residential Solar Inverter market

Published:
Report ID: 78758

Solar PV Tracker Market

Published:
Report ID: 99785

Horizontal Directional Drilling (HDD) Market

Published:
Report ID: 12513

Thermal Energy Storage Market

Published:
Report ID: 11178

Power Plant Boilers Market

Published:
Report ID: 11030

Home Energy Management Systems (HEMS) Market

Published:
Report ID: 7082

Distributed Energy Resource Management Market

Published:
Report ID: 86805

Bioliquid Heat and Power Generation Market

Published:
Report ID: 68917

Power Transmission Cables Market

Published:
Report ID: 11253

Solar Collector Tube Market

Published:
Report ID: 59238

Perovskite Solar Cell Market

Published:
Report ID: 56070

Energy Harvesting System Market

Published:
Report ID: 4577

Ocean Carbon Removal Market

Published:
Report ID: 50747

Purchase Options

The report comes as a view-only PDF document, optimized for individual clients. This version is recommended for personal digital use and does not allow printing.
$4699

To meet the needs of modern corporate teams, our report comes in two formats: a printable PDF and a data-rich Excel sheet. This package is optimized for internal analysis and multi-location access, making it an excellent choice for organizations with distributed workforce.
$5699

The report will be delivered in printable PDF format along with the report’s data Excel sheet. This license offers 100 Free Analyst hours where the client can utilize Credence Research Inc.’s research team. It is highly recommended for organizations seeking to execute short, customized research projects related to the scope of the purchased report.
$12699

Credence Staff 3

WILLIAM, North America

Support Staff at Credence Research

KEITH PHILLIPS, Europe

Lee - CR Sales Staff

LEE VALLANCE, Asia Pacific

Smallform of Sample request

Report delivery within 24 to 48 hours

– Other Info –

What people say?-

User Review

I am very impressed with the information in this report. The author clearly did their research when they came up with this product and it has already given me a lot of ideas.

Jana Schmidt
CEDAR CX Technologies

– Connect with us –

Phone

+91 6232 49 3207


support

24/7 Research Support


sales@credenceresearch.com

– Research Methodology –

Going beyond the basics: advanced techniques in research methodology

– Trusted By –

Pepshi, LG, Nestle
Motorola, Honeywell, Johnson and johnson
LG Chem, SIEMENS, Pfizer
Unilever, Samsonite, QIAGEN

Request Sample