
Air Compressor Market Overview:
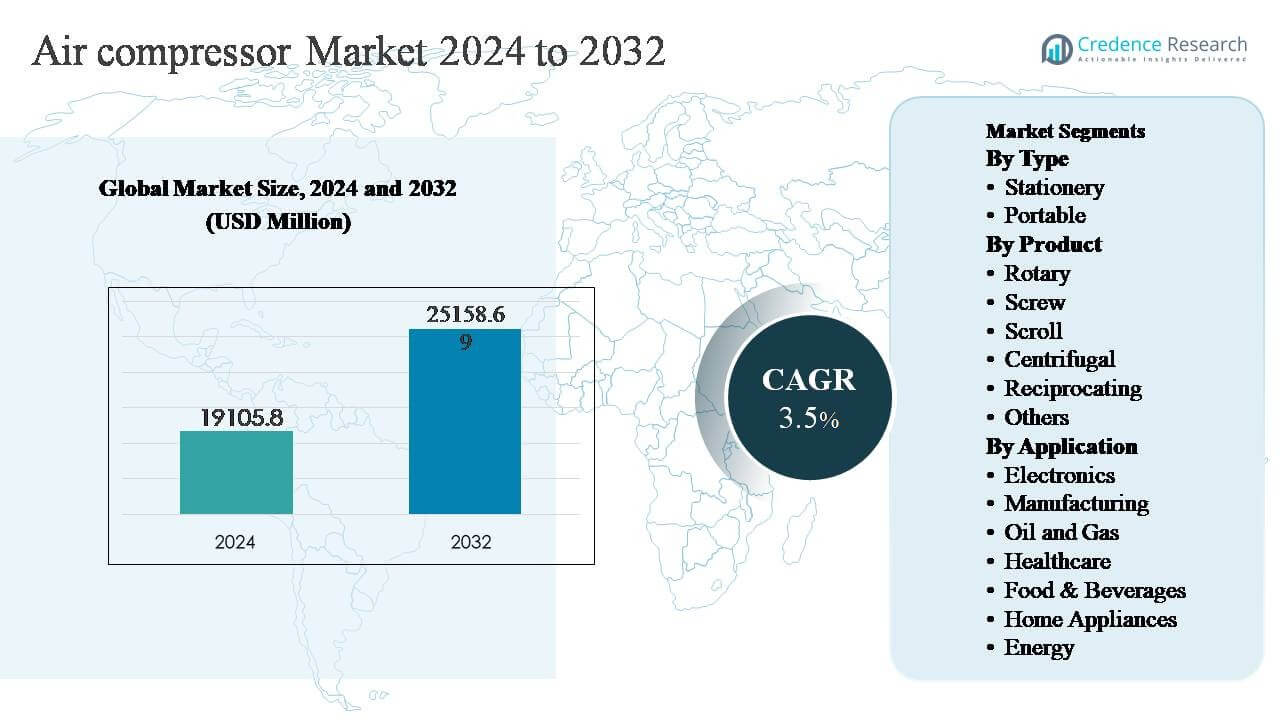
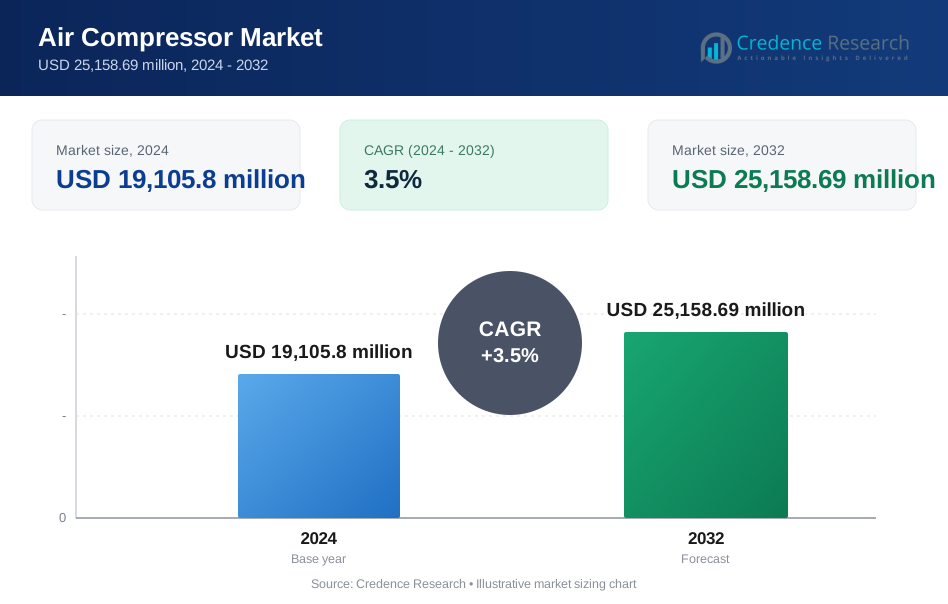
The global air compressor market was valued at USD 19,105.8 million in 2024 and is projected to reach USD 25,158.69 million by 2032, expanding at a compound annual growth rate (CAGR) of 3.5% during the forecast period.
| REPORT ATTRIBUTE | DETAILS |
|---|---|
| Historical Period | 2020-2024 |
| Base Year | 2025 |
| Forecast Period | 2026-2032 |
| Air Compressor Market Size 2024 | USD 19,105.8 million |
| Air Compressor Market , CAGR | 3.5% |
| Air Compressor Market Size 2032 | USD 25,158.69 million |
Air Compressor Market Insights
- Market growth is primarily driven by rising industrialization, manufacturing automation, and infrastructure development, with stationary compressors holding around 65–70% segment share due to continuous-duty industrial applications, and rotary screw compressors accounting for nearly 55-60% share owing to energy efficiency and reliability.
- Key market trends include increasing adoption of energy-efficient and oil-free compressors, integration of smart monitoring systems, and growing preference for variable speed drive technology to reduce operating costs and energy consumption across industrial facilities.
- The competitive landscape is moderately consolidated, with global manufacturers focusing on product innovation, lifecycle service offerings, and expansion of digital and aftermarket capabilities to strengthen long-term customer relationships amid pricing pressure.
- Regionally, Asia Pacific dominates with ~38-40% market share, followed by North America at ~25-27% and Europe at ~22-24%, while Latin America and the Middle East & Africa collectively contribute the remaining share, supported by mining, energy, and infrastructure projects.
Air Compressor Market Segmentation Analysis:
By Type:
By type, stationary air compressors dominate the market, accounting for an estimated 65-70% market share, driven by their widespread deployment in fixed industrial operations requiring continuous and high-capacity compressed air supply. Manufacturing plants, refineries, power stations, and large processing facilities favor stationary systems due to their superior durability, higher efficiency, and ability to support centralized compressed air networks. Growth is reinforced by expanding industrial infrastructure, rising automation levels, and long operating life with lower cost per unit of air delivered. Portable compressors serve construction and field applications but remain secondary in overall market contribution.
- For instance, Mitsubishi Heavy Industries’ stationary centrifugal air compressors used in large manufacturing facilities are designed for motor ratings exceeding 5,000 kW, discharge pressures above 8 bar, and continuous operation exceeding 8,000 operating hours per year without major overhauls, supporting uninterrupted production processes.
By Product:
By product, rotary screw air compressors represent the dominant sub-segment with approximately 55-60% market share, owing to their ability to deliver continuous airflow, high energy efficiency, and low maintenance requirements. These compressors are widely adopted across manufacturing, food processing, and energy sectors where uninterrupted operation is critical. Advances in variable speed drive technology, improved rotor profiles, and oil-free screw designs further strengthen adoption. Reciprocating compressors retain relevance in small-scale and intermittent-use applications, while centrifugal compressors are preferred for very high-capacity industrial processes, particularly in petrochemical and power generation facilities.
- For instance, Atlas Copco’s GA VSD⁺ rotary screw compressors are engineered with drive motors rated up to 315 kW and deliver airflow volumes exceeding 60 m³/min, while achieving annual operating lifetimes above 8,000 hours under continuous industrial duty.
By Application:
By application, manufacturing holds the largest share at around 35-40%, supported by extensive use of compressed air in assembly lines, CNC machining, packaging, painting, and material handling. Rising factory automation, expansion of automotive and electronics production, and demand for precision-controlled air systems continue to drive growth. Oil & gas and energy sectors follow, relying on compressors for drilling, gas processing, and power generation. Healthcare and food & beverages applications are growing steadily, supported by increasing adoption of oil-free and hygienic compressed air solutions compliant with stringent quality standards.
Key Growth Drivers
Expanding Industrialization and Manufacturing Output
Rapid industrialization across emerging and developed economies remains a primary growth driver for the air compressor market. Manufacturing facilities rely heavily on compressed air for automation, assembly, machining, surface finishing, and packaging operations. Growth in automotive, electronics, metals, chemicals, and general industrial manufacturing has significantly increased demand for reliable compressed air systems. Investments in new production plants, capacity expansions, and modernization of legacy facilities are accelerating compressor installations, particularly stationary and rotary screw systems. Additionally, the shift toward automated and semi-automated production lines requires stable, high-pressure air supply to ensure process consistency and operational efficiency, reinforcing sustained demand across industrial end users.
- For instance, Ingersoll Rand supplied stationary rotary screw compressor systems to a newly commissioned automotive manufacturing facility in India in 2024, where individual compressor units were rated at 250 kW drive power, delivered airflow volumes above 45 m³/min, and were engineered for continuous operation exceeding 8,000 running hours annually to support robotic welding, painting, and final assembly lines without production interruptions.
Rising Focus on Energy Efficiency and Operating Cost Reduction
Escalating electricity prices and tighter energy-efficiency regulations are driving end users to adopt advanced air compressor technologies with lower lifecycle costs. Compressed air is one of the most energy-intensive utilities in industrial settings, prompting companies to replace inefficient legacy systems with variable speed drive (VSD), oil-free, and high-efficiency compressors. Manufacturers are responding with improved motor efficiency, optimized airends, and intelligent control systems that reduce energy wastage during partial load operations. The growing emphasis on total cost of ownership, rather than upfront capital cost, is accelerating upgrades and retrofits, particularly in energy-intensive sectors such as manufacturing, oil & gas, and power generation.
- For instance, Ebara Corporation’s subsidiary, Elliott Group, deploys oil-free centrifugal air compressors in large industrial plants that are engineered with drive motors often exceeding 3,000 kW, single-train airflow capacities reaching or exceeding 200 m³/min (approx. 7,000 CFM), and continuous operation ratings beyond 8,000 hours per year; these systems support stable compressed air supply with minimal energy loss under baseload conditions."
Infrastructure Development and Growth in Process Industries
Large-scale infrastructure development and expansion of process industries continue to support air compressor demand. Construction of refineries, petrochemical complexes, power plants, water treatment facilities, and renewable energy installations requires compressed air for both construction and operational phases. In parallel, growth in food & beverages, pharmaceuticals, and healthcare sectors is increasing demand for oil-free and contamination-free compressed air solutions. Stringent quality and safety standards in these industries necessitate high-performance compressor systems, driving adoption of advanced technologies. Ongoing investments in industrial infrastructure across Asia Pacific, the Middle East, and parts of Africa further strengthen long-term market growth prospects.
Key Trends & Opportunities
Adoption of Smart and Connected Air Compressor Systems
Digitalization is reshaping the air compressor market through the integration of smart monitoring, sensors, and IoT-enabled control platforms. Manufacturers are increasingly offering connected compressors capable of real-time performance tracking, energy monitoring, and predictive maintenance. These systems enable users to optimize compressor utilization, reduce unplanned downtime, and extend equipment life. The growing adoption of Industry 4.0 practices presents strong opportunities for intelligent compressor solutions, particularly in large manufacturing facilities and multi-site industrial operations. Data-driven maintenance and remote diagnostics are becoming key differentiators, enhancing operational reliability and reducing maintenance costs.
- For instance, VMAC Global Technology Inc. utilizes a range of control systems across its rotary screw air compressor platforms. While the gas-powered G30 model uses a mechanical control system featuring an electronic key switch and an analog-style hour meter, advanced digital monitoring is integrated into other platforms like their hydraulic air compressors (e.g., H40 and H60).
Growing Demand for Oil-Free and Clean Air Solutions
Rising quality standards in food & beverages, pharmaceuticals, electronics, and healthcare are driving increased demand for oil-free air compressors. Contamination-free compressed air is critical in these applications to ensure product integrity and regulatory compliance. This trend presents strong growth opportunities for manufacturers offering certified oil-free technologies, including screw, scroll, and centrifugal compressors. Additionally, increasing awareness of product recalls and compliance risks is pushing end users to invest in clean air systems, creating sustained demand for premium, high-reliability compressor solutions.
- For instance, Sulzer Ltd.’s oil-free centrifugal air compressors used in pharmaceutical and electronics facilities are designed to meet ISO 8573-1 Class 0 air purity standards, deliver continuous airflow volumes up to 56 m³/min (approximately 2,000 CFM), and operate with drive motor ratings up to 325 kW (436 hp), supporting round-the-clock production environments while eliminating the risk of oil contamination in sensitive manufacturing processes."
Key Challenges
High Initial Capital Investment and Cost Sensitivity
High upfront capital costs remain a key challenge, particularly for small and medium-sized enterprises. Advanced air compressors equipped with energy-efficient motors, VSD technology, and smart monitoring systems require significant initial investment, which can deter price-sensitive buyers. In cost-driven markets, end users often prioritize lower purchase prices over long-term energy savings, slowing adoption of advanced technologies. Budget constraints and limited access to financing further restrict replacement of older, inefficient systems, especially in developing regions, impacting overall market penetration of high-efficiency compressors.
Maintenance Complexity and Operational Downtime Risks
Air compressors require regular maintenance to ensure reliable performance and energy efficiency. Complex system designs, particularly in high-capacity and oil-free compressors, increase dependency on skilled technicians and specialized spare parts. Inadequate maintenance practices can lead to air leaks, pressure losses, and unexpected breakdowns, resulting in costly downtime for industrial operations. Limited availability of trained service personnel in certain regions exacerbates this challenge. Additionally, fluctuations in operating conditions, such as temperature and air quality, can accelerate wear and reduce compressor lifespan, increasing total operating costs for end users.
Regional Analysis
North America
North America represents a mature and technologically advanced air compressor market, accounting for approximately 25-27% of global demand. Strong adoption is driven by manufacturing automation, oil & gas operations, and stringent energy-efficiency standards across the United States and Canada. Industrial upgrades, replacement of aging compressor fleets, and increasing use of variable speed drive and oil-free systems support steady demand. The region also benefits from advanced service networks and high penetration of smart, connected compressors. Growth remains stable, supported by reshoring of manufacturing activities and continued investments in energy, food processing, and healthcare infrastructure.
Europe
Europe accounts for an estimated 22-24% share of the global air compressor market, supported by strong industrial bases in Germany, France, Italy, and the UK. Demand is driven by automotive manufacturing, chemicals, food & beverages, and renewable energy projects. Strict environmental regulations and energy efficiency directives are accelerating adoption of low-emission, high-efficiency, and oil-free compressor systems. Retrofit and replacement demand remains significant as industries modernize legacy equipment to meet sustainability targets. The region also shows strong uptake of smart compressors and predictive maintenance solutions to reduce operating costs and improve compliance with operational standards.
Asia Pacific
Asia Pacific dominates the global air compressor market with the largest share of approximately 38-40%, driven by rapid industrialization and expanding manufacturing capacity in China, India, Japan, South Korea, and Southeast Asia. Strong growth in automotive, electronics, metals, and general manufacturing fuels sustained compressor installations. Infrastructure development, urbanization, and energy projects further support demand. Cost competitiveness and high-volume production favor rotary screw and stationary compressors. Additionally, increasing focus on energy efficiency and industrial automation is accelerating adoption of advanced compressor technologies, making Asia Pacific the fastest-growing and most dynamic regional market.
Latin America
Latin America holds an estimated 7-9% share of the global air compressor market, supported by manufacturing, mining, oil & gas, and food processing industries. Brazil and Mexico are key contributors, benefiting from industrial expansion and export-oriented manufacturing. Demand is driven by both new installations and replacement of older equipment, particularly in automotive and mining sectors. However, economic volatility and capital spending fluctuations can impact short-term growth. Despite this, rising industrial automation and gradual infrastructure development are improving long-term prospects, with growing interest in energy-efficient and durable compressor systems.
Middle East & Africa
The Middle East & Africa region accounts for approximately 6-8% of global air compressor demand, led by oil & gas, petrochemicals, construction, and power generation projects. Countries such as Saudi Arabia, the UAE, and South Africa are key markets due to ongoing infrastructure development and energy investments. Compressors are widely used in upstream and downstream oil & gas operations, as well as large construction projects. While market growth is moderate, increasing diversification into manufacturing, water treatment, and renewable energy is creating new demand opportunities for both stationary and portable air compressor systems.
Air Compressor Market Segmentations:
By Type
- Stationery
- Portable
By Product
- Rotary
- Screw
- Scroll
- Centrifugal
- Reciprocating
- Others
By Application
- Electronics
- Manufacturing
- Oil and Gas
- Healthcare
- Food & Beverages
- Home Appliances
- Energy
By Geography
- North America
- U.S.
- Canada
- Mexico
- Europe
- Germany
- France
- U.K.
- Italy
- Spain
- Rest of Europe
- Asia Pacific
- China
- Japan
- India
- South Korea
- South-east Asia
- Rest of Asia Pacific
- Latin America
- Brazil
- Argentina
- Rest of Latin America
- Middle East & Africa
- GCC Countries
- South Africa
- Rest of the Middle East and Africa
Competitive Landscape
The global air compressor market features a competitive landscape characterized by the presence of several multinational manufacturers alongside strong regional players. Leading companies compete on product efficiency, reliability, technological innovation, and global service capabilities. Market leaders maintain advantage through broad product portfolios covering rotary screw, centrifugal, reciprocating, and oil-free compressors, addressing diverse industrial requirements. Continuous investment in energy-efficient designs, variable speed drive technology, and digital monitoring platforms is a key competitive strategy. Strategic initiatives such as capacity expansions, product upgrades, and service network strengthening are widely adopted to enhance customer retention and lifecycle value. Additionally, manufacturers focus on aftermarket services, predictive maintenance, and long-term service contracts to secure recurring revenue. Competitive intensity remains high as players balance pricing pressure with the need to meet increasingly stringent energy efficiency and environmental standards, particularly in mature industrial markets.
Key Player Analysis
- Ebara Corporation
- VMAC Global Technology Inc.
- Mitsubishi Heavy Industries Ltd.
- Porter Cable
- Sulzer Ltd.
Recent Developments
- In November 2025, EBARA agreed to acquire Mitsubishi Electric’s three-phase and Interior Permanent Magnet (IPM) motor business, including production facilities at Mitsubishi Electric’s Shinshiro Factory in Aichi, Japan. This strategic move extends EBARA’s capabilities in high-efficiency motors that are core components of industrial compressors and rotating machinery.
- In February 2025, VMAC launched its e30 with Stealth Power, a battery-electric 30 CFM rotary screw air compressor designed for next-generation electric and hybrid service trucks. The e30 delivers continuous 30 cubic feet per minute at 100 psi, with up to 75 minutes of runtime at full output per charge enabled by advanced NMC battery integration. This development supports emission-free compressed air generation for mobile applications.
Report Coverage
The research report offers an in-depth analysis based on Type, Product, Application and Geography. It details leading market players, providing an overview of their business, product offerings, investments, revenue streams, and key applications. Additionally, the report includes insights into the competitive environment, SWOT analysis, current market trends, as well as the primary drivers and constraints. Furthermore, it discusses various factors that have driven market expansion in recent years. The report also explores market dynamics, regulatory scenarios, and technological advancements that are shaping the industry. It assesses the impact of external factors and global economic changes on market growth. Lastly, it provides strategic recommendations for new entrants and established companies to navigate the complexities of the market.
Request a Free Sample
Fill in your details and we'll send you a free sample report.
- Sample data tables & charts
- Research methodology
Need a Custom Version of This Report?
Tailor the scope, geography, or segments to your exact requirements.
- Custom geography or segment scope
- Direct access to our analyst team
Frequently Asked Questions
What is the current market size for Air Compressor, and what is its projected size in 2032?
At what Compound Annual Growth Rate is the Air Compressor market projected to grow between 2024 and 2032?
Which Air Compressor segment held the largest share in 2024?
What are the primary factors fueling the growth of the Air Compressor market?
Who are the leading companies in the Air Compressor market?
Which region commanded the largest share of the Air Compressor market in 2024?
Table of Content
Chapter 1. Report Introduction
- 1.1 Report Description & Purpose
- 1.1.1 Report Title & Market Definition
- 1.1.2 Unique Selling Propositions (USP) & Key Differentiators
- 1.1.3 Value Proposition for Stakeholders
- 1.2 Research Objectives
- 1.2.1 Market Sizing Objectives (Volume & Revenue)
- 1.2.2 Segmentation Objectives
- 1.2.3 Competitive Intelligence Objectives
- 1.2.4 Forecast & Scenario Objectives
- 1.3 Report Scope
- 1.3.1 Air Compressor Scope – Types & Subtypes Covered
- 1.3.2 Geographic Scope – Regions & Countries Covered
- 1.3.3 Historical Period, Base Year & Forecast Period (2024; forecast to 2032)
- 1.3.4 Inclusions & Exclusions
- 1.4 HS Code & Classification Framework
- 1.5 Currency, Units & Pricing Basis
- 1.6 Target Stakeholders
- 1.7 Limitations & Assumptions
Chapter 2. Executive Summary
- 2.1 Global Air Compressor Market Snapshot
- 2.1.1 Market Size – Historical (2024) & Forecast (2024-2032) (2024: USD 19,105.8 million → 2032: USD 25,158.69 million)
- 2.1.2 Volume & Revenue – Global Totals
- 2.1.3 Key Market Highlights – Top Five Facts
- 2.2 Air Compressor Market Segmentation Snapshot
- 2.2.1 Market Split by Region – 2024 vs. 2032
- 2.3 Competitive Snapshot
- 2.3.1 Top 10 Players by Revenue Share – 2024
- 2.3.2 Top 10 Players by Volume Share – 2024
- 2.3.3 Recent Strategic Developments (18-Month Summary)
- 2.4 Key Investment Highlights & Strategic Conclusions
Chapter 3. Air Compressor Market Dynamics & Industry Analysis
- 3.1 Market Overview & Context
- 3.1.1 Air Compressor Market Position in the Broader Automotive Value Chain
- 3.1.2 OEM vs. Replacement Market Dynamics
- 3.1.3 Market Maturity & Development Stage by Region
- 3.2 Air Compressor Market Drivers
- 3.3 Air Compressor Market Restraints & Challenges
- 3.4 Air Compressor Market Opportunities
- 3.5 Porter's Five Forces Analysis
- 3.5.1 Threat of New Entrants
- 3.5.2 Bargaining Power of Suppliers
- 3.5.3 Bargaining Power of Buyers
- 3.5.4 Threat of Substitutes
- 3.5.5 Competitive Rivalry – Intensity Assessment
- 3.6 Air Compressor Value Chain Analysis
- 3.6.1 Upstream – Raw Material/Input Suppliers
- 3.6.1.1 Raw Material/Input 1
- 3.6.1.2 Raw Material/Input 2
- 3.6.1.3 Raw Material/Input 3
- 3.6.2 Midstream – Production/Manufacturing/Service Delivery
- 3.6.2.1 Production/Process Overview
- 3.6.2.2 Key Facility Locations & Capacity by Manufacturer
- 3.6.3 Downstream – Distribution & End Consumer
- 3.6.3.1 Primary Channel – B2B/OEM
- 3.6.3.2 Secondary Channels – Dealer, Retail, Online, Direct
- 3.6.4 Value Chain Profitability Analysis
- 3.6.1 Upstream – Raw Material/Input Suppliers
- 3.7 PESTEL Analysis
- 3.7.1 Political Factors
- 3.7.2 Economic Factors
- 3.7.3 Social Factors
- 3.7.4 Technological Factors
- 3.7.5 Environmental Factors
- 3.7.6 Legal Factors
- 3.8 Air Compressor Supply Chain Analysis
- 3.8.1 Raw Material/Input Supply Risk Assessment
- 3.8.2 Manufacturing Concentration Risk (Geographic Exposure)
- 3.8.3 Trade Disruption Impact Analysis
- 3.9 Regulatory & Policy Landscape
Note: The regulatory and policy landscape section covers regulations based on their applicability to the market, Air Compressor category, geography, and scope of the study. Only regulatory frameworks with a material impact on operations, compliance, trade, sustainability, or market access are analyzed in detail.
Chapter 4. Key Investment Pockets & Opportunity Analysis
- 4.1 Air Compressor Market Attractiveness Analysis
- 4.1.1 By Region – Investment Attractiveness Matrix (Volume × CAGR)
- 4.2 Absolute Revenue Growth Opportunity
- 4.2.1 By Region – Absolute USD Growth Through 2032
- 4.3 Incremental Volume Opportunity
- 4.3.1 By Region – Incremental Volume Through 2032
- 4.3.2 Segment – Incremental Volume
- 4.4 Emerging Submarket Opportunity Deep Dive (Subject to Applicability)
- 4.5 Emerging Market Opportunity Scorecards
- 4.5.1 United States
- 4.5.2 Europe
- 4.5.3 Asia
- 4.5.4 Middle East & Africa
Note: Emerging Market Opportunity Scorecards will be included based on relevance and strategic importance. Regions listed are indicative and may vary depending on data availability and market dynamics.
Chapter 5. Air Compressor Import-Export Analysis & Trade Flows
- 5.1 Global Trade Overview
- 5.1.1 Global Export Value by Country (2024)
- 5.1.2 Global Export Volume by Country (2024)
- 5.1.3 Global Import Value by Country (2024)
- 5.1.4 Global Import Volume by Country (2024)
- 5.1.5 Net Trade Balance by Country (2024)
- 5.2 Export Analysis – Segment
- 5.2.1 Type 1 (HS Code)
- 5.2.2 Type 2 (HS Code)
- 5.2.3 Type 3 (HS Code)
- 5.2.4 Type 4 (HS Code)
- 5.2.5 Type 5 (HS Code)
- 5.3 Import Analysis – Segment
- 5.3.1 Type 1 (HS Code)
- 5.3.2 Type 2 (HS Code)
- 5.3.3 Type 3 (HS Code)
- 5.3.4 Type 4 (HS Code)
- 5.3.5 Type 5 (HS Code)
- 5.4 Average Unit Trade Prices
- 5.4.1 Average Export Price – Segment & Country
- 5.4.2 Average Import Price – Segment & Source Country
- 5.4.3 Price Trends (2024)
- 5.5 Key Trade Route Analysis
- 5.5.1 Trade Route 1
- 5.5.2 Trade Route 2
- 5.5.3 Trade Route 3
- 5.5.4 Trade Route 4
- 5.5.5 Trade Route 5
- 5.6 Trade Policy Impact Assessment
- 5.6.1 US Anti-Dumping & Section 301 Tariffs
- 5.6.2 EU Customs Union Impact
- 5.6.3 Major Free Trade Agreements
- 5.6.4 USMCA Rules of Origin
Note: Trade policy analysis will be included only where relevant to the Air Compressor market.
Chapter 6. Competitive Landscape & Company Benchmarking
- 6.1 Air Compressor Market Concentration & Structure
- 6.1.1 Herfindahl-Hirschman Index (HHI) – vs. 2024
- 6.1.2 Tier 1, Tier 2 & Tier 3 Market Structure
- 6.1.3 Global, Regional & Local Player Dynamics
- 6.2 Air Compressor Market Share Analysis – 2024
- 6.2.1 Global Revenue Share by Company
- 6.2.2 Global Volume Share by Company
- 6.2.3 Regional Revenue Share
- 6.2.4 Market Share Evolution ( vs. 2024)
- 6.2.5 OEM Segment Share by Company
- 6.2.6 Replacement Segment Share by Company
- 6.3 Production/Delivery Capacity & Facility Analysis
- 6.3.1 Global Installed Capacity
- 6.3.2 Capacity Utilization Rates
- 6.3.3 Production/Output Volume
- 6.3.4 Facility Locations & Capacity Map
- 6.3.5 Planned Capacity Additions
- 6.4 Air Compressor Competitive Benchmarking Matrix
- 6.4.1 Revenue, Volume, CAGR & Profitability Comparison
- 6.4.2 Channel Revenue Mix
- 6.4.3 Geographic Revenue Exposure
- 6.4.4 R&D Intensity
- 6.4.5 Sustainability Maturity
- 6.5 Strategic Developments in Air Compressor (Last 24 Months)
- 6.5.1 Mergers, Acquisitions & Divestments
- 6.5.2 New Air Compressor Launches
- 6.5.3 Facility Expansions
- 6.5.4 Strategic Alliances, Joint Ventures & Partnerships
- 6.5.5 Distribution Expansion & Market Entry
- 6.5.6 Sustainability & ESG Initiatives
- 6.6 Competitive Strategy Mapping
- 6.6.1 Leader, Challenger, Follower & Niche Classification
- 6.6.2 Pricing Strategy Comparison
- 6.6.3 Channel Strategy Matrix
Note: Strategic developments are included based on their materiality and the availability of reliable information.
Chapter 7. Global Air Compressor Market – By Distribution Channel
- 7.1 Segment Overview
- 7.1.1 Volume & Revenue Split by Channel (2024 & 2032)
- 7.1.2 Channel Mix Evolution (2024-2032)
Chapter 8. Regional Market Analysis – Global Overview
- 8.1 Global Regional Overview
- 8.1.1 Regional Volume Share
- 8.1.2 Regional Revenue Share
- 8.1.3 Regional Volume by Region
- 8.1.4 Regional Revenue by Region
- 8.1.5 Regional Forecast Through 2032
- 8.2 Cross-Regional Segment Analysis
- 8.2.1 By Distribution Channel
- 8.2.2 By Brand/Price Tier
Chapter 9. North America Air Compressor Market
- 9.1 United States
- 9.2 Canada
- 9.3 Mexico
Chapter 10. Europe Air Compressor Market
- 10.1 Germany
- 10.2 France
- 10.3 Italy
- 10.4 United Kingdom
- 10.5 Spain
- 10.6 Poland
- 10.7 Russia
- 10.8 Netherlands
- 10.9 Belgium
- 10.10 Sweden
- 10.11 Denmark
- 10.12 Norway
- 10.13 Rest of Europe
Chapter 11. Asia Pacific Air Compressor Market
- 11.1 China
- 11.2 India
- 11.3 Japan
- 11.4 South Korea
- 11.5 Thailand
- 11.6 Indonesia
- 11.7 Vietnam
- 11.8 Malaysia
- 11.9 Australia
- 11.10 Rest of Asia Pacific
Chapter 12. Latin America Air Compressor Market
- 12.1 Brazil
- 12.2 Argentina
- 12.3 Colombia
- 12.4 Chile
- 12.5 Rest of Latin America
Chapter 13. Middle East Air Compressor Market
- 13.1 Saudi Arabia
- 13.2 United Arab Emirates
- 13.3 Turkey
- 13.4 Israel
- 13.5 Iran
- 13.6 Rest of the Middle East
Chapter 14. Africa Air Compressor Market
- 14.1 South Africa
- 14.2 Egypt
- 14.3 Nigeria
- 14.4 Morocco
- 14.5 Rest of Africa
Chapter 15. Air Compressor Company Profiles
- 15.1 [Company 01]
- 15.1.1 Company Overview
- 15.1.2 Key Management Personnel
- 15.1.3 Products & Services Portfolio
- 15.1.4 Financial Performance
- 15.1.5 Key Market Focus & Geographic Presence
- 15.1.6 Recent Developments & Strategic Initiatives
Note: The company profile list is preliminary and may change based on research findings, market developments, data availability, and client requirements.
Chapter 16. Appendices
- Appendix A – List of Abbreviations & Acronyms
- Appendix B – Industry Classification Code Reference – Full Series
- Appendix C – Production & Capacity Data Tables
- Appendix D – End-Use & Demand Base Tables
- Appendix E – Consumption & Replacement Rate Assumptions
- Appendix F – ASP Reference Tables
- Appendix G – Manufacturing & Facility Database
- Appendix H – Import-Export Data Tables
- Appendix I – Regulatory Summary Tables
- Appendix J – Primary Research Participant List (Anonymized)
- Appendix K – Primary Research Questionnaire Framework
- Appendix L – Data Sources & Bibliography
- Appendix M – Market Size Divergence & Source Comparison
Chapter 17. Research Methodology
- 17.1 Research Framework & Philosophy
- 17.2 Secondary Research – Sources, Hierarchy & Data Extraction
- 17.3 Data Modeling – Bottom-Up & Top-Down Market Sizing
- 17.4 Primary Research – Stakeholder Framework, LOI & Sample Sizes
- 17.5 Forecast Methodology – Regression, Scenario & Sensitivity Analysis
- 17.6 Quality Control – Four-Layer Validation Framework
- 17.7 Limitations & Standard Assumptions
- 17.8 Disclaimer
