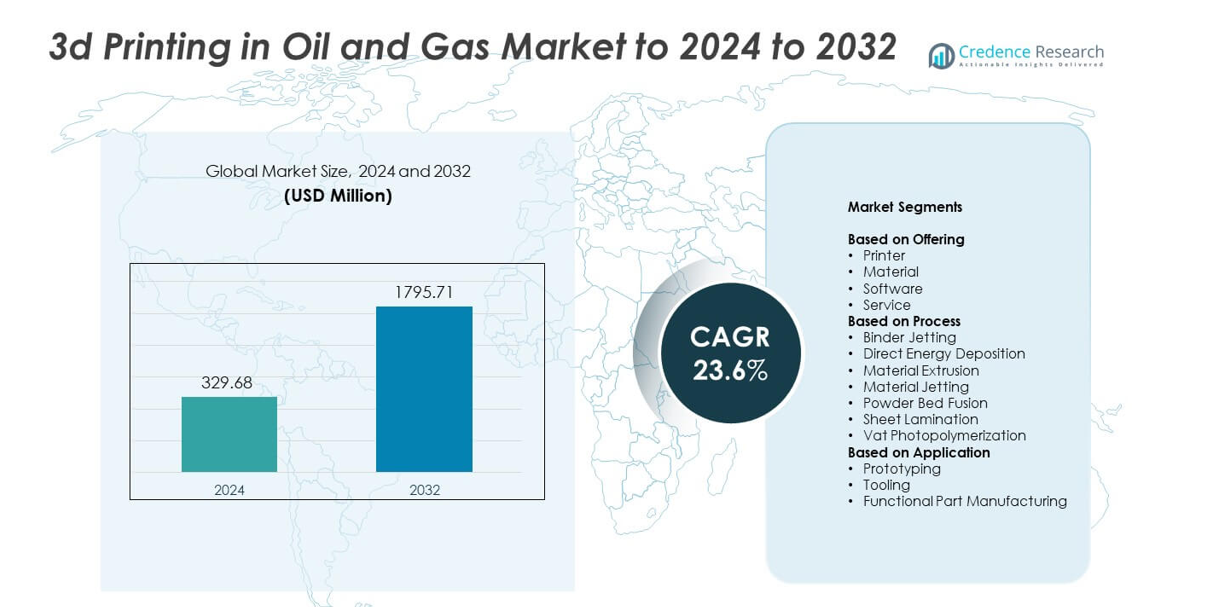
Home » Energy » Energy Utilities » 3D Printing in Oil and Gas Market

3D Printing in Oil and Gas Market By Manufacturing Of Components (Customized parts, Prototyping); By Supply Chain Optimization (On-Demand Manufacturing, Reducing Dependence on Suppliers); By Materials Development (Advanced Materials, High-Performance Polymers and Metals); By Retrofitting And Maintenance (Retrofitting existing components, Replacement parts); By Tooling And Equipment Production (Custom Tooling, Jigs and Fixtures); By Prototyping And Design Optimization (Rapid Prototyping, Design Iterations); By Reducing Weight And Enhancing Performance (Topology Optimization, Complex Geometries); By Drilling And Exploration Applications (Customized Drilling Tools, Sensor Housings); By Sustainability And Environmental Impact (Reduced Material Waste, Localized Production); By Certification And Standardization (Industry Standards, Regulatory Compliance); By Collaborative Initiatives (Partnerships and consortia); By Remote And Harsh Environments (On-Site 3D Printing, Adaptation to Extreme Conditions); By Region – Growth, Future Prospects & Competitive Analysis, 2022 – 2030

Price: $4999

Published: | Report ID: 31968 | Report Format : PDF

Market Insights

  • The global demand for 3D printing in oil and gas was valued at USD 215.8 million in 2022 and is expected to reach USD 1190.73 million in 2030, growing at a CAGR of 23.80% between 2023 and 2030.
  • Customized parts are the most significant component of manufacturing. On the other hand, prototyping is expected to grow at a strong CAGR.
  • The leading supply chain optimization segment is on-demand manufacturing.
  • The CAGR for high-performance polymers and metals is expected to be the highest during the projection period.
  • During the forecast time frame, the retrofitting existing components category will likely have the highest CAGR.
  • Custom tooling is estimated to have the greatest CAGR during the forecast period.
  • The rapid prototyping segment will likely have the highest CAGR during the prediction period.
  • Topology optimization represents the largest category of reducing weight and enhancing performance.
  • The customized drilling tools segment will see the highest CAGR during the anticipated period.
  • The reduced material waste category is estimated to develop at a strong CAGR.
  • Over the anticipated timeframe, the industry standards category is expected to expand at the fastest compound annual growth rate (CAGR).
  • The category with the highest compound annual growth rate (CAGR) over the predicted period is partnerships and consortia.
  • The segment with the highest CAGR during the forecast period will probably be on-site 3D printing.
  • Asia Pacific dominated the 3D printing in the oil and gas market.
  • Europe is expected to be the second-largest region in the market for 3D printing in oil and gas.
  • North America is anticipated to grow fastest in the market for 3D printing in oil and gas.
  • The oil and gas industry is witnessing a surge in the use of 3D printing due to several advantages, such as expedited prototyping, shortened delivery lead times, notable downtime reduction, and cost-effectiveness.
  • The market is anticipated to benefit greatly from supply chain management optimization, which reduces manufacturing time, requires less warehousing, and requires less inventory.

3D Printing in Oil and Gas Market

Design Element 2

Access crucial information at unmatched prices!

Request your free sample report today & start making informed decisions powered by Credence Research!

Download Free Sample
CTA Design Element 3

Executive Summary

Market Definition

The application and uptake of additive manufacturing technologies in the oil and gas sector is referred to as the market for 3D printing in this industry. The process of layering or adding material to create three-dimensional objects is known as additive manufacturing or 3D printing. This process is usually done digitally and layer by layer. Within the oil and gas industry, additive manufacturing (AM) technologies are utilized to fabricate various parts, components, and instruments for utilization in the exploration, production, refinement, and distribution procedures.

Market Overview

3D printing in the oil and gas industry has been growing significantly in recent years, and it is projected to grow at a CAGR of 23.80% between 2023 and 2030. The market was estimated to be worth USD 215.8 million in 2022, and it is anticipated to be worth USD 1190.73 million in 2030.

3D printing in the oil and gas market is propelled by the need to lower expenses, boost operational effectiveness, and tackle particular issues in the business. With advancements in technology and the growing adoption of additive manufacturing by oil and gas companies, new developments in materials, processes, and applications are anticipated to drive market evolution. The possibilities for producing components with improved durability, corrosion resistance, and other qualities essential for the harsh environments frequently encountered in the oil and gas sector are growing due to ongoing research and development in 3D printing materials.

Customized and intricate parts that would be difficult or costly to manufacture with conventional techniques can now be produced through 3D printing. This comprises pumps, valves, and other machinery designed to meet particular operational requirements. Because it makes it possible to manufacture replacement parts on-site or as needed, 3D printing can improve the efficiency of the supply chain. This can lessen the need for large inventories and help avoid the delays of using traditional supply chains.  Rapid replacement part production can reduce downtime during maintenance and repair procedures, which boosts operational effectiveness.

Segmentation by manufacturing of components

  • By manufacturing components, customized parts are the market front-runner. It is possible to design customized 3D-printed parts with optimized structures, minimizing wasteful material and lowering overall weight. This is especially crucial for oil and gas applications like aerospace, where weight impacts transportation expenses and fuel efficiency.
  • The prototyping category will exhibit a sizable CAGR during the projected period. Using additive manufacturing technologies to make physical models or prototypes of parts, tools, and equipment before mass production is known as prototyping in the context of 3D printing in the oil and gas industry. With this process, oil and gas companies can evaluate designs, identify potential improvements or modifications, and quickly iterate and test them.

Segmentation by Supply chain Optimization

  • The main supply chain optimization category is on-demand manufacturing. Prototyping and iteration can happen quickly with on-demand manufacturing. Prototypes of tools or components can be made by engineers and designers using 3D printing, which speeds up development cycles and improves design optimization.
  • The reduced dependence on suppliers will likely register a significant CAGR during forecasting. One of the strategic benefits of 3D printing’s adoption in the oil and gas industry is a decrease in supplier dependency. The ability of businesses in the sector to use 3D printing technology to produce specific parts and components locally or internally rather than heavily depending on outside suppliers is the subject of this point.

Segmentation by Materials Development

  • It is predicted that the high-performance polymers and metals category will grow fastest over the projection period. High-performance polymers resistant to abrasive chemicals are frequently selected for use in 3D printing for the oil and gas industry. This is especially crucial in settings where workers frequently come into contact with corrosive materials, like chemical processing facilities or the transportation of corrosive fluids.
  • Advanced materials also contribute to the demand for 3D printing in oil and gas.

Segmentation by Retrofitting and Maintenance

  • During the projection period, the retrofitting existing components category will likely have the highest CAGR. In the oil and gas industry, retrofitting old components with 3D printing entails using additive manufacturing technologies to improve or alter old machinery, parts, or components.
  • Replacement parts also contribute to the demand for 3D printing in oil and gas.

Segmentation by Tooling and Equipment Production

  • Custom tooling will be expected to have the foremost CAGR during the prediction period. Custom tooling refers to making specialized tools with additive manufacturing technologies in the context of 3D printing for the oil and gas industry. This method offers benefits in terms of cost-effectiveness, speed, and customization by creating and manufacturing tools specifically suited to the needs of the oil and gas sector.
  • Other tooling and equipment production, such as jigs and fixtures, also contribute to the demand for 3D printing in oil and gas.

Segmentation by Prototyping and Design Optimization

  • Throughout the forecast duration, the category for rapid prototyping is anticipated to have the greatest CAGR. It is possible for engineers and designers to quickly iterate on their designs with rapid prototyping. This is especially helpful in the oil and gas sector, where complex and customized components are frequently needed.
  • Design iterations also contribute to the demand for 3D printing in oil and gas.

Segmentation by Reducing Weight and Enhancing Performance

  • The highest CAGR is anticipated for topology optimization throughout estimation. Iterative simulations are used in topology optimization to examine various design space configurations. To achieve the best structural performance under the given loads and constraints, the software iteratively redistributes material within the specified boundaries.
  • Other reducing weight and enhancing performance, such as complex geometries, also contribute to the demand for 3D printing in oil and gas.

Segmentation by Drilling and Exploration Applications

  • Over the estimation period, customized drilling tools are expected to have the greatest CAGR. A wide range of materials with qualities ideal for the harsh circumstances involved in drilling operations can be used to create customized drilling tools. Materials can be selected based on attributes like hardness, wear resistance, and corrosion resistance to guarantee optimum performance.
  • Sensor housings also contribute to the demand for 3D printing in oil and gas.

Segmentation by Sustainability and Environmental Impact

  • Over the estimated timeframe, the reduced material waste segment is anticipated to experience the highest CAGR. The ability to maximize the use of materials during the manufacturing and production processes is known as reduced material waste in the oil and gas market, and it is made possible by 3D printing or additive manufacturing technologies. Subtractive processes are frequently used in traditional manufacturing methods, where raw materials are machined, molded, or cut to create the final product.
  • Other sustainability and environmental impacts, such as localized production, also contribute to the demand for 3D printing in oil and gas.

Segmentation by Certification and Standardization

  • During the projection period, the category with the largest compound annual growth rate will likely be industry standards. Industry standards in the oil and gas sector refer to a set of rules, guidelines, and best practices that have been developed and are generally recognized by associations, authorities, and industry professionals.
  • Regulatory compliance also contributes to the demand for 3D printing in oil and gas.

Segmentation by Collaborative Initiatives

  • Partnerships and consortia are predicted to have the most prominent CAGR during the estimation period. In the oil and gas sector, partnerships are agreements between two or more businesses to collaborate on projects, endeavors, or initiatives. Usually, the goals of these partnerships are to attain mutual benefits, share expenses and risks, and capitalize on each partner’s strengths.

Segmentation by Remote and Harsh Environments

  • On-site 3D printing will have the highest CAGR over the forecast period. Oil and gas companies can react swiftly to unforeseen equipment failures or the need for specialized components due to on-site 3D printing. Companies can manufacture replacement parts on-site, reducing downtime and operational disruptions instead of waiting for them to be manufactured off-site and delivered.
  • Adaptation to extreme conditions also contributes to the demand for 3D printing in oil and gas.

Segmentation by Region

  • Asia Pacific leads the 3D printing in the oil and gas market. The demand for energy, particularly oil and gas, has surged due to the Asia Pacific region’s rapid industrialization and economic development. This growth necessitates using effective and cutting-edge technologies like 3D printing to improve operations and address particular industry challenges.
  • Europe is estimated to rank second in market size for 3D printing in oil and gas.
  • North America will witness the most rapid growth in 3D printing in the oil and gas market.
  • The remaining 3D printing in oil and gas demand is satisfied by world regions, such as Africa, the Middle East, and Latin America.

3D Printing in Oil and Gas Market Research

The increasing demand for accountability and traceability, trade and transportation optimisation, and profit-sharing and royalty control is driving the global oil and gas industry’s use of 3D printing.

During forecasting, Asia Pacific will probably rule the 3D printing in the oil and gas market. Innovative technologies like 3D printing are required to increase efficiency and lower costs due to the increased exploration and production activities brought on by the rising demand for energy in emerging economies. Increased investments in a variety of industries, including the oil and gas sector, are a result of the Asia Pacific region’s countries experiencing rapid economic growth. Opportunities for the adoption of cutting-edge technologies like 3D printing are created by this economic growth. Businesses in the Asia-Pacific area frequently collaborate and form strategic alliances with universities and tech companies. These collaborations make it easier to develop 3D printing applications and technologies specifically suited to the demands of the oil and gas industry.

The Asia-Pacific area has embraced and applied cutting-edge technologies with initiative. Countries like China, Japan, South Korea, and Singapore have demonstrated a willingness to invest in and implement 3D printing technology for various uses, including the oil and gas industry. Several Asia Pacific nations boast highly educated and proficient labor forces, especially in science, engineering, and technology. This allows the area to lead in 3D printing research and development within the oil and gas industry.

The North American area is projected to grow fastest throughout the forecast. Major energy companies are widely distributed throughout North America, and many have been actively investigating and implementing new technologies to improve productivity and efficiency. The willingness of the oil and gas sector to embrace new ideas has prompted the incorporation of 3D printing into several operations, including production and exploration. Complex and highly customized components are frequently needed by the oil and gas industry. Such complex parts may be difficult for traditional manufacturing techniques to create, but 3D printing is excellent at producing complex geometries and customized solutions. The region’s adoption of 3D printing is mostly driven by this capability. The US has served as a center for technological innovation in North America. A strong ecosystem of research and development exists in the area, which promotes the development of 3D printing technologies.

Key Highlights of the Report

The global 3D printing in oil and gas market is segmented by manufacturing of components, supply chain optimization, materials development, retrofitting and maintenance, tooling and equipment production, prototyping and design optimization, reducing weight and enhancing performance, drilling and exploration applications, sustainability and environmental impact, certification and standardization, collaborative initiatives, remote and harsh environments, and region. In terms of manufacturing components, customized parts lead the industry. Topology optimization is the top segment. During the forecast period, the customized drilling tools category is expected to grow at the highest CAGR. The on-site 3D printing is anticipated to experience the highest CAGR during the forecast period. The market for 3D printing in oil and gas is expanding at a rapid pace in Asia Pacific.

To advance technology, research and development is a prerequisite. Research into 3D printing in the oil and gas sector is ongoing, resulting in new ideas, better materials, and better printing techniques. The industry can best utilize 3D printing for a variety of applications and solve particular problems due to this ongoing innovation. Research and development efforts clarify how intricate and highly customized components can be produced using 3D printing. By funding research, businesses can fully utilize additive manufacturing to design and create parts with complex geometries that would be difficult or impossible to produce through conventional manufacturing processes. The 3D printing procedures for use in the oil and gas industry are improved and optimized through research.

However, according to forecasts, Asia Pacific will hold the largest market share for 3D printing in oil and gas globally. The Asia Pacific region is distinguished by a swiftly expanding populace and a rising need for energy. The oil and gas sector is pressured to innovate and streamline operations to meet this demand. Solutions for more effective equipment production and maintenance in the energy sector may be found with 3D printing. The North American region is also assumed to have the market’s sharpest growth. The adoption of advanced manufacturing technologies, such as 3D printing, has been relatively high in North America, a hub for technological innovation. The availability of state-of-the-art research facilities and technology in the region supports expanding 3D printing applications in various industries, including the oil and gas sector.

Which Key Factors Are Driving Global 3D Printing In the Oil And Gas Market?

The enhanced resistance to corrosion, tooling-free manufacturing, supply chain robustness, and sophisticated inspection procedures are propelling the rise of 3D printing in the oil and gas industry.

What Are The Key Challenges In The Global Market For 3D Printing In Oil And Gas?

Limited material testing data, post-processing requirements, non-uniformity in design tools, and material constraints hinder the expansion of 3D printing in the oil and gas industry.

What Market Opportunities Exist For 3D Printing In Oil And Gas Globally?

The oil and gas industry offers a plethora of potential for 3D printing, including the fabrication of replacement parts, supply chain disruption mitigation, customized equipment manufacturing, and digital supply chain integration.

Market Drivers

Several factors influence the market for 3D printing in oil and gas globally. The main factors influencing the market for 3D printing in oil and gas globally are as follows:

Enabling On-Site 3D Printing For Remote Locations

The distance between remote oil and gas facilities and centralized manufacturing hubs frequently presents logistical challenges. By reducing reliance on external supply chains for essential components and spare parts, on-site 3D printing helps mitigate shipping and transportation delays. The expense and time it takes to transport replacement parts from far-off manufacturing facilities can cause extended downtime during maintenance and repair operations in remote areas. By enabling the quick production of required parts, on-site 3D printing reduces downtime and maximizes operational effectiveness. Unpredictable events, like severe weather or unplanned equipment failures, are common in remote areas. An adaptable and quick solution to these problems is offered by on-site 3D printing, which enables users to produce replacement parts or tools on demand. Heavy and bulky component transportation to remote locations can be expensive. By reducing transportation expenses, on-site 3D printing helps to lower overall costs in the supply chain and logistics related to the upkeep and operation of remote oil and gas facilities. In the early stages of exploring remote areas with little infrastructure, on-site 3D printing can be very helpful. It makes it possible to produce prototypes and customized parts quickly, which is crucial for testing and modifying equipment to fit the unique requirements of a new location.

Market Restraints

Several challenges could prevent the expansion of the global market for 3D printing in oil and gas. Among them are the following:

Large Initial Investment

The materials used in 3D printing for the oil and gas industry can be costly because they frequently need to meet strict industry standards. The cost of specialized alloys and high-performance polymers that can withstand the severe conditions found in the oil and gas industry may be higher than average, which raises the overall cost of operations. Purchasing cutting-edge 3D printing machinery, particularly industrial-grade units that can satisfy the particular needs of the oil and gas sector necessitates a sizeable initial outlay of funds. For many businesses, especially smaller or mid-sized ones, the cost of buying 3D printers and any required supporting hardware and software can be a major obstacle. 3D printing is a rapidly developing field with ongoing improvements in both hardware and software. Companies investing in 3D printing equipment may encounter the issue of equipment obsolescence due to the quick speed of innovation. To maintain competitiveness, one must upgrade to newer, more sophisticated models, which raises the total cost of ownership. Although customization and on-demand production are two advantages of 3D printing, achieving economies of scale that will pay for the initial investment can be difficult. It could be challenging for some businesses to produce enough spare parts or components in large enough quantities to cover the high initial and ongoing costs.

Opportunities

The global market for 3D printing in oil and gas presents significant potential opportunities. The following is an example of these:

Integrating Wireless Communication Devices Into 3D-printed Parts

The number of components required in a system can be reduced by creating multifunctional parts by integrating wireless communication devices during the 3D printing. This contributes to increased reliability by streamlining assembly procedures and lowering the chance of component failure. Lightweight structures can be produced using 3D printing without compromising strength. Reduced equipment weight can be achieved by directly embedding wireless communication devices into 3D-printed parts. This is especially helpful for uses where weight is crucial to performance and efficiency, like unmanned aerial vehicles (UAVs) and remote sensing equipment used in the oil and gas industry. The integration of wireless communication devices into 3D-printed parts can enable equipment control and monitoring from a distance. In the oil and gas industry, where operations are frequently carried out in isolated or dangerous areas, this is vital. Transmitting data in real-time improves decision-making and adds to overall operational safety. Wireless communication devices can be integrated into the 3D printing process to minimize the need for extra parts and assembly steps. This can reduce the risk of supply chain disruptions and result in cost savings in manufacturing and supply chain management.

Competitive Landscape

3D Printing in Oil and Gas Market Report

Shape Your Report to Specific Countries or Regions & Enjoy 30% Off!

Key Players

The global market for 3D printing in oil and gas is very competitive, with many powerful players. Some of the leading market participants and their corresponding market shares are listed below:

  • Proto Labs, Inc.
  • SLM Solutions Group AG
  • EnvisionTEC GmbH
  • Stratasys Ltd.
  • 3D Systems Corporation
  • Materialise NV
  • Optomec Inc.
  • Voxeljet AG
  • The Exone Company
  • Arcam Group
  • Others

To stay competitive, these businesses prioritize product development, distribution network expansion, and mergers and acquisitions.

Leading rivals in the global 3D printing in the oil and gas market always seek new products and innovations to get an edge.

In April 2023, Covestro AG’s additive manufacturing materials business was acquired by Stratasys Ltd., a prominent player in the polymer 3D printing industry. With global development, sales teams in Europe, the US, and Asia, and R&D facilities and activities are all part of the acquisition.

In October 2022, AML3D The Australian 3D printing company extended its collaboration with the Boing aircraft manufacturer. As part of a rigorous testing process, Boeing gave AML3D the task of 3D printing aluminum prototype airplane components earlier this year. They underwent testing by AS9100D quality assurance standards for “fly” parts. Expanding upon this agreement, it has now been determined to add more 3D-printed components to the project, bringing the total value up to 150%.

Summary of Key Findings

  • The 3D printing in the oil and gas sector continues to grow because of business and government support.
  • The market is segmented by manufacturing of components, supply chain optimization, materials development, retrofitting and maintenance, tooling and equipment production, prototyping and design optimization, reducing weight and enhancing performance, drilling and exploration applications, sustainability and environmental impact, certification and standardization, collaborative initiatives, remote and harsh environments, and region.
  • The most popular manufacturing of components in the market is customized parts.
  • The most ubiquitous fragments of collaborative initiatives are partnerships and consortia.
  • Regarding CAGR, rapid prototyping is expected to grow fastest during the forecast period.
  • The topology optimization category will likely see the highest CAGR during the anticipated time frame.
  • Asia Pacific is leading market development; the market is highly competitive with key players including Proto Labs, Inc., SLM Solutions Group AG, EnvisionTEC GmbH, Stratasys Ltd., 3D Systems Corporation, Materialise NV, Optomec Inc., Voxeljet AG, The Exone Company, Arcam Group, and others.

Future Outlook

  • Optimistic viewpoint for the global 3D printing in the oil and gas market with noteworthy growth potential in the Asia Pacific region.
  • Rapid design and testing are among the primary factors supporting the growth of 3D printing in the oil and gas industry.
  • During the projected time, the market’s growth may face major challenges due to the substantial upfront investment.
  • Foremost companies must concentrate on product innovation, expanding their market reach, and maintaining competitive pricing to stay ahead.

How CXOs Can Benefit from the Credence Research 3D Printing in Oil and Gas Market Report

The Credence Research 3D Printing in Oil and Gas Market Report provides CXOs with a comprehensive overview of the market, including:

  • Market size and growth forecast: The report provides detailed estimates of the global 3D printing in oil and gas market size, segmented by manufacturing of components, supply chain optimization, materials development, retrofitting and maintenance, oil and gas trading platforms, prototyping and design optimization, reducing weight and enhancing performance, drilling and exploration applications, sustainability and environmental impact, certification and standardization, collaborative initiatives, remote and harsh environments, and region. It also includes forecasts for the market through 2032 based on key trends and drivers.
  • Market segmentation: The report segments the 3D printing in the oil and gas market by manufacturing of components, supply chain optimization, materials development, retrofitting and maintenance, oil and gas trading platforms, prototyping and design optimization, reducing weight and enhancing performance, drilling and exploration applications, sustainability and environmental impact, certification and standardization, collaborative initiatives, remote and harsh environments, and region. This segmentation provides CXOs with a granular understanding of the market and the opportunities in each segment.
  • Competitive landscape: The report profiles the key players in 3D printing in the oil and gas market and provides insights into their strategies, product offerings, and financial performance. This information can help CXOs to identify and assess their competition.
  • Key trends and drivers:The report identifies and analyzes the key trends and drivers shaping 3D printing in the oil and gas market. This information can help CXOs to make informed decisions about their investments and strategies.

CXOs can use the insights from the Credence Research 3D printing in Oil and Gas Market Report to:

  • Identify growth opportunities: The report can help CXOs identify new growth opportunities in 3D printing in the oil and gas market. For example, the report identifies the growing demand for 3D printing in oil and gas from the oilfield services industry as a key opportunity.
  • Make informed investment decisions: The report can help CXOs make informed investment decisions about 3D printing in oil and gas. For example, the report provides insights into the key factors to consider when evaluating 3D printing in oil and gas providers and selecting 3D printing in oil and gas solutions.
  • Develop competitive strategies: The report can help CXOs develop competitive strategies for their 3D printing in oil and gas businesses. For example, the report identifies the key strategies that 3D printing in oil and gas providers are using to differentiate themselves from their competitors.
  • Track market developments: The report can help CXOs track market developments and stay ahead of the curve. For example, the report provides insights into the latest trends and innovations in the 3D printing in oil and gas market.

Overall, the Credence Research 3D Printing in Oil and Gas Market Report is a valuable resource for CXOs who are looking to gain a deeper understanding of the market and identify growth opportunities.

Segmentation

  • By Manufacturing Of Components
    • Customized parts
    • Prototyping
  • By Supply Chain Optimization
    • On-Demand Manufacturing
    • Reducing Dependence on Suppliers
  • By Materials Development
    • Advanced Materials
    • High-Performance Polymers and Metals
  • By Retrofitting And Maintenance
    • Retrofitting existing components
    • Replacement parts
  • By Tooling And Equipment Production
    • Custom Tooling
    • Jigs and Fixtures
  • By Prototyping And Design Optimization
    • Rapid Prototyping
    • Design Iterations
  • By Reducing Weight And Enhancing Performance
    • Topology Optimization
    • Complex Geometries
  • By Drilling And Exploration Applications
    • Customized Drilling Tools
    • Sensor Housings
  • By Sustainability And Environmental Impact
    • Reduced Material Waste
    • Localized Production
  • By Certification And Standardization
    • Industry Standards
    • Regulatory Compliance
  • By Collaborative Initiatives
    • Partnerships and consortia
  • By Remote And Harsh Environments
    • On-Site 3D Printing
    • Adaptation to Extreme Conditions
  • By Region
    • North America
      • The U.S.
      • Canada
      • Mexico
    • Europe
      • Germany
      • France
      • The U.K.
      • Italy
      • Spain
      • Rest of Europe
    • Asia Pacific
      • China
      • Japan
      • India
      • South Korea
      • South-east Asia
      • Rest of Asia Pacific
    • Latin America
      • Brazil
      • Argentina
      • Rest of Latin America
    • Middle East & Africa
      • GCC Countries
      • South Africa
      • Rest of the Middle East and Africa

Table of Content
1. Preface
1.1. Report Description
1.1.1. Purpose of the Report
1.1.2. Target Audience
1.1.3. USP and Key Offerings
1.2. Research Scope
1.3. Market Introduction
2. Executive Summary
2.1. Market Snapshot: Global 3D Printing in Oil and Gas Market
2.1.1. Global 3D Printing in Oil and Gas Market, By Manufacturing of Components
2.1.2. Global 3D Printing in Oil and Gas Market, By Supply Chain Optimization
2.1.3. Global 3D Printing in Oil and Gas Market, By Materials Development
2.1.4. Global 3D Printing in Oil and Gas Market, By Retrofitting and Maintenance
2.1.5. Global 3D Printing in Oil and Gas Market, By Tooling and Equipment Production
2.1.6. Global 3D Printing in Oil and Gas Market, By Prototyping and Design Optimization
2.1.7. Global 3D Printing in Oil and Gas Market, By Reducing Weight and Enhancing Performance
2.1.8. Global 3D Printing in Oil and Gas Market, By Drilling and Exploration Applications
2.1.9. Global 3D Printing in Oil and Gas Market, By Sustainability and Environmental Impact
2.1.10. Global 3D Printing in Oil and Gas Market, By Certification and Standardization
2.1.11. Global 3D Printing in Oil and Gas Market, By Collaborative Initiatives
2.1.12. Global 3D Printing in Oil and Gas Market, By Remote and Harsh Environments
2.1.13. Global 3D Printing in Oil and Gas Market, By Region
2.2. Insights from Primary Respondents
3. Market Dynamics & Factors Analysis
3.1. Introduction
3.1.1. Global 3D Printing in Oil and Gas Market Value, 2017-2030, (US$ Mn)
3.1.2. Y-o-Y Growth Trend Analysis
3.2. Market Dynamics
3.2.1. 3D Printing in Oil and Gas Market Drivers
3.2.2. 3D Printing in Oil and Gas Market Restraints
3.2.3. 3D Printing in Oil and Gas Market Opportunities
3.2.4. Major 3D Printing in Oil and Gas Industry Challenges
3.3. Growth and Development Patterns
3.4. Investment Feasibility Analysis
3.5. Market Opportunity Analysis
3.5.1. Manufacturing of Components
3.5.2. Supply Chain Optimization
3.5.3. Materials Development
3.5.4. Retrofitting and Maintenance
3.5.5. Tooling and Equipment Production
3.5.6. Prototyping and Design Optimization
3.5.7. Reducing Weight and Enhancing Performance
3.5.8. Drilling and Exploration Applications
3.5.9. Sustainability and Environmental Impact
3.5.10. Certification and Standardization
3.5.11. Collaborative Initiatives
3.5.12. Remote and Harsh Environments
3.5.13. Geography
4. Market Competitive Landscape Analysis
4.1. Company Market Share Analysis, 2022
4.1.1. Global 3D Printing in Oil and Gas Market: Company Market Share, Value 2022
4.1.2. Global 3D Printing in Oil and Gas Market: Top 6 Company Market Share, Value 2022
4.1.3. Global 3D Printing in Oil and Gas Market: Top 3 Company Market Share, Value 2022
4.2. Global 3D Printing in Oil and Gas Market: Company Revenue Share Analysis, 2022
4.3. Company Assessment Metrics, 2022
4.3.1. Stars
4.3.2. Emerging Leaders
4.3.3. Pervasive Players
4.3.4. Participants
4.4. Startups/ SMEs Assessment Metrics, 2022
4.4.1. Progressive Companies
4.4.2. Responsive Companies
4.4.3. Dynamic Companies
4.4.4. Starting Blocks
4.5. Strategic Development
4.5.1. Acquisition and Mergers
4.5.2. New Product Launch
4.5.3. Regional Expansion
4.5.4. Partnerships
4.6. Key Player Product Matrix
4.7. Potential for New Players in the Global 3D Printing in Oil and Gas Market
5. Premium Insights
5.1. STAR (Situation, Task, Action, Results) Analysis
5.2. Porter’s Five Forces Analysis
5.2.1. Threat of New Entrants
5.2.2. Bargaining Power of Buyers/Consumers
5.2.3. Bargaining Power of Suppliers
5.2.4. Threat of Substitute Types
5.2.5. Intensity of Competitive Rivalry
5.3. PESTEL Analysis
5.3.1. Political Factors
5.3.2. Economic Factors
5.3.3. Social Factors
5.3.4. Technological Factors
5.3.5. Environmental Factors
5.3.6. Legal Factors
5.4. Key Market Trends
5.4.1. Demand Side Trends
5.4.2. Supply Side Trends
5.5. Value Chain Analysis
5.6. Technology Analysis
5.6.1. Research and development in the global market
5.6.2. Patent Analysis
5.6.3. Emerging technologies and their potential disruption to the market
5.7. Consumer Behaviour Analysis
5.7.1. Consumer Preferences and Expectations
5.7.2. Factors Influencing Consumer Buying Decisions
5.7.2.1. North America
5.7.2.2. Europe
5.7.2.3. Asia Pacific
5.7.2.4. Latin America
5.7.2.5. Middle East and Africa
5.7.3. Consumer Pain Points
5.8. Analysis and Recommendations
5.9. Adjacent Market Analysis
6. Market Positioning of Key Players, 2022
6.1. Company market share of key players, 2022
6.2. Competitive Benchmarking
6.3. Market Positioning of Key Vendors
6.4. Geographical Presence Analysis
6.5. Major Strategies Adopted by Key Players
6.5.1. Key Strategies Analysis
6.5.2. Mergers and Acquisitions
6.5.3. Partnerships
6.5.4. Product Launch
6.5.5. Geographical Expansion
6.5.6. Others
7. Impact Analysis of COVID 19 and Russia – Ukraine War on 3D Printing in Oil and Gas Market
7.1. Ukraine-Russia War Impact
7.1.1. Uncertainty and Economic Instability
7.1.2. Supply chain disruptions
7.1.3. Regional market shifts
7.1.4. Shift in government priorities
7.2. COVID-19 Impact Analysis
7.2.1. Supply Chain Disruptions
7.2.2. Demand Fluctuations
7.2.3. Shift in Product Mix
7.2.4. Reduced Industrial Activity
7.2.5. Regional Impact Analysis
7.2.5.1. North America
7.2.5.2. Europe
7.2.5.3. Asia Pacific
7.2.5.4. Latin America
7.2.5.5. Middle East and Africa
8. Global 3D Printing in Oil and Gas Market, By Manufacturing of Components
8.1. Global 3D Printing in Oil and Gas Market Overview, by Manufacturing of Components
8.1.1. Global 3D Printing in Oil and Gas Market Revenue Share, By Manufacturing of Components, 2022 Vs 2030 (in %)
8.2. Customized Parts
8.2.1. Global 3D Printing in Oil and Gas Market, By Customized Parts, By Region, 2017-2030 (US$ Mn)
8.2.2. Market Dynamics for Customized Parts
8.2.2.1. Drivers
8.2.2.2. Restraints
8.2.2.3. Opportunities
8.2.2.4. Trends
8.3. Prototyping
8.3.1. Global 3D Printing in Oil and Gas Market, By Prototyping, By Region, 2017-2030 (US$ Mn)
8.3.2. Market Dynamics for Prototyping
8.3.2.1. Drivers
8.3.2.2. Restraints
8.3.2.3. Opportunities
8.3.2.4. Trends
9. Global 3D Printing in Oil and Gas Market, By Supply Chain Optimization
9.1. Global 3D Printing in Oil and Gas Market Overview, by Supply Chain Optimization
9.1.1. Global 3D Printing in Oil and Gas Market Revenue Share, By Supply Chain Optimization, 2022 Vs 2030 (in %)
9.2. On-Demand Manufacturing
9.2.1. Global 3D Printing in Oil and Gas Market, By On-Demand Manufacturing, By Region, 2017-2030 (US$ Mn)
9.2.2. Market Dynamics for On-Demand Manufacturing
9.2.2.1. Drivers
9.2.2.2. Restraints
9.2.2.3. Opportunities
9.2.2.4. Trends
9.3. Reducing Dependence on Suppliers
9.3.1. Global 3D Printing in Oil and Gas Market, By Reducing Dependence on Suppliers, By Region, 2017-2030 (US$ Mn)
9.3.2. Market Dynamics for Reducing Dependence on Suppliers
9.3.2.1. Drivers
9.3.2.2. Restraints
9.3.2.3. Opportunities
9.3.2.4. Trends
10. Global 3D Printing in Oil and Gas Market, By Materials Development
10.1. Global 3D Printing in Oil and Gas Market Overview, by Materials Development
10.1.1. Global 3D Printing in Oil and Gas Market Revenue Share, By Materials Development, 2022 Vs 2030 (in %)
10.2. Advanced Materials
10.2.1. Global 3D Printing in Oil and Gas Market, By Advanced Materials, By Region, 2017-2030 (US$ Mn)
10.2.2. Market Dynamics for Advanced Materials
10.2.2.1. Drivers
10.2.2.2. Restraints
10.2.2.3. Opportunities
10.2.2.4. Trends
10.3. High-Performance Polymers and Metals
10.3.1. Global 3D Printing in Oil and Gas Market, By High-Performance Polymers and Metals, By Region, 2017-2030 (US$ Mn)
10.3.2. Market Dynamics for High-Performance Polymers and Metals
10.3.2.1. Drivers
10.3.2.2. Restraints
10.3.2.3. Opportunities
10.3.2.4. Trends
11. Global 3D Printing in Oil and Gas Market, By Retrofitting and Maintenance
11.1. Global 3D Printing in Oil and Gas Market Overview, by Retrofitting and Maintenance
11.1.1. Global 3D Printing in Oil and Gas Market Revenue Share, By Retrofitting and Maintenance, 2022 Vs 2030 (in %)
11.2. Retrofitting Existing Components
11.2.1. Global 3D Printing in Oil and Gas Market, By Retrofitting Existing Components, By Region, 2017-2030 (US$ Mn)
11.2.2. Market Dynamics for Retrofitting Existing Components
11.2.2.1. Drivers
11.2.2.2. Restraints
11.2.2.3. Opportunities
11.2.2.4. Trends
11.3. Replacement Parts
11.3.1. Global 3D Printing in Oil and Gas Market, By Replacement Parts, By Region, 2017-2030 (US$ Mn)
11.3.2. Market Dynamics for Replacement Parts
11.3.2.1. Drivers
11.3.2.2. Restraints
11.3.2.3. Opportunities
11.3.2.4. Trends
12. Global 3D Printing in Oil and Gas Market, By Tooling and Equipment Production
12.1. Global 3D Printing in Oil and Gas Market Overview, by Tooling and Equipment Production
12.1.1. Global 3D Printing in Oil and Gas Market Revenue Share, By Tooling and Equipment Production, 2022 Vs 2030 (in %)
12.2. Custom Tooling
12.2.1. Global 3D Printing in Oil and Gas Market, By Custom Tooling, By Region, 2017-2030 (US$ Mn)
12.2.2. Market Dynamics for Custom Tooling
12.2.2.1. Drivers
12.2.2.2. Restraints
12.2.2.3. Opportunities
12.2.2.4. Trends
12.3. Jigs and Fixtures
12.3.1. Global 3D Printing in Oil and Gas Market, By Jigs and Fixtures, By Region, 2017-2030 (US$ Mn)
12.3.2. Market Dynamics for Jigs and Fixtures
12.3.2.1. Drivers
12.3.2.2. Restraints
12.3.2.3. Opportunities
12.3.2.4. Trends
13. Global 3D Printing in Oil and Gas Market, By Prototyping and Design Optimization
13.1. Global 3D Printing in Oil and Gas Market Overview, by Prototyping and Design Optimization
13.1.1. Global 3D Printing in Oil and Gas Market Revenue Share, By Prototyping and Design Optimization, 2022 Vs 2030 (in %)
13.2. Rapid Prototyping
13.2.1. Global 3D Printing in Oil and Gas Market, By Rapid Prototyping, By Region, 2017-2030 (US$ Mn)
13.2.2. Market Dynamics for Rapid Prototyping
13.2.2.1. Drivers
13.2.2.2. Restraints
13.2.2.3. Opportunities
13.2.2.4. Trends
13.3. Design Iterations
13.3.1. Global 3D Printing in Oil and Gas Market, By Design Iterations, By Region, 2017-2030 (US$ Mn)
13.3.2. Market Dynamics for Design Iterations
13.3.2.1. Drivers
13.3.2.2. Restraints
13.3.2.3. Opportunities
13.3.2.4. Trends
14. Global 3D Printing in Oil and Gas Market, By Reducing Weight and Enhancing Performance
14.1. Global 3D Printing in Oil and Gas Market Overview, by Reducing Weight and Enhancing Performance
14.1.1. Global 3D Printing in Oil and Gas Market Revenue Share, By Reducing Weight and Enhancing Performance, 2022 Vs 2030 (in %)
14.2. Topology Optimization
14.2.1. Global 3D Printing in Oil and Gas Market, By Topology Optimization, By Region, 2017-2030 (US$ Mn)
14.2.2. Market Dynamics for Topology Optimization
14.2.2.1. Drivers
14.2.2.2. Restraints
14.2.2.3. Opportunities
14.2.2.4. Trends
14.3. Complex Geometries
14.3.1. Global 3D Printing in Oil and Gas Market, By Complex Geometries, By Region, 2017-2030 (US$ Mn)
14.3.2. Market Dynamics for Complex Geometries
14.3.2.1. Drivers
14.3.2.2. Restraints
14.3.2.3. Opportunities
14.3.2.4. Trends
15. Global 3D Printing in Oil and Gas Market, By Drilling and Exploration Applications
15.1. Global 3D Printing in Oil and Gas Market Overview, by Drilling and Exploration Applications
15.1.1. Global 3D Printing in Oil and Gas Market Revenue Share, By Drilling and Exploration Applications, 2022 Vs 2030 (in %)
15.2. Customized Drilling Tools
15.2.1. Global 3D Printing in Oil and Gas Market, By Customized Drilling Tools, By Region, 2017-2030 (US$ Mn)
15.2.2. Market Dynamics for Customized Drilling Tools
15.2.2.1. Drivers
15.2.2.2. Restraints
15.2.2.3. Opportunities
15.2.2.4. Trends
15.3. Sensor Housings
15.3.1. Global 3D Printing in Oil and Gas Market, By Sensor Housings, By Region, 2017-2030 (US$ Mn)
15.3.2. Market Dynamics for Sensor Housings
15.3.2.1. Drivers
15.3.2.2. Restraints
15.3.2.3. Opportunities
15.3.2.4. Trends
16. Global 3D Printing in Oil and Gas Market, By Sustainability and Environmental Impact
16.1. Global 3D Printing in Oil and Gas Market Overview, by Sustainability and Environmental Impact
16.1.1. Global 3D Printing in Oil and Gas Market Revenue Share, By Sustainability and Environmental Impact, 2022 Vs 2030 (in %)
16.2. Reduced Material Waste
16.2.1. Global 3D Printing in Oil and Gas Market, By Reduced Material Waste, By Region, 2017-2030 (US$ Mn)
16.2.2. Market Dynamics for Reduced Material Waste
16.2.2.1. Drivers
16.2.2.2. Restraints
16.2.2.3. Opportunities
16.2.2.4. Trends
16.3. Localized Production
16.3.1. Global 3D Printing in Oil and Gas Market, By Localized Production, By Region, 2017-2030 (US$ Mn)
16.3.2. Market Dynamics for Localized Production
16.3.2.1. Drivers
16.3.2.2. Restraints
16.3.2.3. Opportunities
16.3.2.4. Trends
17. Global 3D Printing in Oil and Gas Market, By Certification and Standardization
17.1. Global 3D Printing in Oil and Gas Market Overview, by Certification and Standardization
17.1.1. Global 3D Printing in Oil and Gas Market Revenue Share, By Certification and Standardization, 2022 Vs 2030 (in %)
17.2. Industry Standards
17.2.1. Global 3D Printing in Oil and Gas Market, By Industry Standards, By Region, 2017-2030 (US$ Mn)
17.2.2. Market Dynamics for Industry Standards
17.2.2.1. Drivers
17.2.2.2. Restraints
17.2.2.3. Opportunities
17.2.2.4. Trends
17.3. Regulatory Compliance
17.3.1. Global 3D Printing in Oil and Gas Market, By Regulatory Compliance, By Region, 2017-2030 (US$ Mn)
17.3.2. Market Dynamics for Regulatory Compliance
17.3.2.1. Drivers
17.3.2.2. Restraints
17.3.2.3. Opportunities
17.3.2.4. Trends
18. Global 3D Printing in Oil and Gas Market, By Collaborative Initiatives
18.1. Global 3D Printing in Oil and Gas Market Overview, by Collaborative Initiatives
18.1.1. Global 3D Printing in Oil and Gas Market Revenue Share, By Collaborative Initiatives, 2022 Vs 2030 (in %)
18.2. Partnerships and Consortia
18.2.1. Global 3D Printing in Oil and Gas Market, By Partnerships and Consortia, By Region, 2017-2030 (US$ Mn)
18.2.2. Market Dynamics for Partnerships and Consortia
18.2.2.1. Drivers
18.2.2.2. Restraints
18.2.2.3. Opportunities
18.2.2.4. Trends
19. Global 3D Printing in Oil and Gas Market, By Remote and Harsh Environments
19.1. Global 3D Printing in Oil and Gas Market Overview, by Remote and Harsh Environments
19.1.1. Global 3D Printing in Oil and Gas Market Revenue Share, By Remote and Harsh Environments, 2022 Vs 2030 (in %)
19.2. On-Site 3D Printing
19.2.1. Global 3D Printing in Oil and Gas Market, By On-Site 3D Printing, By Region, 2017-2030 (US$ Mn)
19.2.2. Market Dynamics for On-Site 3D Printing
19.2.2.1. Drivers
19.2.2.2. Restraints
19.2.2.3. Opportunities
19.2.2.4. Trends
19.3. Adaptation to Extreme Conditions
19.3.1. Global 3D Printing in Oil and Gas Market, By Adaptation to Extreme Conditions, By Region, 2017-2030 (US$ Mn)
19.3.2. Market Dynamics for Adaptation to Extreme Conditions
19.3.2.1. Drivers
19.3.2.2. Restraints
19.3.2.3. Opportunities
19.3.2.4. Trends
20. Global 3D Printing in Oil and Gas Market, By Region
20.1. Global 3D Printing in Oil and Gas Market Overview, by Region
20.1.1. Global 3D Printing in Oil and Gas Market, By Region, 2022 vs 2030 (in%)
20.2. Manufacturing of Components
20.2.1. Global 3D Printing in Oil and Gas Market, By Manufacturing of Components, 2017-2030 (US$ Mn)
20.3. Supply Chain Optimization
20.3.1. Global 3D Printing in Oil and Gas Market, By Supply Chain Optimization, 2017-2030 (US$ Mn)
20.4. Materials Development
20.4.1. Global 3D Printing in Oil and Gas Market, By Materials Development, 2017-2030 (US$ Mn)
20.5. Retrofitting and Maintenance
20.5.1. Global 3D Printing in Oil and Gas Market, By Retrofitting and Maintenance, 2017-2030 (US$ Mn)
20.6. Tooling and Equipment Production
20.6.1. Global 3D Printing in Oil and Gas Market, By Tooling and Equipment Production, 2017-2030 (US$ Mn)
20.7. Prototyping and Design Optimization
20.7.1. Global 3D Printing in Oil and Gas Market, By Prototyping and Design Optimization, 2017-2030 (US$ Mn)
20.8. Reducing Weight and Enhancing Performance
20.8.1. Global 3D Printing in Oil and Gas Market, By Reducing Weight and Enhancing Performance, 2017-2030 (US$ Mn)
20.9. Drilling and Exploration Applications
20.9.1. Global 3D Printing in Oil and Gas Market, By Drilling and Exploration Applications, 2017-2030 (US$ Mn)
20.10. Sustainability and Environmental Impact
20.10.1. Global 3D Printing in Oil and Gas Market, By Sustainability and Environmental Impact, 2017-2030 (US$ Mn)
20.11. Certification and Standardization
20.11.1. Global 3D Printing in Oil and Gas Market, By Certification and Standardization, 2017-2030 (US$ Mn)
20.12. Collaborative Initiatives
20.12.1. Global 3D Printing in Oil and Gas Market, By Collaborative Initiatives, 2017-2030 (US$ Mn)
20.13. Remote and Harsh Environments
20.13.1. Global 3D Printing in Oil and Gas Market, By Remote and Harsh Environments, 2017-2030 (US$ Mn)
21. North America 3D Printing in Oil and Gas Market Analysis
21.1. Overview
21.1.1. Market Dynamics for North America
21.1.1.1. Drivers
21.1.1.2. Restraints
21.1.1.3. Opportunities
21.1.1.4. Trends
21.2. North America 3D Printing in Oil and Gas Market, by Manufacturing of Components, 2017-2030(US$ Mn)
21.2.1. Overview
21.2.2. SRC Analysis
21.3. North America 3D Printing in Oil and Gas Market, by Supply Chain Optimization, 2017-2030(US$ Mn)
21.3.1. Overview
21.3.2. SRC Analysis
21.4. North America 3D Printing in Oil and Gas Market, by Materials Development, 2017-2030(US$ Mn)
21.4.1. Overview
21.4.2. SRC Analysis
21.5. North America 3D Printing in Oil and Gas Market, by Retrofitting and Maintenance, 2017-2030(US$ Mn)
21.5.1. Overview
21.5.2. SRC Analysis
21.6. North America 3D Printing in Oil and Gas Market, by Tooling and Equipment Production, 2017-2030(US$ Mn)
21.6.1. Overview
21.6.2. SRC Analysis
21.7. North America 3D Printing in Oil and Gas Market, by Prototyping and Design Optimization, 2017-2030(US$ Mn)
21.7.1. Overview
21.7.2. SRC Analysis
21.8. North America 3D Printing in Oil and Gas Market, by Reducing Weight and Enhancing Performance, 2017-2030(US$ Mn)
21.8.1. Overview
21.8.2. SRC Analysis
21.9. North America 3D Printing in Oil and Gas Market, by Drilling and Exploration Applications, 2017-2030(US$ Mn)
21.9.1. Overview
21.9.2. SRC Analysis
21.10. North America 3D Printing in Oil and Gas Market, by Sustainability and Environmental Impact, 2017-2030(US$ Mn)
21.10.1. Overview
21.10.2. SRC Analysis
21.11. North America 3D Printing in Oil and Gas Market, by Certification and Standardization, 2017-2030(US$ Mn)
21.11.1. Overview
21.11.2. SRC Analysis
21.12. North America 3D Printing in Oil and Gas Market, by Collaborative Initiatives, 2017-2030(US$ Mn)
21.12.1. Overview
21.12.2. SRC Analysis
21.13. North America 3D Printing in Oil and Gas Market, by Remote and Harsh Environments, 2017-2030(US$ Mn)
21.13.1. Overview
21.13.2. SRC Analysis
21.14. North America 3D Printing in Oil and Gas Market, by Country, 2017-2030 (US$ Mn)
21.14.1. North America 3D Printing in Oil and Gas Market, by Country, 2022 Vs 2030 (in%)
21.14.2. U.S.
21.14.3. Canada
21.14.4. Mexico
22. Europe 3D Printing in Oil and Gas Market Analysis
22.1. Overview
22.1.1. Market Dynamics for Europe
22.1.1.1. Drivers
22.1.1.2. Restraints
22.1.1.3. Opportunities
22.1.1.4. Trends
22.2. Europe 3D Printing in Oil and Gas Market, by Manufacturing of Components, 2017-2030(US$ Mn)
22.2.1. Overview
22.2.2. SRC Analysis
22.3. Europe 3D Printing in Oil and Gas Market, by Supply Chain Optimization, 2017-2030(US$ Mn)
22.3.1. Overview
22.3.2. SRC Analysis
22.4. Europe 3D Printing in Oil and Gas Market, by Materials Development, 2017-2030(US$ Mn)
22.4.1. Overview
22.4.2. SRC Analysis
22.5. Europe 3D Printing in Oil and Gas Market, by Retrofitting and Maintenance, 2017-2030(US$ Mn)
22.5.1. Overview
22.5.2. SRC Analysis
22.6. Europe 3D Printing in Oil and Gas Market, by Tooling and Equipment Production, 2017-2030(US$ Mn)
22.6.1. Overview
22.6.2. SRC Analysis
22.7. Europe 3D Printing in Oil and Gas Market, by Prototyping and Design Optimization, 2017-2030(US$ Mn)
22.7.1. Overview
22.7.2. SRC Analysis
22.8. Europe 3D Printing in Oil and Gas Market, by Reducing Weight and Enhancing Performance, 2017-2030(US$ Mn)
22.8.1. Overview
22.8.2. SRC Analysis
22.9. Europe 3D Printing in Oil and Gas Market, by Drilling and Exploration Applications, 2017-2030(US$ Mn)
22.9.1. Overview
22.9.2. SRC Analysis
22.10. Europe 3D Printing in Oil and Gas Market, by Sustainability and Environmental Impact, 2017-2030(US$ Mn)
22.10.1. Overview
22.10.2. SRC Analysis
22.11. Europe 3D Printing in Oil and Gas Market, by Certification and Standardization, 2017-2030(US$ Mn)
22.11.1. Overview
22.11.2. SRC Analysis
22.12. Europe 3D Printing in Oil and Gas Market, by Collaborative Initiatives, 2017-2030(US$ Mn)
22.12.1. Overview
22.12.2. SRC Analysis
22.13. Europe 3D Printing in Oil and Gas Market, by Remote and Harsh Environments, 2017-2030(US$ Mn)
22.13.1. Overview
22.13.2. SRC Analysis
22.14. Europe 3D Printing in Oil and Gas Market, by Country, 2017-2030 (US$ Mn)
22.14.1. Europe 3D Printing in Oil and Gas Market, by Country, 2022 Vs 2030 (in%)
22.14.2. UK
22.14.3. France
22.14.4. Germany
22.14.5. Italy
22.14.6. Spain
22.14.7. Benelux
22.14.8. Russia
22.14.9. Rest of Europe
23. Asia Pacific 3D Printing in Oil and Gas Market Analysis
23.1. Overview
23.1.1. Market Dynamics for Asia Pacific
23.1.1.1. Drivers
23.1.1.2. Restraints
23.1.1.3. Opportunities
23.1.1.4. Trends
23.2. Asia Pacific 3D Printing in Oil and Gas Market, by Manufacturing of Components, 2017-2030(US$ Mn)
23.2.1. Overview
23.2.2. SRC Analysis
23.3. Asia Pacific 3D Printing in Oil and Gas Market, by Supply Chain Optimization, 2017-2030(US$ Mn)
23.3.1. Overview
23.3.2. SRC Analysis
23.4. Asia Pacific 3D Printing in Oil and Gas Market, by Materials Development, 2017-2030(US$ Mn)
23.4.1. Overview
23.4.2. SRC Analysis
23.5. Asia Pacific 3D Printing in Oil and Gas Market, by Retrofitting and Maintenance, 2017-2030(US$ Mn)
23.5.1. Overview
23.5.2. SRC Analysis
23.6. Asia Pacific 3D Printing in Oil and Gas Market, by Tooling and Equipment Production, 2017-2030(US$ Mn)
23.6.1. Overview
23.6.2. SRC Analysis
23.7. Asia Pacific 3D Printing in Oil and Gas Market, by Prototyping and Design Optimization, 2017-2030(US$ Mn)
23.7.1. Overview
23.7.2. SRC Analysis
23.8. Asia Pacific 3D Printing in Oil and Gas Market, by Reducing Weight and Enhancing Performance, 2017-2030(US$ Mn)
23.8.1. Overview
23.8.2. SRC Analysis
23.9. Asia Pacific 3D Printing in Oil and Gas Market, by Drilling and Exploration Applications, 2017-2030(US$ Mn)
23.9.1. Overview
23.9.2. SRC Analysis
23.10. Asia Pacific 3D Printing in Oil and Gas Market, by Sustainability and Environmental Impact, 2017-2030(US$ Mn)
23.10.1. Overview
23.10.2. SRC Analysis
23.11. Asia Pacific 3D Printing in Oil and Gas Market, by Certification and Standardization, 2017-2030(US$ Mn)
23.11.1. Overview
23.11.2. SRC Analysis
23.12. Asia Pacific 3D Printing in Oil and Gas Market, by Collaborative Initiatives, 2017-2030(US$ Mn)
23.12.1. Overview
23.12.2. SRC Analysis
23.13. Asia Pacific 3D Printing in Oil and Gas Market, by Remote and Harsh Environments, 2017-2030(US$ Mn)
23.13.1. Overview
23.13.2. SRC Analysis
23.14. Asia Pacific 3D Printing in Oil and Gas Market, by Country, 2017-2030 (US$ Mn)
23.14.1. Asia Pacific 3D Printing in Oil and Gas Market, by Country, 2022 Vs 2030 (in%)
23.14.2. China
23.14.3. Japan
23.14.4. India
23.14.5. South Korea
23.14.6. South East Asia
23.14.7. Rest of Asia Pacific
24. Latin America 3D Printing in Oil and Gas Market Analysis
24.1. Overview
24.1.1. Market Dynamics for Latin America
24.1.1.1. Drivers
24.1.1.2. Restraints
24.1.1.3. Opportunities
24.1.1.4. Trends
24.2. Latin America 3D Printing in Oil and Gas Market, by Manufacturing of Components, 2017-2030(US$ Mn)
24.2.1. Overview
24.2.2. SRC Analysis
24.3. Latin America 3D Printing in Oil and Gas Market, by Supply Chain Optimization, 2017-2030(US$ Mn)
24.3.1. Overview
24.3.2. SRC Analysis
24.4. Latin America 3D Printing in Oil and Gas Market, by Materials Development, 2017-2030(US$ Mn)
24.4.1. Overview
24.4.2. SRC Analysis
24.5. Latin America 3D Printing in Oil and Gas Market, by Retrofitting and Maintenance, 2017-2030(US$ Mn)
24.5.1. Overview
24.5.2. SRC Analysis
24.6. Latin America 3D Printing in Oil and Gas Market, by Tooling and Equipment Production, 2017-2030(US$ Mn)
24.6.1. Overview
24.6.2. SRC Analysis
24.7. Latin America 3D Printing in Oil and Gas Market, by Prototyping and Design Optimization, 2017-2030(US$ Mn)
24.7.1. Overview
24.7.2. SRC Analysis
24.8. Latin America 3D Printing in Oil and Gas Market, by Reducing Weight and Enhancing Performance, 2017-2030(US$ Mn)
24.8.1. Overview
24.8.2. SRC Analysis
24.9. Latin America 3D Printing in Oil and Gas Market, by Drilling and Exploration Applications, 2017-2030(US$ Mn)
24.9.1. Overview
24.9.2. SRC Analysis
24.10. Latin America 3D Printing in Oil and Gas Market, by Sustainability and Environmental Impact, 2017-2030(US$ Mn)
24.10.1. Overview
24.10.2. SRC Analysis
24.11. Latin America 3D Printing in Oil and Gas Market, by Certification and Standardization, 2017-2030(US$ Mn)
24.11.1. Overview
24.11.2. SRC Analysis
24.12. Latin America 3D Printing in Oil and Gas Market, by Collaborative Initiatives, 2017-2030(US$ Mn)
24.12.1. Overview
24.12.2. SRC Analysis
24.13. Latin America 3D Printing in Oil and Gas Market, by Remote and Harsh Environments, 2017-2030(US$ Mn)
24.13.1. Overview
24.13.2. SRC Analysis
24.14. Latin America 3D Printing in Oil and Gas Market, by Country, 2017-2030 (US$ Mn)
24.14.1. Latin America 3D Printing in Oil and Gas Market, by Country, 2022 Vs 2030 (in%)
24.14.2. Brazil
24.14.3. Argentina
24.14.4. Rest of Latin America
25. Middle East 3D Printing in Oil and Gas Market Analysis
25.1. Overview
25.1.1. Market Dynamics for Middle East
25.1.1.1. Drivers
25.1.1.2. Restraints
25.1.1.3. Opportunities
25.1.1.4. Trends
25.2. Middle East 3D Printing in Oil and Gas Market, by Manufacturing of Components, 2017-2030(US$ Mn)
25.2.1. Overview
25.2.2. SRC Analysis
25.3. Middle East 3D Printing in Oil and Gas Market, by Supply Chain Optimization, 2017-2030(US$ Mn)
25.3.1. Overview
25.3.2. SRC Analysis
25.4. Middle East 3D Printing in Oil and Gas Market, by Materials Development, 2017-2030(US$ Mn)
25.4.1. Overview
25.4.2. SRC Analysis
25.5. Middle East 3D Printing in Oil and Gas Market, by Retrofitting and Maintenance, 2017-2030(US$ Mn)
25.5.1. Overview
25.5.2. SRC Analysis
25.6. Middle East 3D Printing in Oil and Gas Market, by Tooling and Equipment Production, 2017-2030(US$ Mn)
25.6.1. Overview
25.6.2. SRC Analysis
25.7. Middle East 3D Printing in Oil and Gas Market, by Prototyping and Design Optimization, 2017-2030(US$ Mn)
25.7.1. Overview
25.7.2. SRC Analysis
25.8. Middle East 3D Printing in Oil and Gas Market, by Reducing Weight and Enhancing Performance, 2017-2030(US$ Mn)
25.8.1. Overview
25.8.2. SRC Analysis
25.9. Middle East 3D Printing in Oil and Gas Market, by Drilling and Exploration Applications, 2017-2030(US$ Mn)
25.9.1. Overview
25.9.2. SRC Analysis
25.10. Middle East 3D Printing in Oil and Gas Market, by Sustainability and Environmental Impact, 2017-2030(US$ Mn)
25.10.1. Overview
25.10.2. SRC Analysis
25.11. Middle East 3D Printing in Oil and Gas Market, by Certification and Standardization, 2017-2030(US$ Mn)
25.11.1. Overview
25.11.2. SRC Analysis
25.12. Middle East 3D Printing in Oil and Gas Market, by Collaborative Initiatives, 2017-2030(US$ Mn)
25.12.1. Overview
25.12.2. SRC Analysis
25.13. Middle East 3D Printing in Oil and Gas Market, by Remote and Harsh Environments, 2017-2030(US$ Mn)
25.13.1. Overview
25.13.2. SRC Analysis
25.14. Middle East 3D Printing in Oil and Gas Market, by Country, 2017-2030 (US$ Mn)
25.14.1. Middle East 3D Printing in Oil and Gas Market, by Country, 2022 Vs 2030 (in%)
25.14.2. UAE
25.14.3. Saudi Arabia
25.14.4. Rest of Middle East
26. Africa 3D Printing in Oil and Gas Market Analysis
26.1. Overview
26.1.1. Market Dynamics for Africa
26.1.1.1. Drivers
26.1.1.2. Restraints
26.1.1.3. Opportunities
26.1.1.4. Trends
26.2. Africa 3D Printing in Oil and Gas Market, by Manufacturing of Components, 2017-2030(US$ Mn)
26.2.1. Overview
26.2.2. SRC Analysis
26.3. Africa 3D Printing in Oil and Gas Market, by Supply Chain Optimization, 2017-2030(US$ Mn)
26.3.1. Overview
26.3.2. SRC Analysis
26.4. Africa 3D Printing in Oil and Gas Market, by Materials Development, 2017-2030(US$ Mn)
26.4.1. Overview
26.4.2. SRC Analysis
26.5. Africa 3D Printing in Oil and Gas Market, by Retrofitting and Maintenance, 2017-2030(US$ Mn)
26.5.1. Overview
26.5.2. SRC Analysis
26.6. Africa 3D Printing in Oil and Gas Market, by Tooling and Equipment Production, 2017-2030(US$ Mn)
26.6.1. Overview
26.6.2. SRC Analysis
26.7. Africa 3D Printing in Oil and Gas Market, by Prototyping and Design Optimization, 2017-2030(US$ Mn)
26.7.1. Overview
26.7.2. SRC Analysis
26.8. Africa 3D Printing in Oil and Gas Market, by Reducing Weight and Enhancing Performance, 2017-2030(US$ Mn)
26.8.1. Overview
26.8.2. SRC Analysis
26.9. Africa 3D Printing in Oil and Gas Market, by Drilling and Exploration Applications, 2017-2030(US$ Mn)
26.9.1. Overview
26.9.2. SRC Analysis
26.10. Africa 3D Printing in Oil and Gas Market, by Sustainability and Environmental Impact, 2017-2030(US$ Mn)
26.10.1. Overview
26.10.2. SRC Analysis
26.11. Africa 3D Printing in Oil and Gas Market, by Certification and Standardization, 2017-2030(US$ Mn)
26.11.1. Overview
26.11.2. SRC Analysis
26.12. Africa 3D Printing in Oil and Gas Market, by Collaborative Initiatives, 2017-2030(US$ Mn)
26.12.1. Overview
26.12.2. SRC Analysis
26.13. Africa 3D Printing in Oil and Gas Market, by Remote and Harsh Environments, 2017-2030(US$ Mn)
26.13.1. Overview
26.13.2. SRC Analysis
26.14. Africa 3D Printing in Oil and Gas Market, by Country, 2017-2030 (US$ Mn)
26.14.1. Africa 3D Printing in Oil and Gas Market, by Country, 2022 Vs 2030 (in%)
26.14.2. South Africa
26.14.3. Egypt
26.14.4. Rest of Africa
27. Company Profiles
27.1. Proto Labs, Inc.
27.1.1. Company Overview
27.1.2. Products/Services Portfolio
27.1.3. Geographical Presence
27.1.4. SWOT Analysis
27.1.5. Financial Summary
27.1.5.1. Market Revenue and Net Profit (2019-2022)
27.1.5.2. Business Segment Revenue Analysis
27.1.5.3. Geographical Revenue Analysis
27.2. SLM Solutions Group AG
27.3. EnvisionTEC GmbH
27.4. Stratasys Ltd.
27.5. 3D Systems Corporation
27.6. Materialise NV
27.7. Optomec Inc.
27.8. Voxeljet AG
27.9. The Exone Company
27.10. Arcam Group
27.11. Others
28. Research Methodology
28.1. Research Methodology
28.2. Phase I – Secondary Research
28.3. Phase II – Data Modelling
28.3.1. Company Share Analysis Model
28.3.2. Revenue Based Modelling
28.4. Phase III – Primary Research
28.5. Research Limitations
28.5.1. Assumptions

List of Figures
FIG. 1 Global 3D Printing in Oil and Gas Market: Research Methodology
FIG. 2 Market Size Estimation – Top Down & Bottom up Approach
FIG. 3 Global 3D Printing in Oil and Gas Market Segmentation
FIG. 4 Global 3D Printing in Oil and Gas Market, by Manufacturing of Components, 2022 (US$ Mn)
FIG. 5 Global 3D Printing in Oil and Gas Market, by Supply Chain Optimization, 2022 (US$ Mn)
FIG. 6 Global 3D Printing in Oil and Gas Market, by Materials Development, 2022 (US$ Mn)
FIG. 7 Global 3D Printing in Oil and Gas Market, by Retrofitting and Maintenance, 2022 (US$ Mn)
FIG. 8 Global 3D Printing in Oil and Gas Market, by Tooling and Equipment Production, 2022 (US$ Mn)
FIG. 9 Global 3D Printing in Oil and Gas Market, by Prototyping and Design Optimization, 2022 (US$ Mn)
FIG. 10 Global 3D Printing in Oil and Gas Market, by Reducing Weight and Enhancing Performance, 2022 (US$ Mn)
FIG. 11 Global 3D Printing in Oil and Gas Market, by Drilling and Exploration Applications, 2022 (US$ Mn)
FIG. 12 Global 3D Printing in Oil and Gas Market, by Sustainability and Environmental Impact, 2022 (US$ Mn)
FIG. 13 Global 3D Printing in Oil and Gas Market, by Certification and Standardization, 2022 (US$ Mn)
FIG. 14 Global 3D Printing in Oil and Gas Market, by Collaborative Initiatives, 2022 (US$ Mn)
FIG. 15 Global 3D Printing in Oil and Gas Market, by Remote and Harsh Environments, 2022 (US$ Mn)
FIG. 16 Global 3D Printing in Oil and Gas Market, by Geography, 2022 (US$ Mn)
FIG. 17 Attractive Investment Proposition, by Manufacturing of Components, 2022
FIG. 18 Attractive Investment Proposition, by Supply Chain Optimization, 2022
FIG. 19 Attractive Investment Proposition, by Materials Development, 2022
FIG. 20 Attractive Investment Proposition, by Retrofitting and Maintenance, 2022
FIG. 21 Attractive Investment Proposition, by Tooling and Equipment Production, 2022
FIG. 22 Attractive Investment Proposition, by Prototyping and Design Optimization, 2022
FIG. 23 Attractive Investment Proposition, by Reducing Weight and Enhancing Performance, 2022
FIG. 24 Attractive Investment Proposition, by Drilling and Exploration Applications, 2022
FIG. 25 Attractive Investment Proposition, by Sustainability and Environmental Impact, 2022
FIG. 26 Attractive Investment Proposition, by Certification and Standardization, 2022
FIG. 27 Attractive Investment Proposition, by Collaborative Initiatives, 2022
FIG. 28 Attractive Investment Proposition, by Remote and Harsh Environments, 2022
FIG. 29 Attractive Investment Proposition, by Geography, 2022
FIG. 30 Global Market Share Analysis of Key 3D Printing in Oil and Gas Market Manufacturers, 2022
FIG. 31 Global Market Positioning of Key 3D Printing in Oil and Gas Market Manufacturers, 2022
FIG. 32 Global 3D Printing in Oil and Gas Market Value Contribution, By Manufacturing of Components, 2022 & 2030 (Value %)
FIG. 33 Global 3D Printing in Oil and Gas Market, by Customized Parts, Value, 2017-2030 (US$ Mn)
FIG. 34 Global 3D Printing in Oil and Gas Market, by Prototyping, Value, 2017-2030 (US$ Mn)
FIG. 35 Global 3D Printing in Oil and Gas Market Value Contribution, By Supply Chain Optimization, 2022 & 2030 (Value %)
FIG. 36 Global 3D Printing in Oil and Gas Market, by On-Demand Manufacturing, Value, 2017-2030 (US$ Mn)
FIG. 37 Global 3D Printing in Oil and Gas Market, by Reducing Dependence on Suppliers, Value, 2017-2030 (US$ Mn)
FIG. 38 Global 3D Printing in Oil and Gas Market Value Contribution, By Materials Development, 2022 & 2030 (Value %)
FIG. 39 Global 3D Printing in Oil and Gas Market, by Advanced Materials, Value, 2017-2030 (US$ Mn)
FIG. 40 Global 3D Printing in Oil and Gas Market, by High-Performance Polymers and Metals, Value, 2017-2030 (US$ Mn)
FIG. 41 Global 3D Printing in Oil and Gas Market Value Contribution, By Retrofitting and Maintenance, 2022 & 2030 (Value %)
FIG. 42 Global 3D Printing in Oil and Gas Market, by Retrofitting Existing Components, Value, 2017-2030 (US$ Mn)
FIG. 43 Global 3D Printing in Oil and Gas Market, by Replacement Parts, Value, 2017-2030 (US$ Mn)
FIG. 44 Global 3D Printing in Oil and Gas Market Value Contribution, By Tooling and Equipment Production, 2022 & 2030 (Value %)
FIG. 45 Global 3D Printing in Oil and Gas Market, by Custom Tooling, Value, 2017-2030 (US$ Mn)
FIG. 46 Global 3D Printing in Oil and Gas Market, by Jigs and Fixtures, Value, 2017-2030 (US$ Mn)
FIG. 47 Global 3D Printing in Oil and Gas Market Value Contribution, By Prototyping and Design Optimization, 2022 & 2030 (Value %)
FIG. 48 Global 3D Printing in Oil and Gas Market, by Rapid Prototyping, Value, 2017-2030 (US$ Mn)
FIG. 49 Global 3D Printing in Oil and Gas Market, by Design Iterations, Value, 2017-2030 (US$ Mn)
FIG. 50 Global 3D Printing in Oil and Gas Market Value Contribution, By Reducing Weight and Enhancing Performance, 2022 & 2030 (Value %)
FIG. 51 Global 3D Printing in Oil and Gas Market, by Topology Optimization, Value, 2017-2030 (US$ Mn)
FIG. 52 Global 3D Printing in Oil and Gas Market, by Complex Geometries, Value, 2017-2030 (US$ Mn)
FIG. 53 Global 3D Printing in Oil and Gas Market Value Contribution, By Drilling and Exploration Applications, 2022 & 2030 (Value %)
FIG. 54 Global 3D Printing in Oil and Gas Market, by Customized Drilling Tools, Value, 2017-2030 (US$ Mn)
FIG. 55 Global 3D Printing in Oil and Gas Market, by Sensor Housings, Value, 2017-2030 (US$ Mn)
FIG. 56 Global 3D Printing in Oil and Gas Market Value Contribution, By Sustainability and Environmental Impact, 2022 & 2030 (Value %)
FIG. 57 Global 3D Printing in Oil and Gas Market, by Reduced Material Waste, Value, 2017-2030 (US$ Mn)
FIG. 58 Global 3D Printing in Oil and Gas Market, by Localized Production, Value, 2017-2030 (US$ Mn)
FIG. 59 Global 3D Printing in Oil and Gas Market Value Contribution, By Certification and Standardization, 2022 & 2030 (Value %)
FIG. 60 Global 3D Printing in Oil and Gas Market, by Industry Standards, Value, 2017-2030 (US$ Mn)
FIG. 61 Global 3D Printing in Oil and Gas Market, by Regulatory Compliance, Value, 2017-2030 (US$ Mn)
FIG. 62 Global 3D Printing in Oil and Gas Market Value Contribution, By Collaborative Initiatives, 2022 & 2030 (Value %)
FIG. 63 Global 3D Printing in Oil and Gas Market, by Partnerships and Consortia, Value, 2017-2030 (US$ Mn)
FIG. 64 Global 3D Printing in Oil and Gas Market Value Contribution, By Remote and Harsh Environments, 2022 & 2030 (Value %)
FIG. 65 Global 3D Printing in Oil and Gas Market, by On-Site 3D Printing, Value, 2017-2030 (US$ Mn)
FIG. 66 Global 3D Printing in Oil and Gas Market, by Adaptation to Extreme Conditions, Value, 2017-2030 (US$ Mn)
FIG. 67 North America 3D Printing in Oil and Gas Market, 2017-2030 (US$ Mn)
FIG. 68 U.S. 3D Printing in Oil and Gas Market, 2017-2030 (US$ Mn)
FIG. 69 Canada 3D Printing in Oil and Gas Market, 2017-2030 (US$ Mn)
FIG. 70 Mexico 3D Printing in Oil and Gas Market, 2017-2030 (US$ Mn)
FIG. 71 Europe 3D Printing in Oil and Gas Market, 2017-2030 (US$ Mn)
FIG. 72 Germany 3D Printing in Oil and Gas Market, 2017-2030 (US$ Mn)
FIG. 73 France 3D Printing in Oil and Gas Market, 2017-2030 (US$ Mn)
FIG. 74 U.K. 3D Printing in Oil and Gas Market, 2017-2030 (US$ Mn)
FIG. 75 Italy 3D Printing in Oil and Gas Market, 2017-2030 (US$ Mn)
FIG. 76 Spain 3D Printing in Oil and Gas Market, 2017-2030 (US$ Mn)
FIG. 77 Benelux 3D Printing in Oil and Gas Market, 2017-2030 (US$ Mn)
FIG. 78 Russia 3D Printing in Oil and Gas Market, 2017-2030 (US$ Mn)
FIG. 79 Rest of Europe 3D Printing in Oil and Gas Market, 2017-2030 (US$ Mn)
FIG. 80 Asia Pacific 3D Printing in Oil and Gas Market, 2017-2030 (US$ Mn)
FIG. 81 China 3D Printing in Oil and Gas Market, 2017-2030 (US$ Mn)
FIG. 82 Japan 3D Printing in Oil and Gas Market, 2017-2030 (US$ Mn)
FIG. 83 India 3D Printing in Oil and Gas Market, 2017-2030 (US$ Mn)
FIG. 84 South Korea 3D Printing in Oil and Gas Market, 2017-2030 (US$ Mn)
FIG. 85 South-East Asia 3D Printing in Oil and Gas Market, 2017-2030 (US$ Mn)
FIG. 86 Rest of Asia Pacific 3D Printing in Oil and Gas Market, 2017-2030 (US$ Mn)
FIG. 87 Latin America 3D Printing in Oil and Gas Market, 2017-2030 (US$ Mn)
FIG. 88 Brazil 3D Printing in Oil and Gas Market, 2017-2030 (US$ Mn)
FIG. 89 Argentina 3D Printing in Oil and Gas Market, 2017-2030 (US$ Mn)
FIG. 90 Rest of Latin America 3D Printing in Oil and Gas Market, 2017-2030 (US$ Mn)
FIG. 91 Middle East 3D Printing in Oil and Gas Market, 2017-2030 (US$ Mn)
FIG. 92 UAE 3D Printing in Oil and Gas Market, 2017-2030 (US$ Mn)
FIG. 93 Saudi Arabia 3D Printing in Oil and Gas Market, 2017-2030 (US$ Mn)
FIG. 94 Rest of Middle East 3D Printing in Oil and Gas Market, 2017-2030 (US$ Mn)
FIG. 95 Africa 3D Printing in Oil and Gas Market, 2017-2030 (US$ Mn)
FIG. 96 South Africa 3D Printing in Oil and Gas Market, 2017-2030 (US$ Mn)
FIG. 97 Egypt 3D Printing in Oil and Gas Market, 2017-2030 (US$ Mn)
FIG. 98 Rest of Africa 3D Printing in Oil and Gas Market, 2017-2030 (US$ Mn)

List of Tables
TABLE 1 Market Snapshot: Global 3D Printing in Oil and Gas Market
TABLE 2 Global 3D Printing in Oil and Gas Market: Market Drivers Impact Analysis
TABLE 3 Global 3D Printing in Oil and Gas Market: Market Restraints Impact Analysis
TABLE 4 Global 3D Printing in Oil and Gas Market, by Competitive Benchmarking, 2022
TABLE 5 Global 3D Printing in Oil and Gas Market, by Geographical Presence Analysis, 2022
TABLE 6 Global 3D Printing in Oil and Gas Market, by Key Strategies Analysis, 2022
TABLE 7 Global 3D Printing in Oil and Gas Market, by Customized Parts, By Region, 2017-2022 (US$ Mn)
TABLE 8 Global 3D Printing in Oil and Gas Market, by Customized Parts, By Region, 2023-2030 (US$ Mn)
TABLE 9 Global 3D Printing in Oil and Gas Market, by Prototyping, By Region, 2017-2022 (US$ Mn)
TABLE 10 Global 3D Printing in Oil and Gas Market, by Prototyping, By Region, 2023-2030 (US$ Mn)
TABLE 11 Global 3D Printing in Oil and Gas Market, by On-Demand Manufacturing, By Region, 2017-2022 (US$ Mn)
TABLE 12 Global 3D Printing in Oil and Gas Market, by On-Demand Manufacturing, By Region, 2023-2030 (US$ Mn)
TABLE 13 Global 3D Printing in Oil and Gas Market, by Reducing Dependence on Suppliers, By Region, 2017-2022 (US$ Mn)
TABLE 14 Global 3D Printing in Oil and Gas Market, by Reducing Dependence on Suppliers, By Region, 2023-2030 (US$ Mn)
TABLE 15 Global 3D Printing in Oil and Gas Market, by Advanced Materials, By Region, 2017-2022 (US$ Mn)
TABLE 16 Global 3D Printing in Oil and Gas Market, by Advanced Materials, By Region, 2023-2030 (US$ Mn)
TABLE 17 Global 3D Printing in Oil and Gas Market, by High-Performance Polymers and Metals, By Region, 2017-2022 (US$ Mn)
TABLE 18 Global 3D Printing in Oil and Gas Market, by High-Performance Polymers and Metals, By Region, 2023-2030 (US$ Mn)
TABLE 19 Global 3D Printing in Oil and Gas Market, by Retrofitting Existing Components, By Region, 2017-2022 (US$ Mn)
TABLE 20 Global 3D Printing in Oil and Gas Market, by Retrofitting Existing Components, By Region, 2023-2030 (US$ Mn)
TABLE 21 Global 3D Printing in Oil and Gas Market, by Replacement Parts, By Region, 2017-2022 (US$ Mn)
TABLE 22 Global 3D Printing in Oil and Gas Market, by Replacement Parts, By Region, 2023-2030 (US$ Mn)
TABLE 23 Global 3D Printing in Oil and Gas Market, by Custom Tooling, By Region, 2017-2022 (US$ Mn)
TABLE 24 Global 3D Printing in Oil and Gas Market, by Custom Tooling, By Region, 2023-2030 (US$ Mn)
TABLE 25 Global 3D Printing in Oil and Gas Market, by Jigs and Fixtures, By Region, 2017-2022 (US$ Mn)
TABLE 26 Global 3D Printing in Oil and Gas Market, by Jigs and Fixtures, By Region, 2023-2030 (US$ Mn)
TABLE 27 Global 3D Printing in Oil and Gas Market, by Rapid Prototyping, By Region, 2017-2022 (US$ Mn)
TABLE 28 Global 3D Printing in Oil and Gas Market, by Rapid Prototyping, By Region, 2023-2030 (US$ Mn)
TABLE 29 Global 3D Printing in Oil and Gas Market, by Design Iterations, By Region, 2017-2022 (US$ Mn)
TABLE 30 Global 3D Printing in Oil and Gas Market, by Design Iterations, By Region, 2023-2030 (US$ Mn)
TABLE 31 Global 3D Printing in Oil and Gas Market, by Topology Optimization, By Region, 2017-2022 (US$ Mn)
TABLE 32 Global 3D Printing in Oil and Gas Market, by Topology Optimization, By Region, 2023-2030 (US$ Mn)
TABLE 33 Global 3D Printing in Oil and Gas Market, by Complex Geometries, By Region, 2017-2022 (US$ Mn)
TABLE 34 Global 3D Printing in Oil and Gas Market, by Complex Geometries, By Region, 2023-2030 (US$ Mn)
TABLE 35 Global 3D Printing in Oil and Gas Market, by Customized Drilling Tools, By Region, 2017-2022 (US$ Mn)
TABLE 36 Global 3D Printing in Oil and Gas Market, by Customized Drilling Tools, By Region, 2023-2030 (US$ Mn)
TABLE 37 Global 3D Printing in Oil and Gas Market, by Sensor Housings, By Region, 2017-2022 (US$ Mn)
TABLE 38 Global 3D Printing in Oil and Gas Market, by Sensor Housings, By Region, 2023-2030 (US$ Mn)
TABLE 39 Global 3D Printing in Oil and Gas Market, by Reduced Material Waste, By Region, 2017-2022 (US$ Mn)
TABLE 40 Global 3D Printing in Oil and Gas Market, by Reduced Material Waste, By Region, 2023-2030 (US$ Mn)
TABLE 41 Global 3D Printing in Oil and Gas Market, by Localized Production, By Region, 2017-2022 (US$ Mn)
TABLE 42 Global 3D Printing in Oil and Gas Market, by Localized Production, By Region, 2023-2030 (US$ Mn)
TABLE 43 Global 3D Printing in Oil and Gas Market, by Industry Standards, By Region, 2017-2022 (US$ Mn)
TABLE 44 Global 3D Printing in Oil and Gas Market, by Industry Standards, By Region, 2023-2030 (US$ Mn)
TABLE 45 Global 3D Printing in Oil and Gas Market, by Regulatory Compliance, By Region, 2017-2022 (US$ Mn)
TABLE 46 Global 3D Printing in Oil and Gas Market, by Regulatory Compliance, By Region, 2023-2030 (US$ Mn)
TABLE 47 Global 3D Printing in Oil and Gas Market, by Partnerships and Consortia, By Region, 2017-2022 (US$ Mn)
TABLE 48 Global 3D Printing in Oil and Gas Market, by Partnerships and Consortia, By Region, 2023-2030 (US$ Mn)
TABLE 49 Global 3D Printing in Oil and Gas Market, by On-Site 3D Printing, By Region, 2017-2022 (US$ Mn)
TABLE 50 Global 3D Printing in Oil and Gas Market, by On-Site 3D Printing, By Region, 2023-2030 (US$ Mn)
TABLE 51 Global 3D Printing in Oil and Gas Market, by Adaptation to Extreme Conditions, By Region, 2017-2022 (US$ Mn)
TABLE 52 Global 3D Printing in Oil and Gas Market, by Adaptation to Extreme Conditions, By Region, 2023-2030 (US$ Mn)
TABLE 53 Global 3D Printing in Oil and Gas Market, by Manufacturing of Components, 2017-2022 (US$ Mn)
TABLE 54 Global 3D Printing in Oil and Gas Market, by Manufacturing of Components, 2023-2030 (US$ Mn)
TABLE 55 Global 3D Printing in Oil and Gas Market, by Supply Chain Optimization, 2017-2022 (US$ Mn)
TABLE 56 Global 3D Printing in Oil and Gas Market, by Supply Chain Optimization, 2023-2030 (US$ Mn)
TABLE 57 Global 3D Printing in Oil and Gas Market, by Materials Development, 2017-2022 (US$ Mn)
TABLE 58 Global 3D Printing in Oil and Gas Market, by Materials Development, 2023-2030 (US$ Mn)
TABLE 59 Global 3D Printing in Oil and Gas Market, by Retrofitting and Maintenance, 2017-2022 (US$ Mn)
TABLE 60 Global 3D Printing in Oil and Gas Market, by Retrofitting and Maintenance, 2023-2030 (US$ Mn)
TABLE 61 Global 3D Printing in Oil and Gas Market, by Tooling and Equipment Production, 2017-2022 (US$ Mn)
TABLE 62 Global 3D Printing in Oil and Gas Market, by Tooling and Equipment Production, 2023-2030 (US$ Mn)
TABLE 63 Global 3D Printing in Oil and Gas Market, by Prototyping and Design Optimization, 2017-2022 (US$ Mn)
TABLE 64 Global 3D Printing in Oil and Gas Market, by Prototyping and Design Optimization, 2023-2030 (US$ Mn)
TABLE 65 Global 3D Printing in Oil and Gas Market, by Reducing Weight and Enhancing Performance, 2017-2022 (US$ Mn)
TABLE 66 Global 3D Printing in Oil and Gas Market, by Reducing Weight and Enhancing Performance, 2023-2030 (US$ Mn)
TABLE 67 Global 3D Printing in Oil and Gas Market, by Drilling and Exploration Applications, 2017-2022 (US$ Mn)
TABLE 68 Global 3D Printing in Oil and Gas Market, by Drilling and Exploration Applications, 2023-2030 (US$ Mn)
TABLE 69 Global 3D Printing in Oil and Gas Market, by Sustainability and Environmental Impact, 2017-2022 (US$ Mn)
TABLE 70 Global 3D Printing in Oil and Gas Market, by Sustainability and Environmental Impact, 2023-2030 (US$ Mn)
TABLE 71 Global 3D Printing in Oil and Gas Market, by Certification and Standardization, 2017-2022 (US$ Mn)
TABLE 72 Global 3D Printing in Oil and Gas Market, by Certification and Standardization, 2023-2030 (US$ Mn)
TABLE 73 Global 3D Printing in Oil and Gas Market, by Collaborative Initiatives, 2017-2022 (US$ Mn)
TABLE 74 Global 3D Printing in Oil and Gas Market, by Collaborative Initiatives, 2023-2030 (US$ Mn)
TABLE 75 Global 3D Printing in Oil and Gas Market, by Remote and Harsh Environments, 2017-2022 (US$ Mn)
TABLE 76 Global 3D Printing in Oil and Gas Market, by Remote and Harsh Environments, 2023-2030 (US$ Mn)
TABLE 77 Global 3D Printing in Oil and Gas Market, by Region, 2017-2022 (US$ Mn)
TABLE 78 Global 3D Printing in Oil and Gas Market, by Region, 2023-2030 (US$ Mn)
TABLE 79 North America 3D Printing in Oil and Gas Market, by Manufacturing of Components, 2017-2022 (US$ Mn)
TABLE 80 North America 3D Printing in Oil and Gas Market, by Manufacturing of Components, 2023-2030 (US$ Mn)
TABLE 81 North America 3D Printing in Oil and Gas Market, by Supply Chain Optimization, 2017-2022 (US$ Mn)
TABLE 82 North America 3D Printing in Oil and Gas Market, by Supply Chain Optimization, 2023-2030 (US$ Mn)
TABLE 83 North America 3D Printing in Oil and Gas Market, by Materials Development, 2017-2022 (US$ Mn)
TABLE 84 North America 3D Printing in Oil and Gas Market, by Materials Development, 2023-2030 (US$ Mn)
TABLE 85 North America 3D Printing in Oil and Gas Market, by Retrofitting and Maintenance, 2017-2022 (US$ Mn)
TABLE 86 North America 3D Printing in Oil and Gas Market, by Retrofitting and Maintenance, 2023-2030 (US$ Mn)
TABLE 87 North America 3D Printing in Oil and Gas Market, by Tooling and Equipment Production, 2017-2022 (US$ Mn)
TABLE 88 North America 3D Printing in Oil and Gas Market, by Tooling and Equipment Production, 2023-2030 (US$ Mn)
TABLE 89 North America 3D Printing in Oil and Gas Market, by Prototyping and Design Optimization, 2017-2022 (US$ Mn)
TABLE 90 North America 3D Printing in Oil and Gas Market, by Prototyping and Design Optimization, 2023-2030 (US$ Mn)
TABLE 91 North America 3D Printing in Oil and Gas Market, by Reducing Weight and Enhancing Performance, 2017-2022 (US$ Mn)
TABLE 92 North America 3D Printing in Oil and Gas Market, by Reducing Weight and Enhancing Performance, 2023-2030 (US$ Mn)
TABLE 93 North America 3D Printing in Oil and Gas Market, by Drilling and Exploration Applications, 2017-2022 (US$ Mn)
TABLE 94 North America 3D Printing in Oil and Gas Market, by Drilling and Exploration Applications, 2023-2030 (US$ Mn)
TABLE 95 North America 3D Printing in Oil and Gas Market, by Sustainability and Environmental Impact, 2017-2022 (US$ Mn)
TABLE 96 North America 3D Printing in Oil and Gas Market, by Sustainability and Environmental Impact, 2023-2030 (US$ Mn)
TABLE 97 North America 3D Printing in Oil and Gas Market, by Certification and Standardization, 2017-2022 (US$ Mn)
TABLE 98 North America 3D Printing in Oil and Gas Market, by Certification and Standardization, 2023-2030 (US$ Mn)
TABLE 99 North America 3D Printing in Oil and Gas Market, by Collaborative Initiatives, 2017-2022 (US$ Mn)
TABLE 100 North America 3D Printing in Oil and Gas Market, by Collaborative Initiatives, 2023-2030 (US$ Mn)
TABLE 101 North America 3D Printing in Oil and Gas Market, by Remote and Harsh Environments, 2017-2022 (US$ Mn)
TABLE 102 North America 3D Printing in Oil and Gas Market, by Remote and Harsh Environments, 2023-2030 (US$ Mn)
TABLE 103 North America 3D Printing in Oil and Gas Market, by Country, 2017-2022 (US$ Mn)
TABLE 104 North America 3D Printing in Oil and Gas Market, by Country, 2023-2030 (US$ Mn)
TABLE 105 United States 3D Printing in Oil and Gas Market, by Manufacturing of Components, 2017-2022 (US$ Mn)
TABLE 106 United States 3D Printing in Oil and Gas Market, by Manufacturing of Components, 2023-2030 (US$ Mn)
TABLE 107 United States 3D Printing in Oil and Gas Market, by Supply Chain Optimization, 2017-2022 (US$ Mn)
TABLE 108 United States 3D Printing in Oil and Gas Market, by Supply Chain Optimization, 2023-2030 (US$ Mn)
TABLE 109 United States 3D Printing in Oil and Gas Market, by Materials Development, 2017-2022 (US$ Mn)
TABLE 110 United States 3D Printing in Oil and Gas Market, by Materials Development, 2023-2030 (US$ Mn)
TABLE 111 United States 3D Printing in Oil and Gas Market, by Retrofitting and Maintenance, 2017-2022 (US$ Mn)
TABLE 112 United States 3D Printing in Oil and Gas Market, by Retrofitting and Maintenance, 2023-2030 (US$ Mn)
TABLE 113 United States 3D Printing in Oil and Gas Market, by Tooling and Equipment Production, 2017-2022 (US$ Mn)
TABLE 114 United States 3D Printing in Oil and Gas Market, by Tooling and Equipment Production, 2023-2030 (US$ Mn)
TABLE 115 United States 3D Printing in Oil and Gas Market, by Prototyping and Design Optimization, 2017-2022 (US$ Mn)
TABLE 116 United States 3D Printing in Oil and Gas Market, by Prototyping and Design Optimization, 2023-2030 (US$ Mn)
TABLE 117 United States 3D Printing in Oil and Gas Market, by Reducing Weight and Enhancing Performance, 2017-2022 (US$ Mn)
TABLE 118 United States 3D Printing in Oil and Gas Market, by Reducing Weight and Enhancing Performance, 2023-2030 (US$ Mn)
TABLE 119 United States 3D Printing in Oil and Gas Market, by Drilling and Exploration Applications, 2017-2022 (US$ Mn)
TABLE 120 United States 3D Printing in Oil and Gas Market, by Drilling and Exploration Applications, 2023-2030 (US$ Mn)
TABLE 121 United States 3D Printing in Oil and Gas Market, by Sustainability and Environmental Impact, 2017-2022 (US$ Mn)
TABLE 122 United States 3D Printing in Oil and Gas Market, by Sustainability and Environmental Impact, 2023-2030 (US$ Mn)
TABLE 123 United States 3D Printing in Oil and Gas Market, by Certification and Standardization, 2017-2022 (US$ Mn)
TABLE 124 United States 3D Printing in Oil and Gas Market, by Certification and Standardization, 2023-2030 (US$ Mn)
TABLE 125 United States 3D Printing in Oil and Gas Market, by Collaborative Initiatives, 2017-2022 (US$ Mn)
TABLE 126 United States 3D Printing in Oil and Gas Market, by Collaborative Initiatives, 2023-2030 (US$ Mn)
TABLE 127 United States 3D Printing in Oil and Gas Market, by Remote and Harsh Environments, 2017-2022 (US$ Mn)
TABLE 128 United States 3D Printing in Oil and Gas Market, by Remote and Harsh Environments, 2023-2030 (US$ Mn)
TABLE 129 Canada 3D Printing in Oil and Gas Market, by Manufacturing of Components, 2017-2022 (US$ Mn)
TABLE 130 Canada 3D Printing in Oil and Gas Market, by Manufacturing of Components, 2023-2030 (US$ Mn)
TABLE 131 Canada 3D Printing in Oil and Gas Market, by Supply Chain Optimization, 2017-2022 (US$ Mn)
TABLE 132 Canada 3D Printing in Oil and Gas Market, by Supply Chain Optimization, 2023-2030 (US$ Mn)
TABLE 133 Canada 3D Printing in Oil and Gas Market, by Materials Development, 2017-2022 (US$ Mn)
TABLE 134 Canada 3D Printing in Oil and Gas Market, by Materials Development, 2023-2030 (US$ Mn)
TABLE 135 Canada 3D Printing in Oil and Gas Market, by Retrofitting and Maintenance, 2017-2022 (US$ Mn)
TABLE 136 Canada 3D Printing in Oil and Gas Market, by Retrofitting and Maintenance, 2023-2030 (US$ Mn)
TABLE 137 Canada 3D Printing in Oil and Gas Market, by Tooling and Equipment Production, 2017-2022 (US$ Mn)
TABLE 138 Canada 3D Printing in Oil and Gas Market, by Tooling and Equipment Production, 2023-2030 (US$ Mn)
TABLE 139 Canada 3D Printing in Oil and Gas Market, by Prototyping and Design Optimization, 2017-2022 (US$ Mn)
TABLE 140 Canada 3D Printing in Oil and Gas Market, by Prototyping and Design Optimization, 2023-2030 (US$ Mn)
TABLE 141 Canada 3D Printing in Oil and Gas Market, by Reducing Weight and Enhancing Performance, 2017-2022 (US$ Mn)
TABLE 142 Canada 3D Printing in Oil and Gas Market, by Reducing Weight and Enhancing Performance, 2023-2030 (US$ Mn)
TABLE 143 Canada 3D Printing in Oil and Gas Market, by Drilling and Exploration Applications, 2017-2022 (US$ Mn)
TABLE 144 Canada 3D Printing in Oil and Gas Market, by Drilling and Exploration Applications, 2023-2030 (US$ Mn)
TABLE 145 Canada 3D Printing in Oil and Gas Market, by Sustainability and Environmental Impact, 2017-2022 (US$ Mn)
TABLE 146 Canada 3D Printing in Oil and Gas Market, by Sustainability and Environmental Impact, 2023-2030 (US$ Mn)
TABLE 147 Canada 3D Printing in Oil and Gas Market, by Certification and Standardization, 2017-2022 (US$ Mn)
TABLE 148 Canada 3D Printing in Oil and Gas Market, by Certification and Standardization, 2023-2030 (US$ Mn)
TABLE 149 Canada 3D Printing in Oil and Gas Market, by Collaborative Initiatives, 2017-2022 (US$ Mn)
TABLE 150 Canada 3D Printing in Oil and Gas Market, by Collaborative Initiatives, 2023-2030 (US$ Mn)
TABLE 151 Canada 3D Printing in Oil and Gas Market, by Remote and Harsh Environments, 2017-2022 (US$ Mn)
TABLE 152 Canada 3D Printing in Oil and Gas Market, by Remote and Harsh Environments, 2023-2030 (US$ Mn)
TABLE 153 Mexico 3D Printing in Oil and Gas Market, by Manufacturing of Components, 2017-2022 (US$ Mn)
TABLE 154 Mexico 3D Printing in Oil and Gas Market, by Manufacturing of Components, 2023-2030 (US$ Mn)
TABLE 155 Mexico 3D Printing in Oil and Gas Market, by Supply Chain Optimization, 2017-2022 (US$ Mn)
TABLE 156 Mexico 3D Printing in Oil and Gas Market, by Supply Chain Optimization, 2023-2030 (US$ Mn)
TABLE 157 Mexico 3D Printing in Oil and Gas Market, by Materials Development, 2017-2022 (US$ Mn)
TABLE 158 Mexico 3D Printing in Oil and Gas Market, by Materials Development, 2023-2030 (US$ Mn)
TABLE 159 Mexico 3D Printing in Oil and Gas Market, by Retrofitting and Maintenance, 2017-2022 (US$ Mn)
TABLE 160 Mexico 3D Printing in Oil and Gas Market, by Retrofitting and Maintenance, 2023-2030 (US$ Mn)
TABLE 161 Mexico 3D Printing in Oil and Gas Market, by Tooling and Equipment Production, 2017-2022 (US$ Mn)
TABLE 162 Mexico 3D Printing in Oil and Gas Market, by Tooling and Equipment Production, 2023-2030 (US$ Mn)
TABLE 163 Mexico 3D Printing in Oil and Gas Market, by Prototyping and Design Optimization, 2017-2022 (US$ Mn)
TABLE 164 Mexico 3D Printing in Oil and Gas Market, by Prototyping and Design Optimization, 2023-2030 (US$ Mn)
TABLE 165 Mexico 3D Printing in Oil and Gas Market, by Reducing Weight and Enhancing Performance, 2017-2022 (US$ Mn)
TABLE 166 Mexico 3D Printing in Oil and Gas Market, by Reducing Weight and Enhancing Performance, 2023-2030 (US$ Mn)
TABLE 167 Mexico 3D Printing in Oil and Gas Market, by Drilling and Exploration Applications, 2017-2022 (US$ Mn)
TABLE 168 Mexico 3D Printing in Oil and Gas Market, by Drilling and Exploration Applications, 2023-2030 (US$ Mn)
TABLE 169 Mexico 3D Printing in Oil and Gas Market, by Sustainability and Environmental Impact, 2017-2022 (US$ Mn)
TABLE 170 Mexico 3D Printing in Oil and Gas Market, by Sustainability and Environmental Impact, 2023-2030 (US$ Mn)
TABLE 171 Mexico 3D Printing in Oil and Gas Market, by Certification and Standardization, 2017-2022 (US$ Mn)
TABLE 172 Mexico 3D Printing in Oil and Gas Market, by Certification and Standardization, 2023-2030 (US$ Mn)
TABLE 173 Mexico 3D Printing in Oil and Gas Market, by Collaborative Initiatives, 2017-2022 (US$ Mn)
TABLE 174 Mexico 3D Printing in Oil and Gas Market, by Collaborative Initiatives, 2023-2030 (US$ Mn)
TABLE 175 Mexico 3D Printing in Oil and Gas Market, by Remote and Harsh Environments, 2017-2022 (US$ Mn)
TABLE 176 Mexico 3D Printing in Oil and Gas Market, by Remote and Harsh Environments, 2023-2030 (US$ Mn)
TABLE 177 Europe 3D Printing in Oil and Gas Market, by Manufacturing of Components, 2017-2022 (US$ Mn)
TABLE 178 Europe 3D Printing in Oil and Gas Market, by Manufacturing of Components, 2023-2030 (US$ Mn)
TABLE 179 Europe 3D Printing in Oil and Gas Market, by Supply Chain Optimization, 2017-2022 (US$ Mn)
TABLE 180 Europe 3D Printing in Oil and Gas Market, by Supply Chain Optimization, 2023-2030 (US$ Mn)
TABLE 181 Europe 3D Printing in Oil and Gas Market, by Materials Development, 2017-2022 (US$ Mn)
TABLE 182 Europe 3D Printing in Oil and Gas Market, by Materials Development, 2023-2030 (US$ Mn)
TABLE 183 Europe 3D Printing in Oil and Gas Market, by Retrofitting and Maintenance, 2017-2022 (US$ Mn)
TABLE 184 Europe 3D Printing in Oil and Gas Market, by Retrofitting and Maintenance, 2023-2030 (US$ Mn)
TABLE 185 Europe 3D Printing in Oil and Gas Market, by Tooling and Equipment Production, 2017-2022 (US$ Mn)
TABLE 186 Europe 3D Printing in Oil and Gas Market, by Tooling and Equipment Production, 2023-2030 (US$ Mn)
TABLE 187 Europe 3D Printing in Oil and Gas Market, by Prototyping and Design Optimization, 2017-2022 (US$ Mn)
TABLE 188 Europe 3D Printing in Oil and Gas Market, by Prototyping and Design Optimization, 2023-2030 (US$ Mn)
TABLE 189 Europe 3D Printing in Oil and Gas Market, by Reducing Weight and Enhancing Performance, 2017-2022 (US$ Mn)
TABLE 190 Europe 3D Printing in Oil and Gas Market, by Reducing Weight and Enhancing Performance, 2023-2030 (US$ Mn)
TABLE 191 Europe 3D Printing in Oil and Gas Market, by Drilling and Exploration Applications, 2017-2022 (US$ Mn)
TABLE 192 Europe 3D Printing in Oil and Gas Market, by Drilling and Exploration Applications, 2023-2030 (US$ Mn)
TABLE 193 Europe 3D Printing in Oil and Gas Market, by Sustainability and Environmental Impact, 2017-2022 (US$ Mn)
TABLE 194 Europe 3D Printing in Oil and Gas Market, by Sustainability and Environmental Impact, 2023-2030 (US$ Mn)
TABLE 195 Europe 3D Printing in Oil and Gas Market, by Certification and Standardization, 2017-2022 (US$ Mn)
TABLE 196 Europe 3D Printing in Oil and Gas Market, by Certification and Standardization, 2023-2030 (US$ Mn)
TABLE 197 Europe 3D Printing in Oil and Gas Market, by Collaborative Initiatives, 2017-2022 (US$ Mn)
TABLE 198 Europe 3D Printing in Oil and Gas Market, by Collaborative Initiatives, 2023-2030 (US$ Mn)
TABLE 199 Europe 3D Printing in Oil and Gas Market, by Remote and Harsh Environments, 2017-2022 (US$ Mn)
TABLE 200 Europe 3D Printing in Oil and Gas Market, by Remote and Harsh Environments, 2023-2030 (US$ Mn)
TABLE 201 Europe 3D Printing in Oil and Gas Market, by Country, 2017-2022 (US$ Mn)
TABLE 202 Europe 3D Printing in Oil and Gas Market, by Country, 2023-2030 (US$ Mn)
TABLE 203 Germany 3D Printing in Oil and Gas Market, by Manufacturing of Components, 2017-2022 (US$ Mn)
TABLE 204 Germany 3D Printing in Oil and Gas Market, by Manufacturing of Components, 2023-2030 (US$ Mn)
TABLE 205 Germany 3D Printing in Oil and Gas Market, by Supply Chain Optimization, 2017-2022 (US$ Mn)
TABLE 206 Germany 3D Printing in Oil and Gas Market, by Supply Chain Optimization, 2023-2030 (US$ Mn)
TABLE 207 Germany 3D Printing in Oil and Gas Market, by Materials Development, 2017-2022 (US$ Mn)
TABLE 208 Germany 3D Printing in Oil and Gas Market, by Materials Development, 2023-2030 (US$ Mn)
TABLE 209 Germany 3D Printing in Oil and Gas Market, by Retrofitting and Maintenance, 2017-2022 (US$ Mn)
TABLE 210 Germany 3D Printing in Oil and Gas Market, by Retrofitting and Maintenance, 2023-2030 (US$ Mn)
TABLE 211 Germany 3D Printing in Oil and Gas Market, by Tooling and Equipment Production, 2017-2022 (US$ Mn)
TABLE 212 Germany 3D Printing in Oil and Gas Market, by Tooling and Equipment Production, 2023-2030 (US$ Mn)
TABLE 213 Germany 3D Printing in Oil and Gas Market, by Prototyping and Design Optimization, 2017-2022 (US$ Mn)
TABLE 214 Germany 3D Printing in Oil and Gas Market, by Prototyping and Design Optimization, 2023-2030 (US$ Mn)
TABLE 215 Germany 3D Printing in Oil and Gas Market, by Reducing Weight and Enhancing Performance, 2017-2022 (US$ Mn)
TABLE 216 Germany 3D Printing in Oil and Gas Market, by Reducing Weight and Enhancing Performance, 2023-2030 (US$ Mn)
TABLE 217 Germany 3D Printing in Oil and Gas Market, by Drilling and Exploration Applications, 2017-2022 (US$ Mn)
TABLE 218 Germany 3D Printing in Oil and Gas Market, by Drilling and Exploration Applications, 2023-2030 (US$ Mn)
TABLE 219 Germany 3D Printing in Oil and Gas Market, by Sustainability and Environmental Impact, 2017-2022 (US$ Mn)
TABLE 220 Germany 3D Printing in Oil and Gas Market, by Sustainability and Environmental Impact, 2023-2030 (US$ Mn)
TABLE 221 Germany 3D Printing in Oil and Gas Market, by Certification and Standardization, 2017-2022 (US$ Mn)
TABLE 222 Germany 3D Printing in Oil and Gas Market, by Certification and Standardization, 2023-2030 (US$ Mn)
TABLE 223 Germany 3D Printing in Oil and Gas Market, by Collaborative Initiatives, 2017-2022 (US$ Mn)
TABLE 224 Germany 3D Printing in Oil and Gas Market, by Collaborative Initiatives, 2023-2030 (US$ Mn)
TABLE 225 Germany 3D Printing in Oil and Gas Market, by Remote and Harsh Environments, 2017-2022 (US$ Mn)
TABLE 226 Germany 3D Printing in Oil and Gas Market, by Remote and Harsh Environments, 2023-2030 (US$ Mn)
TABLE 227 France 3D Printing in Oil and Gas Market, by Manufacturing of Components, 2017-2022 (US$ Mn)
TABLE 228 France 3D Printing in Oil and Gas Market, by Manufacturing of Components, 2023-2030 (US$ Mn)
TABLE 229 France 3D Printing in Oil and Gas Market, by Supply Chain Optimization, 2017-2022 (US$ Mn)
TABLE 230 France 3D Printing in Oil and Gas Market, by Supply Chain Optimization, 2023-2030 (US$ Mn)
TABLE 231 France 3D Printing in Oil and Gas Market, by Materials Development, 2017-2022 (US$ Mn)
TABLE 232 France 3D Printing in Oil and Gas Market, by Materials Development, 2023-2030 (US$ Mn)
TABLE 233 France 3D Printing in Oil and Gas Market, by Retrofitting and Maintenance, 2017-2022 (US$ Mn)
TABLE 234 France 3D Printing in Oil and Gas Market, by Retrofitting and Maintenance, 2023-2030 (US$ Mn)
TABLE 235 France 3D Printing in Oil and Gas Market, by Tooling and Equipment Production, 2017-2022 (US$ Mn)
TABLE 236 France 3D Printing in Oil and Gas Market, by Tooling and Equipment Production, 2023-2030 (US$ Mn)
TABLE 237 France 3D Printing in Oil and Gas Market, by Prototyping and Design Optimization, 2017-2022 (US$ Mn)
TABLE 238 France 3D Printing in Oil and Gas Market, by Prototyping and Design Optimization, 2023-2030 (US$ Mn)
TABLE 239 France 3D Printing in Oil and Gas Market, by Reducing Weight and Enhancing Performance, 2017-2022 (US$ Mn)
TABLE 240 France 3D Printing in Oil and Gas Market, by Reducing Weight and Enhancing Performance, 2023-2030 (US$ Mn)
TABLE 241 France 3D Printing in Oil and Gas Market, by Drilling and Exploration Applications, 2017-2022 (US$ Mn)
TABLE 242 France 3D Printing in Oil and Gas Market, by Drilling and Exploration Applications, 2023-2030 (US$ Mn)
TABLE 243 France 3D Printing in Oil and Gas Market, by Sustainability and Environmental Impact, 2017-2022 (US$ Mn)
TABLE 244 France 3D Printing in Oil and Gas Market, by Sustainability and Environmental Impact, 2023-2030 (US$ Mn)
TABLE 245 France 3D Printing in Oil and Gas Market, by Certification and Standardization, 2017-2022 (US$ Mn)
TABLE 246 France 3D Printing in Oil and Gas Market, by Certification and Standardization, 2023-2030 (US$ Mn)
TABLE 247 France 3D Printing in Oil and Gas Market, by Collaborative Initiatives, 2017-2022 (US$ Mn)
TABLE 248 France 3D Printing in Oil and Gas Market, by Collaborative Initiatives, 2023-2030 (US$ Mn)
TABLE 249 France 3D Printing in Oil and Gas Market, by Remote and Harsh Environments, 2017-2022 (US$ Mn)
TABLE 250 France 3D Printing in Oil and Gas Market, by Remote and Harsh Environments, 2023-2030 (US$ Mn)
TABLE 251 United Kingdom 3D Printing in Oil and Gas Market, by Manufacturing of Components, 2017-2022 (US$ Mn)
TABLE 252 United Kingdom 3D Printing in Oil and Gas Market, by Manufacturing of Components, 2023-2030 (US$ Mn)
TABLE 253 United Kingdom 3D Printing in Oil and Gas Market, by Supply Chain Optimization, 2017-2022 (US$ Mn)
TABLE 254 United Kingdom 3D Printing in Oil and Gas Market, by Supply Chain Optimization, 2023-2030 (US$ Mn)
TABLE 255 United Kingdom 3D Printing in Oil and Gas Market, by Materials Development, 2017-2022 (US$ Mn)
TABLE 256 United Kingdom 3D Printing in Oil and Gas Market, by Materials Development, 2023-2030 (US$ Mn)
TABLE 257 United Kingdom 3D Printing in Oil and Gas Market, by Retrofitting and Maintenance, 2017-2022 (US$ Mn)
TABLE 258 United Kingdom 3D Printing in Oil and Gas Market, by Retrofitting and Maintenance, 2023-2030 (US$ Mn)
TABLE 259 United Kingdom 3D Printing in Oil and Gas Market, by Tooling and Equipment Production, 2017-2022 (US$ Mn)
TABLE 260 United Kingdom 3D Printing in Oil and Gas Market, by Tooling and Equipment Production, 2023-2030 (US$ Mn)
TABLE 261 United Kingdom 3D Printing in Oil and Gas Market, by Prototyping and Design Optimization, 2017-2022 (US$ Mn)
TABLE 262 United Kingdom 3D Printing in Oil and Gas Market, by Prototyping and Design Optimization, 2023-2030 (US$ Mn)
TABLE 263 United Kingdom 3D Printing in Oil and Gas Market, by Reducing Weight and Enhancing Performance, 2017-2022 (US$ Mn)
TABLE 264 United Kingdom 3D Printing in Oil and Gas Market, by Reducing Weight and Enhancing Performance, 2023-2030 (US$ Mn)
TABLE 265 United Kingdom 3D Printing in Oil and Gas Market, by Drilling and Exploration Applications, 2017-2022 (US$ Mn)
TABLE 266 United Kingdom 3D Printing in Oil and Gas Market, by Drilling and Exploration Applications, 2023-2030 (US$ Mn)
TABLE 267 United Kingdom 3D Printing in Oil and Gas Market, by Sustainability and Environmental Impact, 2017-2022 (US$ Mn)
TABLE 268 United Kingdom 3D Printing in Oil and Gas Market, by Sustainability and Environmental Impact, 2023-2030 (US$ Mn)
TABLE 269 United Kingdom 3D Printing in Oil and Gas Market, by Certification and Standardization, 2017-2022 (US$ Mn)
TABLE 270 United Kingdom 3D Printing in Oil and Gas Market, by Certification and Standardization, 2023-2030 (US$ Mn)
TABLE 271 United Kingdom 3D Printing in Oil and Gas Market, by Collaborative Initiatives, 2017-2022 (US$ Mn)
TABLE 272 United Kingdom 3D Printing in Oil and Gas Market, by Collaborative Initiatives, 2023-2030 (US$ Mn)
TABLE 273 United Kingdom 3D Printing in Oil and Gas Market, by Remote and Harsh Environments, 2017-2022 (US$ Mn)
TABLE 274 United Kingdom 3D Printing in Oil and Gas Market, by Remote and Harsh Environments, 2023-2030 (US$ Mn)
TABLE 275 Italy 3D Printing in Oil and Gas Market, by Manufacturing of Components, 2017-2022 (US$ Mn)
TABLE 276 Italy 3D Printing in Oil and Gas Market, by Manufacturing of Components, 2023-2030 (US$ Mn)
TABLE 277 Italy 3D Printing in Oil and Gas Market, by Supply Chain Optimization, 2017-2022 (US$ Mn)
TABLE 278 Italy 3D Printing in Oil and Gas Market, by Supply Chain Optimization, 2023-2030 (US$ Mn)
TABLE 279 Italy 3D Printing in Oil and Gas Market, by Materials Development, 2017-2022 (US$ Mn)
TABLE 280 Italy 3D Printing in Oil and Gas Market, by Materials Development, 2023-2030 (US$ Mn)
TABLE 281 Italy 3D Printing in Oil and Gas Market, by Retrofitting and Maintenance, 2017-2022 (US$ Mn)
TABLE 282 Italy 3D Printing in Oil and Gas Market, by Retrofitting and Maintenance, 2023-2030 (US$ Mn)
TABLE 283 Italy 3D Printing in Oil and Gas Market, by Tooling and Equipment Production, 2017-2022 (US$ Mn)
TABLE 284 Italy 3D Printing in Oil and Gas Market, by Tooling and Equipment Production, 2023-2030 (US$ Mn)
TABLE 285 Italy 3D Printing in Oil and Gas Market, by Prototyping and Design Optimization, 2017-2022 (US$ Mn)
TABLE 286 Italy 3D Printing in Oil and Gas Market, by Prototyping and Design Optimization, 2023-2030 (US$ Mn)
TABLE 287 Italy 3D Printing in Oil and Gas Market, by Reducing Weight and Enhancing Performance, 2017-2022 (US$ Mn)
TABLE 288 Italy 3D Printing in Oil and Gas Market, by Reducing Weight and Enhancing Performance, 2023-2030 (US$ Mn)
TABLE 289 Italy 3D Printing in Oil and Gas Market, by Drilling and Exploration Applications, 2017-2022 (US$ Mn)
TABLE 290 Italy 3D Printing in Oil and Gas Market, by Drilling and Exploration Applications, 2023-2030 (US$ Mn)
TABLE 291 Italy 3D Printing in Oil and Gas Market, by Sustainability and Environmental Impact, 2017-2022 (US$ Mn)
TABLE 292 Italy 3D Printing in Oil and Gas Market, by Sustainability and Environmental Impact, 2023-2030 (US$ Mn)
TABLE 293 Italy 3D Printing in Oil and Gas Market, by Certification and Standardization, 2017-2022 (US$ Mn)
TABLE 294 Italy 3D Printing in Oil and Gas Market, by Certification and Standardization, 2023-2030 (US$ Mn)
TABLE 295 Italy 3D Printing in Oil and Gas Market, by Collaborative Initiatives, 2017-2022 (US$ Mn)
TABLE 296 Italy 3D Printing in Oil and Gas Market, by Collaborative Initiatives, 2023-2030 (US$ Mn)
TABLE 297 Italy 3D Printing in Oil and Gas Market, by Remote and Harsh Environments, 2017-2022 (US$ Mn)
TABLE 298 Italy 3D Printing in Oil and Gas Market, by Remote and Harsh Environments, 2023-2030 (US$ Mn)
TABLE 299 Spain 3D Printing in Oil and Gas Market, by Manufacturing of Components, 2017-2022 (US$ Mn)
TABLE 300 Spain 3D Printing in Oil and Gas Market, by Manufacturing of Components, 2023-2030 (US$ Mn)
TABLE 301 Spain 3D Printing in Oil and Gas Market, by Supply Chain Optimization, 2017-2022 (US$ Mn)
TABLE 302 Spain 3D Printing in Oil and Gas Market, by Supply Chain Optimization, 2023-2030 (US$ Mn)
TABLE 303 Spain 3D Printing in Oil and Gas Market, by Materials Development, 2017-2022 (US$ Mn)
TABLE 304 Spain 3D Printing in Oil and Gas Market, by Materials Development, 2023-2030 (US$ Mn)
TABLE 305 Spain 3D Printing in Oil and Gas Market, by Retrofitting and Maintenance, 2017-2022 (US$ Mn)
TABLE 306 Spain 3D Printing in Oil and Gas Market, by Retrofitting and Maintenance, 2023-2030 (US$ Mn)
TABLE 307 Spain 3D Printing in Oil and Gas Market, by Tooling and Equipment Production, 2017-2022 (US$ Mn)
TABLE 308 Spain 3D Printing in Oil and Gas Market, by Tooling and Equipment Production, 2023-2030 (US$ Mn)
TABLE 309 Spain 3D Printing in Oil and Gas Market, by Prototyping and Design Optimization, 2017-2022 (US$ Mn)
TABLE 310 Spain 3D Printing in Oil and Gas Market, by Prototyping and Design Optimization, 2023-2030 (US$ Mn)
TABLE 311 Spain 3D Printing in Oil and Gas Market, by Reducing Weight and Enhancing Performance, 2017-2022 (US$ Mn)
TABLE 312 Spain 3D Printing in Oil and Gas Market, by Reducing Weight and Enhancing Performance, 2023-2030 (US$ Mn)
TABLE 313 Spain 3D Printing in Oil and Gas Market, by Drilling and Exploration Applications, 2017-2022 (US$ Mn)
TABLE 314 Spain 3D Printing in Oil and Gas Market, by Drilling and Exploration Applications, 2023-2030 (US$ Mn)
TABLE 315 Spain 3D Printing in Oil and Gas Market, by Sustainability and Environmental Impact, 2017-2022 (US$ Mn)
TABLE 316 Spain 3D Printing in Oil and Gas Market, by Sustainability and Environmental Impact, 2023-2030 (US$ Mn)
TABLE 317 Spain 3D Printing in Oil and Gas Market, by Certification and Standardization, 2017-2022 (US$ Mn)
TABLE 318 Spain 3D Printing in Oil and Gas Market, by Certification and Standardization, 2023-2030 (US$ Mn)
TABLE 319 Spain 3D Printing in Oil and Gas Market, by Collaborative Initiatives, 2017-2022 (US$ Mn)
TABLE 320 Spain 3D Printing in Oil and Gas Market, by Collaborative Initiatives, 2023-2030 (US$ Mn)
TABLE 321 Spain 3D Printing in Oil and Gas Market, by Remote and Harsh Environments, 2017-2022 (US$ Mn)
TABLE 322 Spain 3D Printing in Oil and Gas Market, by Remote and Harsh Environments, 2023-2030 (US$ Mn)
TABLE 323 Benelux 3D Printing in Oil and Gas Market, by Manufacturing of Components, 2017-2022 (US$ Mn)
TABLE 324 Benelux 3D Printing in Oil and Gas Market, by Manufacturing of Components, 2023-2030 (US$ Mn)
TABLE 325 Benelux 3D Printing in Oil and Gas Market, by Supply Chain Optimization, 2017-2022 (US$ Mn)
TABLE 326 Benelux 3D Printing in Oil and Gas Market, by Supply Chain Optimization, 2023-2030 (US$ Mn)
TABLE 327 Benelux 3D Printing in Oil and Gas Market, by Materials Development, 2017-2022 (US$ Mn)
TABLE 328 Benelux 3D Printing in Oil and Gas Market, by Materials Development, 2023-2030 (US$ Mn)
TABLE 329 Benelux 3D Printing in Oil and Gas Market, by Retrofitting and Maintenance, 2017-2022 (US$ Mn)
TABLE 330 Benelux 3D Printing in Oil and Gas Market, by Retrofitting and Maintenance, 2023-2030 (US$ Mn)
TABLE 331 Benelux 3D Printing in Oil and Gas Market, by Tooling and Equipment Production, 2017-2022 (US$ Mn)
TABLE 332 Benelux 3D Printing in Oil and Gas Market, by Tooling and Equipment Production, 2023-2030 (US$ Mn)
TABLE 333 Benelux 3D Printing in Oil and Gas Market, by Prototyping and Design Optimization, 2017-2022 (US$ Mn)
TABLE 334 Benelux 3D Printing in Oil and Gas Market, by Prototyping and Design Optimization, 2023-2030 (US$ Mn)
TABLE 335 Benelux 3D Printing in Oil and Gas Market, by Reducing Weight and Enhancing Performance, 2017-2022 (US$ Mn)
TABLE 336 Benelux 3D Printing in Oil and Gas Market, by Reducing Weight and Enhancing Performance, 2023-2030 (US$ Mn)
TABLE 337 Benelux 3D Printing in Oil and Gas Market, by Drilling and Exploration Applications, 2017-2022 (US$ Mn)
TABLE 338 Benelux 3D Printing in Oil and Gas Market, by Drilling and Exploration Applications, 2023-2030 (US$ Mn)
TABLE 339 Benelux 3D Printing in Oil and Gas Market, by Sustainability and Environmental Impact, 2017-2022 (US$ Mn)
TABLE 340 Benelux 3D Printing in Oil and Gas Market, by Sustainability and Environmental Impact, 2023-2030 (US$ Mn)
TABLE 341 Benelux 3D Printing in Oil and Gas Market, by Certification and Standardization, 2017-2022 (US$ Mn)
TABLE 342 Benelux 3D Printing in Oil and Gas Market, by Certification and Standardization, 2023-2030 (US$ Mn)
TABLE 343 Benelux 3D Printing in Oil and Gas Market, by Collaborative Initiatives, 2017-2022 (US$ Mn)
TABLE 344 Benelux 3D Printing in Oil and Gas Market, by Collaborative Initiatives, 2023-2030 (US$ Mn)
TABLE 345 Benelux 3D Printing in Oil and Gas Market, by Remote and Harsh Environments, 2017-2022 (US$ Mn)
TABLE 346 Benelux 3D Printing in Oil and Gas Market, by Remote and Harsh Environments, 2023-2030 (US$ Mn)
TABLE 347 Russia 3D Printing in Oil and Gas Market, by Manufacturing of Components, 2017-2022 (US$ Mn)
TABLE 348 Russia 3D Printing in Oil and Gas Market, by Manufacturing of Components, 2023-2030 (US$ Mn)
TABLE 349 Russia 3D Printing in Oil and Gas Market, by Supply Chain Optimization, 2017-2022 (US$ Mn)
TABLE 350 Russia 3D Printing in Oil and Gas Market, by Supply Chain Optimization, 2023-2030 (US$ Mn)
TABLE 351 Russia 3D Printing in Oil and Gas Market, by Materials Development, 2017-2022 (US$ Mn)
TABLE 352 Russia 3D Printing in Oil and Gas Market, by Materials Development, 2023-2030 (US$ Mn)
TABLE 353 Russia 3D Printing in Oil and Gas Market, by Retrofitting and Maintenance, 2017-2022 (US$ Mn)
TABLE 354 Russia 3D Printing in Oil and Gas Market, by Retrofitting and Maintenance, 2023-2030 (US$ Mn)
TABLE 355 Russia 3D Printing in Oil and Gas Market, by Tooling and Equipment Production, 2017-2022 (US$ Mn)
TABLE 356 Russia 3D Printing in Oil and Gas Market, by Tooling and Equipment Production, 2023-2030 (US$ Mn)
TABLE 357 Russia 3D Printing in Oil and Gas Market, by Prototyping and Design Optimization, 2017-2022 (US$ Mn)
TABLE 358 Russia 3D Printing in Oil and Gas Market, by Prototyping and Design Optimization, 2023-2030 (US$ Mn)
TABLE 359 Russia 3D Printing in Oil and Gas Market, by Reducing Weight and Enhancing Performance, 2017-2022 (US$ Mn)
TABLE 360 Russia 3D Printing in Oil and Gas Market, by Reducing Weight and Enhancing Performance, 2023-2030 (US$ Mn)
TABLE 361 Russia 3D Printing in Oil and Gas Market, by Drilling and Exploration Applications, 2017-2022 (US$ Mn)
TABLE 362 Russia 3D Printing in Oil and Gas Market, by Drilling and Exploration Applications, 2023-2030 (US$ Mn)
TABLE 363 Russia 3D Printing in Oil and Gas Market, by Sustainability and Environmental Impact, 2017-2022 (US$ Mn)
TABLE 364 Russia 3D Printing in Oil and Gas Market, by Sustainability and Environmental Impact, 2023-2030 (US$ Mn)
TABLE 365 Russia 3D Printing in Oil and Gas Market, by Certification and Standardization, 2017-2022 (US$ Mn)
TABLE 366 Russia 3D Printing in Oil and Gas Market, by Certification and Standardization, 2023-2030 (US$ Mn)
TABLE 367 Russia 3D Printing in Oil and Gas Market, by Collaborative Initiatives, 2017-2022 (US$ Mn)
TABLE 368 Russia 3D Printing in Oil and Gas Market, by Collaborative Initiatives, 2023-2030 (US$ Mn)
TABLE 369 Russia 3D Printing in Oil and Gas Market, by Remote and Harsh Environments, 2017-2022 (US$ Mn)
TABLE 370 Russia 3D Printing in Oil and Gas Market, by Remote and Harsh Environments, 2023-2030 (US$ Mn)
TABLE 371 Rest of Europe 3D Printing in Oil and Gas Market, by Manufacturing of Components, 2017-2022 (US$ Mn)
TABLE 372 Rest of Europe 3D Printing in Oil and Gas Market, by Manufacturing of Components, 2023-2030 (US$ Mn)
TABLE 373 Rest of Europe 3D Printing in Oil and Gas Market, by Supply Chain Optimization, 2017-2022 (US$ Mn)
TABLE 374 Rest of Europe 3D Printing in Oil and Gas Market, by Supply Chain Optimization, 2023-2030 (US$ Mn)
TABLE 375 Rest of Europe 3D Printing in Oil and Gas Market, by Materials Development, 2017-2022 (US$ Mn)
TABLE 376 Rest of Europe 3D Printing in Oil and Gas Market, by Materials Development, 2023-2030 (US$ Mn)
TABLE 377 Rest of Europe 3D Printing in Oil and Gas Market, by Retrofitting and Maintenance, 2017-2022 (US$ Mn)
TABLE 378 Rest of Europe 3D Printing in Oil and Gas Market, by Retrofitting and Maintenance, 2023-2030 (US$ Mn)
TABLE 379 Rest of Europe 3D Printing in Oil and Gas Market, by Tooling and Equipment Production, 2017-2022 (US$ Mn)
TABLE 380 Rest of Europe 3D Printing in Oil and Gas Market, by Tooling and Equipment Production, 2023-2030 (US$ Mn)
TABLE 381 Rest of Europe 3D Printing in Oil and Gas Market, by Prototyping and Design Optimization, 2017-2022 (US$ Mn)
TABLE 382 Rest of Europe 3D Printing in Oil and Gas Market, by Prototyping and Design Optimization, 2023-2030 (US$ Mn)
TABLE 383 Rest of Europe 3D Printing in Oil and Gas Market, by Reducing Weight and Enhancing Performance, 2017-2022 (US$ Mn)
TABLE 384 Rest of Europe 3D Printing in Oil and Gas Market, by Reducing Weight and Enhancing Performance, 2023-2030 (US$ Mn)
TABLE 385 Rest of Europe 3D Printing in Oil and Gas Market, by Drilling and Exploration Applications, 2017-2022 (US$ Mn)
TABLE 386 Rest of Europe 3D Printing in Oil and Gas Market, by Drilling and Exploration Applications, 2023-2030 (US$ Mn)
TABLE 387 Rest of Europe 3D Printing in Oil and Gas Market, by Sustainability and Environmental Impact, 2017-2022 (US$ Mn)
TABLE 388 Rest of Europe 3D Printing in Oil and Gas Market, by Sustainability and Environmental Impact, 2023-2030 (US$ Mn)
TABLE 389 Rest of Europe 3D Printing in Oil and Gas Market, by Certification and Standardization, 2017-2022 (US$ Mn)
TABLE 390 Rest of Europe 3D Printing in Oil and Gas Market, by Certification and Standardization, 2023-2030 (US$ Mn)
TABLE 391 Rest of Europe 3D Printing in Oil and Gas Market, by Collaborative Initiatives, 2017-2022 (US$ Mn)
TABLE 392 Rest of Europe 3D Printing in Oil and Gas Market, by Collaborative Initiatives, 2023-2030 (US$ Mn)
TABLE 393 Rest of Europe 3D Printing in Oil and Gas Market, by Remote and Harsh Environments, 2017-2022 (US$ Mn)
TABLE 394 Rest of Europe 3D Printing in Oil and Gas Market, by Remote and Harsh Environments, 2023-2030 (US$ Mn)
TABLE 395 Asia Pacific 3D Printing in Oil and Gas Market, by Manufacturing of Components, 2017-2022 (US$ Mn)
TABLE 396 Asia Pacific 3D Printing in Oil and Gas Market, by Manufacturing of Components, 2023-2030 (US$ Mn)
TABLE 397 Asia Pacific 3D Printing in Oil and Gas Market, by Supply Chain Optimization, 2017-2022 (US$ Mn)
TABLE 398 Asia Pacific 3D Printing in Oil and Gas Market, by Supply Chain Optimization, 2023-2030 (US$ Mn)
TABLE 399 Asia Pacific 3D Printing in Oil and Gas Market, by Materials Development, 2017-2022 (US$ Mn)
TABLE 400 Asia Pacific 3D Printing in Oil and Gas Market, by Materials Development, 2023-2030 (US$ Mn)
TABLE 401 Asia Pacific 3D Printing in Oil and Gas Market, by Retrofitting and Maintenance, 2017-2022 (US$ Mn)
TABLE 402 Asia Pacific 3D Printing in Oil and Gas Market, by Retrofitting and Maintenance, 2023-2030 (US$ Mn)
TABLE 403 Asia Pacific 3D Printing in Oil and Gas Market, by Tooling and Equipment Production, 2017-2022 (US$ Mn)
TABLE 404 Asia Pacific 3D Printing in Oil and Gas Market, by Tooling and Equipment Production, 2023-2030 (US$ Mn)
TABLE 405 Asia Pacific 3D Printing in Oil and Gas Market, by Prototyping and Design Optimization, 2017-2022 (US$ Mn)
TABLE 406 Asia Pacific 3D Printing in Oil and Gas Market, by Prototyping and Design Optimization, 2023-2030 (US$ Mn)
TABLE 407 Asia Pacific 3D Printing in Oil and Gas Market, by Reducing Weight and Enhancing Performance, 2017-2022 (US$ Mn)
TABLE 408 Asia Pacific 3D Printing in Oil and Gas Market, by Reducing Weight and Enhancing Performance, 2023-2030 (US$ Mn)
TABLE 409 Asia Pacific 3D Printing in Oil and Gas Market, by Drilling and Exploration Applications, 2017-2022 (US$ Mn)
TABLE 410 Asia Pacific 3D Printing in Oil and Gas Market, by Drilling and Exploration Applications, 2023-2030 (US$ Mn)
TABLE 411 Asia Pacific 3D Printing in Oil and Gas Market, by Sustainability and Environmental Impact, 2017-2022 (US$ Mn)
TABLE 412 Asia Pacific 3D Printing in Oil and Gas Market, by Sustainability and Environmental Impact, 2023-2030 (US$ Mn)
TABLE 413 Asia Pacific 3D Printing in Oil and Gas Market, by Certification and Standardization, 2017-2022 (US$ Mn)
TABLE 414 Asia Pacific 3D Printing in Oil and Gas Market, by Certification and Standardization, 2023-2030 (US$ Mn)
TABLE 415 Asia Pacific 3D Printing in Oil and Gas Market, by Collaborative Initiatives, 2017-2022 (US$ Mn)
TABLE 416 Asia Pacific 3D Printing in Oil and Gas Market, by Collaborative Initiatives, 2023-2030 (US$ Mn)
TABLE 417 Asia Pacific 3D Printing in Oil and Gas Market, by Remote and Harsh Environments, 2017-2022 (US$ Mn)
TABLE 418 Asia Pacific 3D Printing in Oil and Gas Market, by Remote and Harsh Environments, 2023-2030 (US$ Mn)
TABLE 419 China 3D Printing in Oil and Gas Market, by Manufacturing of Components, 2017-2022 (US$ Mn)
TABLE 420 China 3D Printing in Oil and Gas Market, by Manufacturing of Components, 2023-2030 (US$ Mn)
TABLE 421 China 3D Printing in Oil and Gas Market, by Supply Chain Optimization, 2017-2022 (US$ Mn)
TABLE 422 China 3D Printing in Oil and Gas Market, by Supply Chain Optimization, 2023-2030 (US$ Mn)
TABLE 423 China 3D Printing in Oil and Gas Market, by Materials Development, 2017-2022 (US$ Mn)
TABLE 424 China 3D Printing in Oil and Gas Market, by Materials Development, 2023-2030 (US$ Mn)
TABLE 425 China 3D Printing in Oil and Gas Market, by Retrofitting and Maintenance, 2017-2022 (US$ Mn)
TABLE 426 China 3D Printing in Oil and Gas Market, by Retrofitting and Maintenance, 2023-2030 (US$ Mn)
TABLE 427 China 3D Printing in Oil and Gas Market, by Tooling and Equipment Production, 2017-2022 (US$ Mn)
TABLE 428 China 3D Printing in Oil and Gas Market, by Tooling and Equipment Production, 2023-2030 (US$ Mn)
TABLE 429 China 3D Printing in Oil and Gas Market, by Prototyping and Design Optimization, 2017-2022 (US$ Mn)
TABLE 430 China 3D Printing in Oil and Gas Market, by Prototyping and Design Optimization, 2023-2030 (US$ Mn)
TABLE 431 China 3D Printing in Oil and Gas Market, by Reducing Weight and Enhancing Performance, 2017-2022 (US$ Mn)
TABLE 432 China 3D Printing in Oil and Gas Market, by Reducing Weight and Enhancing Performance, 2023-2030 (US$ Mn)
TABLE 433 China 3D Printing in Oil and Gas Market, by Drilling and Exploration Applications, 2017-2022 (US$ Mn)
TABLE 434 China 3D Printing in Oil and Gas Market, by Drilling and Exploration Applications, 2023-2030 (US$ Mn)
TABLE 435 China 3D Printing in Oil and Gas Market, by Sustainability and Environmental Impact, 2017-2022 (US$ Mn)
TABLE 436 China 3D Printing in Oil and Gas Market, by Sustainability and Environmental Impact, 2023-2030 (US$ Mn)
TABLE 437 China 3D Printing in Oil and Gas Market, by Certification and Standardization, 2017-2022 (US$ Mn)
TABLE 438 China 3D Printing in Oil and Gas Market, by Certification and Standardization, 2023-2030 (US$ Mn)
TABLE 439 China 3D Printing in Oil and Gas Market, by Collaborative Initiatives, 2017-2022 (US$ Mn)
TABLE 440 China 3D Printing in Oil and Gas Market, by Collaborative Initiatives, 2023-2030 (US$ Mn)
TABLE 441 China 3D Printing in Oil and Gas Market, by Remote and Harsh Environments, 2017-2022 (US$ Mn)
TABLE 442 China 3D Printing in Oil and Gas Market, by Remote and Harsh Environments, 2023-2030 (US$ Mn)
TABLE 443 Japan 3D Printing in Oil and Gas Market, by Manufacturing of Components, 2017-2022 (US$ Mn)
TABLE 444 Japan 3D Printing in Oil and Gas Market, by Manufacturing of Components, 2023-2030 (US$ Mn)
TABLE 445 Japan 3D Printing in Oil and Gas Market, by Supply Chain Optimization, 2017-2022 (US$ Mn)
TABLE 446 Japan 3D Printing in Oil and Gas Market, by Supply Chain Optimization, 2023-2030 (US$ Mn)
TABLE 447 Japan 3D Printing in Oil and Gas Market, by Materials Development, 2017-2022 (US$ Mn)
TABLE 448 Japan 3D Printing in Oil and Gas Market, by Materials Development, 2023-2030 (US$ Mn)
TABLE 449 Japan 3D Printing in Oil and Gas Market, by Retrofitting and Maintenance, 2017-2022 (US$ Mn)
TABLE 450 Japan 3D Printing in Oil and Gas Market, by Retrofitting and Maintenance, 2023-2030 (US$ Mn)
TABLE 451 Japan 3D Printing in Oil and Gas Market, by Tooling and Equipment Production, 2017-2022 (US$ Mn)
TABLE 452 Japan 3D Printing in Oil and Gas Market, by Tooling and Equipment Production, 2023-2030 (US$ Mn)
TABLE 453 Japan 3D Printing in Oil and Gas Market, by Prototyping and Design Optimization, 2017-2022 (US$ Mn)
TABLE 454 Japan 3D Printing in Oil and Gas Market, by Prototyping and Design Optimization, 2023-2030 (US$ Mn)
TABLE 455 Japan 3D Printing in Oil and Gas Market, by Reducing Weight and Enhancing Performance, 2017-2022 (US$ Mn)
TABLE 456 Japan 3D Printing in Oil and Gas Market, by Reducing Weight and Enhancing Performance, 2023-2030 (US$ Mn)
TABLE 457 Japan 3D Printing in Oil and Gas Market, by Drilling and Exploration Applications, 2017-2022 (US$ Mn)
TABLE 458 Japan 3D Printing in Oil and Gas Market, by Drilling and Exploration Applications, 2023-2030 (US$ Mn)
TABLE 459 Japan 3D Printing in Oil and Gas Market, by Sustainability and Environmental Impact, 2017-2022 (US$ Mn)
TABLE 460 Japan 3D Printing in Oil and Gas Market, by Sustainability and Environmental Impact, 2023-2030 (US$ Mn)
TABLE 461 Japan 3D Printing in Oil and Gas Market, by Certification and Standardization, 2017-2022 (US$ Mn)
TABLE 462 Japan 3D Printing in Oil and Gas Market, by Certification and Standardization, 2023-2030 (US$ Mn)
TABLE 463 Japan 3D Printing in Oil and Gas Market, by Collaborative Initiatives, 2017-2022 (US$ Mn)
TABLE 464 Japan 3D Printing in Oil and Gas Market, by Collaborative Initiatives, 2023-2030 (US$ Mn)
TABLE 465 Japan 3D Printing in Oil and Gas Market, by Remote and Harsh Environments, 2017-2022 (US$ Mn)
TABLE 466 Japan 3D Printing in Oil and Gas Market, by Remote and Harsh Environments, 2023-2030 (US$ Mn)
TABLE 467 India 3D Printing in Oil and Gas Market, by Manufacturing of Components, 2017-2022 (US$ Mn)
TABLE 468 India 3D Printing in Oil and Gas Market, by Manufacturing of Components, 2023-2030 (US$ Mn)
TABLE 469 India 3D Printing in Oil and Gas Market, by Supply Chain Optimization, 2017-2022 (US$ Mn)
TABLE 470 India 3D Printing in Oil and Gas Market, by Supply Chain Optimization, 2023-2030 (US$ Mn)
TABLE 471 India 3D Printing in Oil and Gas Market, by Materials Development, 2017-2022 (US$ Mn)
TABLE 472 India 3D Printing in Oil and Gas Market, by Materials Development, 2023-2030 (US$ Mn)
TABLE 473 India 3D Printing in Oil and Gas Market, by Retrofitting and Maintenance, 2017-2022 (US$ Mn)
TABLE 474 India 3D Printing in Oil and Gas Market, by Retrofitting and Maintenance, 2023-2030 (US$ Mn)
TABLE 475 India 3D Printing in Oil and Gas Market, by Tooling and Equipment Production, 2017-2022 (US$ Mn)
TABLE 476 India 3D Printing in Oil and Gas Market, by Tooling and Equipment Production, 2023-2030 (US$ Mn)
TABLE 477 India 3D Printing in Oil and Gas Market, by Prototyping and Design Optimization, 2017-2022 (US$ Mn)
TABLE 478 India 3D Printing in Oil and Gas Market, by Prototyping and Design Optimization, 2023-2030 (US$ Mn)
TABLE 479 India 3D Printing in Oil and Gas Market, by Reducing Weight and Enhancing Performance, 2017-2022 (US$ Mn)
TABLE 480 India 3D Printing in Oil and Gas Market, by Reducing Weight and Enhancing Performance, 2023-2030 (US$ Mn)
TABLE 481 India 3D Printing in Oil and Gas Market, by Drilling and Exploration Applications, 2017-2022 (US$ Mn)
TABLE 482 India 3D Printing in Oil and Gas Market, by Drilling and Exploration Applications, 2023-2030 (US$ Mn)
TABLE 483 India 3D Printing in Oil and Gas Market, by Sustainability and Environmental Impact, 2017-2022 (US$ Mn)
TABLE 484 India 3D Printing in Oil and Gas Market, by Sustainability and Environmental Impact, 2023-2030 (US$ Mn)
TABLE 485 India 3D Printing in Oil and Gas Market, by Certification and Standardization, 2017-2022 (US$ Mn)
TABLE 486 India 3D Printing in Oil and Gas Market, by Certification and Standardization, 2023-2030 (US$ Mn)
TABLE 487 India 3D Printing in Oil and Gas Market, by Collaborative Initiatives, 2017-2022 (US$ Mn)
TABLE 488 India 3D Printing in Oil and Gas Market, by Collaborative Initiatives, 2023-2030 (US$ Mn)
TABLE 489 India 3D Printing in Oil and Gas Market, by Remote and Harsh Environments, 2017-2022 (US$ Mn)
TABLE 490 India 3D Printing in Oil and Gas Market, by Remote and Harsh Environments, 2023-2030 (US$ Mn)
TABLE 491 South Korea 3D Printing in Oil and Gas Market, by Manufacturing of Components, 2017-2022 (US$ Mn)
TABLE 492 South Korea 3D Printing in Oil and Gas Market, by Manufacturing of Components, 2023-2030 (US$ Mn)
TABLE 493 South Korea 3D Printing in Oil and Gas Market, by Supply Chain Optimization, 2017-2022 (US$ Mn)
TABLE 494 South Korea 3D Printing in Oil and Gas Market, by Supply Chain Optimization, 2023-2030 (US$ Mn)
TABLE 495 South Korea 3D Printing in Oil and Gas Market, by Materials Development, 2017-2022 (US$ Mn)
TABLE 496 South Korea 3D Printing in Oil and Gas Market, by Materials Development, 2023-2030 (US$ Mn)
TABLE 497 South Korea 3D Printing in Oil and Gas Market, by Retrofitting and Maintenance, 2017-2022 (US$ Mn)
TABLE 498 South Korea 3D Printing in Oil and Gas Market, by Retrofitting and Maintenance, 2023-2030 (US$ Mn)
TABLE 499 South Korea 3D Printing in Oil and Gas Market, by Tooling and Equipment Production, 2017-2022 (US$ Mn)
TABLE 500 South Korea 3D Printing in Oil and Gas Market, by Tooling and Equipment Production, 2023-2030 (US$ Mn)
TABLE 501 South Korea 3D Printing in Oil and Gas Market, by Prototyping and Design Optimization, 2017-2022 (US$ Mn)
TABLE 502 South Korea 3D Printing in Oil and Gas Market, by Prototyping and Design Optimization, 2023-2030 (US$ Mn)
TABLE 503 South Korea 3D Printing in Oil and Gas Market, by Reducing Weight and Enhancing Performance, 2017-2022 (US$ Mn)
TABLE 504 South Korea 3D Printing in Oil and Gas Market, by Reducing Weight and Enhancing Performance, 2023-2030 (US$ Mn)
TABLE 505 South Korea 3D Printing in Oil and Gas Market, by Drilling and Exploration Applications, 2017-2022 (US$ Mn)
TABLE 506 South Korea 3D Printing in Oil and Gas Market, by Drilling and Exploration Applications, 2023-2030 (US$ Mn)
TABLE 507 South Korea 3D Printing in Oil and Gas Market, by Sustainability and Environmental Impact, 2017-2022 (US$ Mn)
TABLE 508 South Korea 3D Printing in Oil and Gas Market, by Sustainability and Environmental Impact, 2023-2030 (US$ Mn)
TABLE 509 South Korea 3D Printing in Oil and Gas Market, by Certification and Standardization, 2017-2022 (US$ Mn)
TABLE 510 South Korea 3D Printing in Oil and Gas Market, by Certification and Standardization, 2023-2030 (US$ Mn)
TABLE 511 South Korea 3D Printing in Oil and Gas Market, by Collaborative Initiatives, 2017-2022 (US$ Mn)
TABLE 512 South Korea 3D Printing in Oil and Gas Market, by Collaborative Initiatives, 2023-2030 (US$ Mn)
TABLE 513 South Korea 3D Printing in Oil and Gas Market, by Remote and Harsh Environments, 2017-2022 (US$ Mn)
TABLE 514 South Korea 3D Printing in Oil and Gas Market, by Remote and Harsh Environments, 2023-2030 (US$ Mn)
TABLE 515 South-East Asia 3D Printing in Oil and Gas Market, by Manufacturing of Components, 2017-2022 (US$ Mn)
TABLE 516 South-East Asia 3D Printing in Oil and Gas Market, by Manufacturing of Components, 2023-2030 (US$ Mn)
TABLE 517 South-East Asia 3D Printing in Oil and Gas Market, by Supply Chain Optimization, 2017-2022 (US$ Mn)
TABLE 518 South-East Asia 3D Printing in Oil and Gas Market, by Supply Chain Optimization, 2023-2030 (US$ Mn)
TABLE 519 South-East Asia 3D Printing in Oil and Gas Market, by Materials Development, 2017-2022 (US$ Mn)
TABLE 520 South-East Asia 3D Printing in Oil and Gas Market, by Materials Development, 2023-2030 (US$ Mn)
TABLE 521 South-East Asia 3D Printing in Oil and Gas Market, by Retrofitting and Maintenance, 2017-2022 (US$ Mn)
TABLE 522 South-East Asia 3D Printing in Oil and Gas Market, by Retrofitting and Maintenance, 2023-2030 (US$ Mn)
TABLE 523 South-East Asia 3D Printing in Oil and Gas Market, by Tooling and Equipment Production, 2017-2022 (US$ Mn)
TABLE 524 South-East Asia 3D Printing in Oil and Gas Market, by Tooling and Equipment Production, 2023-2030 (US$ Mn)
TABLE 525 South-East Asia 3D Printing in Oil and Gas Market, by Prototyping and Design Optimization, 2017-2022 (US$ Mn)
TABLE 526 South-East Asia 3D Printing in Oil and Gas Market, by Prototyping and Design Optimization, 2023-2030 (US$ Mn)
TABLE 527 South-East Asia 3D Printing in Oil and Gas Market, by Reducing Weight and Enhancing Performance, 2017-2022 (US$ Mn)
TABLE 528 South-East Asia 3D Printing in Oil and Gas Market, by Reducing Weight and Enhancing Performance, 2023-2030 (US$ Mn)
TABLE 529 South-East Asia 3D Printing in Oil and Gas Market, by Drilling and Exploration Applications, 2017-2022 (US$ Mn)
TABLE 530 South-East Asia 3D Printing in Oil and Gas Market, by Drilling and Exploration Applications, 2023-2030 (US$ Mn)
TABLE 531 South-East Asia 3D Printing in Oil and Gas Market, by Sustainability and Environmental Impact, 2017-2022 (US$ Mn)
TABLE 532 South-East Asia 3D Printing in Oil and Gas Market, by Sustainability and Environmental Impact, 2023-2030 (US$ Mn)
TABLE 533 South-East Asia 3D Printing in Oil and Gas Market, by Certification and Standardization, 2017-2022 (US$ Mn)
TABLE 534 South-East Asia 3D Printing in Oil and Gas Market, by Certification and Standardization, 2023-2030 (US$ Mn)
TABLE 535 South-East Asia 3D Printing in Oil and Gas Market, by Collaborative Initiatives, 2017-2022 (US$ Mn)
TABLE 536 South-East Asia 3D Printing in Oil and Gas Market, by Collaborative Initiatives, 2023-2030 (US$ Mn)
TABLE 537 South-East Asia 3D Printing in Oil and Gas Market, by Remote and Harsh Environments, 2017-2022 (US$ Mn)
TABLE 538 South-East Asia 3D Printing in Oil and Gas Market, by Remote and Harsh Environments, 2023-2030 (US$ Mn)
TABLE 539 Rest of Asia Pacific 3D Printing in Oil and Gas Market, by Manufacturing of Components, 2017-2022 (US$ Mn)
TABLE 540 Rest of Asia Pacific 3D Printing in Oil and Gas Market, by Manufacturing of Components, 2023-2030 (US$ Mn)
TABLE 541 Rest of Asia Pacific 3D Printing in Oil and Gas Market, by Supply Chain Optimization, 2017-2022 (US$ Mn)
TABLE 542 Rest of Asia Pacific 3D Printing in Oil and Gas Market, by Supply Chain Optimization, 2023-2030 (US$ Mn)
TABLE 543 Rest of Asia Pacific 3D Printing in Oil and Gas Market, by Materials Development, 2017-2022 (US$ Mn)
TABLE 544 Rest of Asia Pacific 3D Printing in Oil and Gas Market, by Materials Development, 2023-2030 (US$ Mn)
TABLE 545 Rest of Asia Pacific 3D Printing in Oil and Gas Market, by Retrofitting and Maintenance, 2017-2022 (US$ Mn)
TABLE 546 Rest of Asia Pacific 3D Printing in Oil and Gas Market, by Retrofitting and Maintenance, 2023-2030 (US$ Mn)
TABLE 547 Rest of Asia Pacific 3D Printing in Oil and Gas Market, by Tooling and Equipment Production, 2017-2022 (US$ Mn)
TABLE 548 Rest of Asia Pacific 3D Printing in Oil and Gas Market, by Tooling and Equipment Production, 2023-2030 (US$ Mn)
TABLE 549 Rest of Asia Pacific 3D Printing in Oil and Gas Market, by Prototyping and Design Optimization, 2017-2022 (US$ Mn)
TABLE 550 Rest of Asia Pacific 3D Printing in Oil and Gas Market, by Prototyping and Design Optimization, 2023-2030 (US$ Mn)
TABLE 551 Rest of Asia Pacific 3D Printing in Oil and Gas Market, by Reducing Weight and Enhancing Performance, 2017-2022 (US$ Mn)
TABLE 552 Rest of Asia Pacific 3D Printing in Oil and Gas Market, by Reducing Weight and Enhancing Performance, 2023-2030 (US$ Mn)
TABLE 553 Rest of Asia Pacific 3D Printing in Oil and Gas Market, by Drilling and Exploration Applications, 2017-2022 (US$ Mn)
TABLE 554 Rest of Asia Pacific 3D Printing in Oil and Gas Market, by Drilling and Exploration Applications, 2023-2030 (US$ Mn)
TABLE 555 Rest of Asia Pacific 3D Printing in Oil and Gas Market, by Sustainability and Environmental Impact, 2017-2022 (US$ Mn)
TABLE 556 Rest of Asia Pacific 3D Printing in Oil and Gas Market, by Sustainability and Environmental Impact, 2023-2030 (US$ Mn)
TABLE 557 Rest of Asia Pacific 3D Printing in Oil and Gas Market, by Certification and Standardization, 2017-2022 (US$ Mn)
TABLE 558 Rest of Asia Pacific 3D Printing in Oil and Gas Market, by Certification and Standardization, 2023-2030 (US$ Mn)
TABLE 559 Rest of Asia Pacific 3D Printing in Oil and Gas Market, by Collaborative Initiatives, 2017-2022 (US$ Mn)
TABLE 560 Rest of Asia Pacific 3D Printing in Oil and Gas Market, by Collaborative Initiatives, 2023-2030 (US$ Mn)
TABLE 561 Rest of Asia Pacific 3D Printing in Oil and Gas Market, by Remote and Harsh Environments, 2017-2022 (US$ Mn)
TABLE 562 Rest of Asia Pacific 3D Printing in Oil and Gas Market, by Remote and Harsh Environments, 2023-2030 (US$ Mn)
TABLE 563 Latin America 3D Printing in Oil and Gas Market, by Manufacturing of Components, 2017-2022 (US$ Mn)
TABLE 564 Latin America 3D Printing in Oil and Gas Market, by Manufacturing of Components, 2023-2030 (US$ Mn)
TABLE 565 Latin America 3D Printing in Oil and Gas Market, by Supply Chain Optimization, 2017-2022 (US$ Mn)
TABLE 566 Latin America 3D Printing in Oil and Gas Market, by Supply Chain Optimization, 2023-2030 (US$ Mn)
TABLE 567 Latin America 3D Printing in Oil and Gas Market, by Materials Development, 2017-2022 (US$ Mn)
TABLE 568 Latin America 3D Printing in Oil and Gas Market, by Materials Development, 2023-2030 (US$ Mn)
TABLE 569 Latin America 3D Printing in Oil and Gas Market, by Retrofitting and Maintenance, 2017-2022 (US$ Mn)
TABLE 570 Latin America 3D Printing in Oil and Gas Market, by Retrofitting and Maintenance, 2023-2030 (US$ Mn)
TABLE 571 Latin America 3D Printing in Oil and Gas Market, by Tooling and Equipment Production, 2017-2022 (US$ Mn)
TABLE 572 Latin America 3D Printing in Oil and Gas Market, by Tooling and Equipment Production, 2023-2030 (US$ Mn)
TABLE 573 Latin America 3D Printing in Oil and Gas Market, by Prototyping and Design Optimization, 2017-2022 (US$ Mn)
TABLE 574 Latin America 3D Printing in Oil and Gas Market, by Prototyping and Design Optimization, 2023-2030 (US$ Mn)
TABLE 575 Latin America 3D Printing in Oil and Gas Market, by Reducing Weight and Enhancing Performance, 2017-2022 (US$ Mn)
TABLE 576 Latin America 3D Printing in Oil and Gas Market, by Reducing Weight and Enhancing Performance, 2023-2030 (US$ Mn)
TABLE 577 Latin America 3D Printing in Oil and Gas Market, by Drilling and Exploration Applications, 2017-2022 (US$ Mn)
TABLE 578 Latin America 3D Printing in Oil and Gas Market, by Drilling and Exploration Applications, 2023-2030 (US$ Mn)
TABLE 579 Latin America 3D Printing in Oil and Gas Market, by Sustainability and Environmental Impact, 2017-2022 (US$ Mn)
TABLE 580 Latin America 3D Printing in Oil and Gas Market, by Sustainability and Environmental Impact, 2023-2030 (US$ Mn)
TABLE 581 Latin America 3D Printing in Oil and Gas Market, by Certification and Standardization, 2017-2022 (US$ Mn)
TABLE 582 Latin America 3D Printing in Oil and Gas Market, by Certification and Standardization, 2023-2030 (US$ Mn)
TABLE 583 Latin America 3D Printing in Oil and Gas Market, by Collaborative Initiatives, 2017-2022 (US$ Mn)
TABLE 584 Latin America 3D Printing in Oil and Gas Market, by Collaborative Initiatives, 2023-2030 (US$ Mn)
TABLE 585 Latin America 3D Printing in Oil and Gas Market, by Remote and Harsh Environments, 2017-2022 (US$ Mn)
TABLE 586 Latin America 3D Printing in Oil and Gas Market, by Remote and Harsh Environments, 2023-2030 (US$ Mn)
TABLE 587 Brazil 3D Printing in Oil and Gas Market, by Manufacturing of Components, 2017-2022 (US$ Mn)
TABLE 588 Brazil 3D Printing in Oil and Gas Market, by Manufacturing of Components, 2023-2030 (US$ Mn)
TABLE 589 Brazil 3D Printing in Oil and Gas Market, by Supply Chain Optimization, 2017-2022 (US$ Mn)
TABLE 590 Brazil 3D Printing in Oil and Gas Market, by Supply Chain Optimization, 2023-2030 (US$ Mn)
TABLE 591 Brazil 3D Printing in Oil and Gas Market, by Materials Development, 2017-2022 (US$ Mn)
TABLE 592 Brazil 3D Printing in Oil and Gas Market, by Materials Development, 2023-2030 (US$ Mn)
TABLE 593 Brazil 3D Printing in Oil and Gas Market, by Retrofitting and Maintenance, 2017-2022 (US$ Mn)
TABLE 594 Brazil 3D Printing in Oil and Gas Market, by Retrofitting and Maintenance, 2023-2030 (US$ Mn)
TABLE 595 Brazil 3D Printing in Oil and Gas Market, by Tooling and Equipment Production, 2017-2022 (US$ Mn)
TABLE 596 Brazil 3D Printing in Oil and Gas Market, by Tooling and Equipment Production, 2023-2030 (US$ Mn)
TABLE 597 Brazil 3D Printing in Oil and Gas Market, by Prototyping and Design Optimization, 2017-2022 (US$ Mn)
TABLE 598 Brazil 3D Printing in Oil and Gas Market, by Prototyping and Design Optimization, 2023-2030 (US$ Mn)
TABLE 599 Brazil 3D Printing in Oil and Gas Market, by Reducing Weight and Enhancing Performance, 2017-2022 (US$ Mn)
TABLE 600 Brazil 3D Printing in Oil and Gas Market, by Reducing Weight and Enhancing Performance, 2023-2030 (US$ Mn)
TABLE 601 Brazil 3D Printing in Oil and Gas Market, by Drilling and Exploration Applications, 2017-2022 (US$ Mn)
TABLE 602 Brazil 3D Printing in Oil and Gas Market, by Drilling and Exploration Applications, 2023-2030 (US$ Mn)
TABLE 603 Brazil 3D Printing in Oil and Gas Market, by Sustainability and Environmental Impact, 2017-2022 (US$ Mn)
TABLE 604 Brazil 3D Printing in Oil and Gas Market, by Sustainability and Environmental Impact, 2023-2030 (US$ Mn)
TABLE 605 Brazil 3D Printing in Oil and Gas Market, by Certification and Standardization, 2017-2022 (US$ Mn)
TABLE 606 Brazil 3D Printing in Oil and Gas Market, by Certification and Standardization, 2023-2030 (US$ Mn)
TABLE 607 Brazil 3D Printing in Oil and Gas Market, by Collaborative Initiatives, 2017-2022 (US$ Mn)
TABLE 608 Brazil 3D Printing in Oil and Gas Market, by Collaborative Initiatives, 2023-2030 (US$ Mn)
TABLE 609 Brazil 3D Printing in Oil and Gas Market, by Remote and Harsh Environments, 2017-2022 (US$ Mn)
TABLE 610 Brazil 3D Printing in Oil and Gas Market, by Remote and Harsh Environments, 2023-2030 (US$ Mn)
TABLE 611 Argentina 3D Printing in Oil and Gas Market, by Manufacturing of Components, 2017-2022 (US$ Mn)
TABLE 612 Argentina 3D Printing in Oil and Gas Market, by Manufacturing of Components, 2023-2030 (US$ Mn)
TABLE 613 Argentina 3D Printing in Oil and Gas Market, by Supply Chain Optimization, 2017-2022 (US$ Mn)
TABLE 614 Argentina 3D Printing in Oil and Gas Market, by Supply Chain Optimization, 2023-2030 (US$ Mn)
TABLE 615 Argentina 3D Printing in Oil and Gas Market, by Materials Development, 2017-2022 (US$ Mn)
TABLE 616 Argentina 3D Printing in Oil and Gas Market, by Materials Development, 2023-2030 (US$ Mn)
TABLE 617 Argentina 3D Printing in Oil and Gas Market, by Retrofitting and Maintenance, 2017-2022 (US$ Mn)
TABLE 618 Argentina 3D Printing in Oil and Gas Market, by Retrofitting and Maintenance, 2023-2030 (US$ Mn)
TABLE 619 Argentina 3D Printing in Oil and Gas Market, by Tooling and Equipment Production, 2017-2022 (US$ Mn)
TABLE 620 Argentina 3D Printing in Oil and Gas Market, by Tooling and Equipment Production, 2023-2030 (US$ Mn)
TABLE 621 Argentina 3D Printing in Oil and Gas Market, by Prototyping and Design Optimization, 2017-2022 (US$ Mn)
TABLE 622 Argentina 3D Printing in Oil and Gas Market, by Prototyping and Design Optimization, 2023-2030 (US$ Mn)
TABLE 623 Argentina 3D Printing in Oil and Gas Market, by Reducing Weight and Enhancing Performance, 2017-2022 (US$ Mn)
TABLE 624 Argentina 3D Printing in Oil and Gas Market, by Reducing Weight and Enhancing Performance, 2023-2030 (US$ Mn)
TABLE 625 Argentina 3D Printing in Oil and Gas Market, by Drilling and Exploration Applications, 2017-2022 (US$ Mn)
TABLE 626 Argentina 3D Printing in Oil and Gas Market, by Drilling and Exploration Applications, 2023-2030 (US$ Mn)
TABLE 627 Argentina 3D Printing in Oil and Gas Market, by Sustainability and Environmental Impact, 2017-2022 (US$ Mn)
TABLE 628 Argentina 3D Printing in Oil and Gas Market, by Sustainability and Environmental Impact, 2023-2030 (US$ Mn)
TABLE 629 Argentina 3D Printing in Oil and Gas Market, by Certification and Standardization, 2017-2022 (US$ Mn)
TABLE 630 Argentina 3D Printing in Oil and Gas Market, by Certification and Standardization, 2023-2030 (US$ Mn)
TABLE 631 Argentina 3D Printing in Oil and Gas Market, by Collaborative Initiatives, 2017-2022 (US$ Mn)
TABLE 632 Argentina 3D Printing in Oil and Gas Market, by Collaborative Initiatives, 2023-2030 (US$ Mn)
TABLE 633 Argentina 3D Printing in Oil and Gas Market, by Remote and Harsh Environments, 2017-2022 (US$ Mn)
TABLE 634 Argentina 3D Printing in Oil and Gas Market, by Remote and Harsh Environments, 2023-2030 (US$ Mn)
TABLE 635 Rest of Latin America 3D Printing in Oil and Gas Market, by Manufacturing of Components, 2017-2022 (US$ Mn)
TABLE 636 Rest of Latin America 3D Printing in Oil and Gas Market, by Manufacturing of Components, 2023-2030 (US$ Mn)
TABLE 637 Rest of Latin America 3D Printing in Oil and Gas Market, by Supply Chain Optimization, 2017-2022 (US$ Mn)
TABLE 638 Rest of Latin America 3D Printing in Oil and Gas Market, by Supply Chain Optimization, 2023-2030 (US$ Mn)
TABLE 639 Rest of Latin America 3D Printing in Oil and Gas Market, by Materials Development, 2017-2022 (US$ Mn)
TABLE 640 Rest of Latin America 3D Printing in Oil and Gas Market, by Materials Development, 2023-2030 (US$ Mn)
TABLE 641 Rest of Latin America 3D Printing in Oil and Gas Market, by Retrofitting and Maintenance, 2017-2022 (US$ Mn)
TABLE 642 Rest of Latin America 3D Printing in Oil and Gas Market, by Retrofitting and Maintenance, 2023-2030 (US$ Mn)
TABLE 643 Rest of Latin America 3D Printing in Oil and Gas Market, by Tooling and Equipment Production, 2017-2022 (US$ Mn)
TABLE 644 Rest of Latin America 3D Printing in Oil and Gas Market, by Tooling and Equipment Production, 2023-2030 (US$ Mn)
TABLE 645 Rest of Latin America 3D Printing in Oil and Gas Market, by Prototyping and Design Optimization, 2017-2022 (US$ Mn)
TABLE 646 Rest of Latin America 3D Printing in Oil and Gas Market, by Prototyping and Design Optimization, 2023-2030 (US$ Mn)
TABLE 647 Rest of Latin America 3D Printing in Oil and Gas Market, by Reducing Weight and Enhancing Performance, 2017-2022 (US$ Mn)
TABLE 648 Rest of Latin America 3D Printing in Oil and Gas Market, by Reducing Weight and Enhancing Performance, 2023-2030 (US$ Mn)
TABLE 649 Rest of Latin America 3D Printing in Oil and Gas Market, by Drilling and Exploration Applications, 2017-2022 (US$ Mn)
TABLE 650 Rest of Latin America 3D Printing in Oil and Gas Market, by Drilling and Exploration Applications, 2023-2030 (US$ Mn)
TABLE 651 Rest of Latin America 3D Printing in Oil and Gas Market, by Sustainability and Environmental Impact, 2017-2022 (US$ Mn)
TABLE 652 Rest of Latin America 3D Printing in Oil and Gas Market, by Sustainability and Environmental Impact, 2023-2030 (US$ Mn)
TABLE 653 Rest of Latin America 3D Printing in Oil and Gas Market, by Certification and Standardization, 2017-2022 (US$ Mn)
TABLE 654 Rest of Latin America 3D Printing in Oil and Gas Market, by Certification and Standardization, 2023-2030 (US$ Mn)
TABLE 655 Rest of Latin America 3D Printing in Oil and Gas Market, by Collaborative Initiatives, 2017-2022 (US$ Mn)
TABLE 656 Rest of Latin America 3D Printing in Oil and Gas Market, by Collaborative Initiatives, 2023-2030 (US$ Mn)
TABLE 657 Rest of Latin America 3D Printing in Oil and Gas Market, by Remote and Harsh Environments, 2017-2022 (US$ Mn)
TABLE 658 Rest of Latin America 3D Printing in Oil and Gas Market, by Remote and Harsh Environments, 2023-2030 (US$ Mn)
TABLE 659 Middle East 3D Printing in Oil and Gas Market, by Manufacturing of Components, 2017-2022 (US$ Mn)
TABLE 660 Middle East 3D Printing in Oil and Gas Market, by Manufacturing of Components, 2023-2030 (US$ Mn)
TABLE 661 Middle East 3D Printing in Oil and Gas Market, by Supply Chain Optimization, 2017-2022 (US$ Mn)
TABLE 662 Middle East 3D Printing in Oil and Gas Market, by Supply Chain Optimization, 2023-2030 (US$ Mn)
TABLE 663 Middle East 3D Printing in Oil and Gas Market, by Materials Development, 2017-2022 (US$ Mn)
TABLE 664 Middle East 3D Printing in Oil and Gas Market, by Materials Development, 2023-2030 (US$ Mn)
TABLE 665 Middle East 3D Printing in Oil and Gas Market, by Retrofitting and Maintenance, 2017-2022 (US$ Mn)
TABLE 666 Middle East 3D Printing in Oil and Gas Market, by Retrofitting and Maintenance, 2023-2030 (US$ Mn)
TABLE 667 Middle East 3D Printing in Oil and Gas Market, by Tooling and Equipment Production, 2017-2022 (US$ Mn)
TABLE 668 Middle East 3D Printing in Oil and Gas Market, by Tooling and Equipment Production, 2023-2030 (US$ Mn)
TABLE 669 Middle East 3D Printing in Oil and Gas Market, by Prototyping and Design Optimization, 2017-2022 (US$ Mn)
TABLE 670 Middle East 3D Printing in Oil and Gas Market, by Prototyping and Design Optimization, 2023-2030 (US$ Mn)
TABLE 671 Middle East 3D Printing in Oil and Gas Market, by Reducing Weight and Enhancing Performance, 2017-2022 (US$ Mn)
TABLE 672 Middle East 3D Printing in Oil and Gas Market, by Reducing Weight and Enhancing Performance, 2023-2030 (US$ Mn)
TABLE 673 Middle East 3D Printing in Oil and Gas Market, by Drilling and Exploration Applications, 2017-2022 (US$ Mn)
TABLE 674 Middle East 3D Printing in Oil and Gas Market, by Drilling and Exploration Applications, 2023-2030 (US$ Mn)
TABLE 675 Middle East 3D Printing in Oil and Gas Market, by Sustainability and Environmental Impact, 2017-2022 (US$ Mn)
TABLE 676 Middle East 3D Printing in Oil and Gas Market, by Sustainability and Environmental Impact, 2023-2030 (US$ Mn)
TABLE 677 Middle East 3D Printing in Oil and Gas Market, by Certification and Standardization, 2017-2022 (US$ Mn)
TABLE 678 Middle East 3D Printing in Oil and Gas Market, by Certification and Standardization, 2023-2030 (US$ Mn)
TABLE 679 Middle East 3D Printing in Oil and Gas Market, by Collaborative Initiatives, 2017-2022 (US$ Mn)
TABLE 680 Middle East 3D Printing in Oil and Gas Market, by Collaborative Initiatives, 2023-2030 (US$ Mn)
TABLE 681 Middle East 3D Printing in Oil and Gas Market, by Remote and Harsh Environments, 2017-2022 (US$ Mn)
TABLE 682 Middle East 3D Printing in Oil and Gas Market, by Remote and Harsh Environments, 2023-2030 (US$ Mn)
TABLE 683 UAE 3D Printing in Oil and Gas Market, by Manufacturing of Components, 2017-2022 (US$ Mn)
TABLE 684 UAE 3D Printing in Oil and Gas Market, by Manufacturing of Components, 2023-2030 (US$ Mn)
TABLE 685 UAE 3D Printing in Oil and Gas Market, by Supply Chain Optimization, 2017-2022 (US$ Mn)
TABLE 686 UAE 3D Printing in Oil and Gas Market, by Supply Chain Optimization, 2023-2030 (US$ Mn)
TABLE 687 UAE 3D Printing in Oil and Gas Market, by Materials Development, 2017-2022 (US$ Mn)
TABLE 688 UAE 3D Printing in Oil and Gas Market, by Materials Development, 2023-2030 (US$ Mn)
TABLE 689 UAE 3D Printing in Oil and Gas Market, by Retrofitting and Maintenance, 2017-2022 (US$ Mn)
TABLE 690 UAE 3D Printing in Oil and Gas Market, by Retrofitting and Maintenance, 2023-2030 (US$ Mn)
TABLE 691 UAE 3D Printing in Oil and Gas Market, by Tooling and Equipment Production, 2017-2022 (US$ Mn)
TABLE 692 UAE 3D Printing in Oil and Gas Market, by Tooling and Equipment Production, 2023-2030 (US$ Mn)
TABLE 693 UAE 3D Printing in Oil and Gas Market, by Prototyping and Design Optimization, 2017-2022 (US$ Mn)
TABLE 694 UAE 3D Printing in Oil and Gas Market, by Prototyping and Design Optimization, 2023-2030 (US$ Mn)
TABLE 695 UAE 3D Printing in Oil and Gas Market, by Reducing Weight and Enhancing Performance, 2017-2022 (US$ Mn)
TABLE 696 UAE 3D Printing in Oil and Gas Market, by Reducing Weight and Enhancing Performance, 2023-2030 (US$ Mn)
TABLE 697 UAE 3D Printing in Oil and Gas Market, by Drilling and Exploration Applications, 2017-2022 (US$ Mn)
TABLE 698 UAE 3D Printing in Oil and Gas Market, by Drilling and Exploration Applications, 2023-2030 (US$ Mn)
TABLE 699 UAE 3D Printing in Oil and Gas Market, by Sustainability and Environmental Impact, 2017-2022 (US$ Mn)
TABLE 700 UAE 3D Printing in Oil and Gas Market, by Sustainability and Environmental Impact, 2023-2030 (US$ Mn)
TABLE 701 UAE 3D Printing in Oil and Gas Market, by Certification and Standardization, 2017-2022 (US$ Mn)
TABLE 702 UAE 3D Printing in Oil and Gas Market, by Certification and Standardization, 2023-2030 (US$ Mn)
TABLE 703 UAE 3D Printing in Oil and Gas Market, by Collaborative Initiatives, 2017-2022 (US$ Mn)
TABLE 704 UAE 3D Printing in Oil and Gas Market, by Collaborative Initiatives, 2023-2030 (US$ Mn)
TABLE 705 UAE 3D Printing in Oil and Gas Market, by Remote and Harsh Environments, 2017-2022 (US$ Mn)
TABLE 706 UAE 3D Printing in Oil and Gas Market, by Remote and Harsh Environments, 2023-2030 (US$ Mn)
TABLE 707 Saudi Arabia 3D Printing in Oil and Gas Market, by Manufacturing of Components, 2017-2022 (US$ Mn)
TABLE 708 Saudi Arabia 3D Printing in Oil and Gas Market, by Manufacturing of Components, 2023-2030 (US$ Mn)
TABLE 709 Saudi Arabia 3D Printing in Oil and Gas Market, by Supply Chain Optimization, 2017-2022 (US$ Mn)
TABLE 710 Saudi Arabia 3D Printing in Oil and Gas Market, by Supply Chain Optimization, 2023-2030 (US$ Mn)
TABLE 711 Saudi Arabia 3D Printing in Oil and Gas Market, by Materials Development, 2017-2022 (US$ Mn)
TABLE 712 Saudi Arabia 3D Printing in Oil and Gas Market, by Materials Development, 2023-2030 (US$ Mn)
TABLE 713 Saudi Arabia 3D Printing in Oil and Gas Market, by Retrofitting and Maintenance, 2017-2022 (US$ Mn)
TABLE 714 Saudi Arabia 3D Printing in Oil and Gas Market, by Retrofitting and Maintenance, 2023-2030 (US$ Mn)
TABLE 715 Saudi Arabia 3D Printing in Oil and Gas Market, by Tooling and Equipment Production, 2017-2022 (US$ Mn)
TABLE 716 Saudi Arabia 3D Printing in Oil and Gas Market, by Tooling and Equipment Production, 2023-2030 (US$ Mn)
TABLE 717 Saudi Arabia 3D Printing in Oil and Gas Market, by Prototyping and Design Optimization, 2017-2022 (US$ Mn)
TABLE 718 Saudi Arabia 3D Printing in Oil and Gas Market, by Prototyping and Design Optimization, 2023-2030 (US$ Mn)
TABLE 719 Saudi Arabia 3D Printing in Oil and Gas Market, by Reducing Weight and Enhancing Performance, 2017-2022 (US$ Mn)
TABLE 720 Saudi Arabia 3D Printing in Oil and Gas Market, by Reducing Weight and Enhancing Performance, 2023-2030 (US$ Mn)
TABLE 721 Saudi Arabia 3D Printing in Oil and Gas Market, by Drilling and Exploration Applications, 2017-2022 (US$ Mn)
TABLE 722 Saudi Arabia 3D Printing in Oil and Gas Market, by Drilling and Exploration Applications, 2023-2030 (US$ Mn)
TABLE 723 Saudi Arabia 3D Printing in Oil and Gas Market, by Sustainability and Environmental Impact, 2017-2022 (US$ Mn)
TABLE 724 Saudi Arabia 3D Printing in Oil and Gas Market, by Sustainability and Environmental Impact, 2023-2030 (US$ Mn)
TABLE 725 Saudi Arabia 3D Printing in Oil and Gas Market, by Certification and Standardization, 2017-2022 (US$ Mn)
TABLE 726 Saudi Arabia 3D Printing in Oil and Gas Market, by Certification and Standardization, 2023-2030 (US$ Mn)
TABLE 727 Saudi Arabia 3D Printing in Oil and Gas Market, by Collaborative Initiatives, 2017-2022 (US$ Mn)
TABLE 728 Saudi Arabia 3D Printing in Oil and Gas Market, by Collaborative Initiatives, 2023-2030 (US$ Mn)
TABLE 729 Saudi Arabia 3D Printing in Oil and Gas Market, by Remote and Harsh Environments, 2017-2022 (US$ Mn)
TABLE 730 Saudi Arabia 3D Printing in Oil and Gas Market, by Remote and Harsh Environments, 2023-2030 (US$ Mn)
TABLE 731 Rest of Middle East 3D Printing in Oil and Gas Market, by Manufacturing of Components, 2017-2022 (US$ Mn)
TABLE 732 Rest of Middle East 3D Printing in Oil and Gas Market, by Manufacturing of Components, 2023-2030 (US$ Mn)
TABLE 733 Rest of Middle East 3D Printing in Oil and Gas Market, by Supply Chain Optimization, 2017-2022 (US$ Mn)
TABLE 734 Rest of Middle East 3D Printing in Oil and Gas Market, by Supply Chain Optimization, 2023-2030 (US$ Mn)
TABLE 735 Rest of Middle East 3D Printing in Oil and Gas Market, by Materials Development, 2017-2022 (US$ Mn)
TABLE 736 Rest of Middle East 3D Printing in Oil and Gas Market, by Materials Development, 2023-2030 (US$ Mn)
TABLE 737 Rest of Middle East 3D Printing in Oil and Gas Market, by Retrofitting and Maintenance, 2017-2022 (US$ Mn)
TABLE 738 Rest of Middle East 3D Printing in Oil and Gas Market, by Retrofitting and Maintenance, 2023-2030 (US$ Mn)
TABLE 739 Rest of Middle East 3D Printing in Oil and Gas Market, by Tooling and Equipment Production, 2017-2022 (US$ Mn)
TABLE 740 Rest of Middle East 3D Printing in Oil and Gas Market, by Tooling and Equipment Production, 2023-2030 (US$ Mn)
TABLE 741 Rest of Middle East 3D Printing in Oil and Gas Market, by Prototyping and Design Optimization, 2017-2022 (US$ Mn)
TABLE 742 Rest of Middle East 3D Printing in Oil and Gas Market, by Prototyping and Design Optimization, 2023-2030 (US$ Mn)
TABLE 743 Rest of Middle East 3D Printing in Oil and Gas Market, by Reducing Weight and Enhancing Performance, 2017-2022 (US$ Mn)
TABLE 744 Rest of Middle East 3D Printing in Oil and Gas Market, by Reducing Weight and Enhancing Performance, 2023-2030 (US$ Mn)
TABLE 745 Rest of Middle East 3D Printing in Oil and Gas Market, by Drilling and Exploration Applications, 2017-2022 (US$ Mn)
TABLE 746 Rest of Middle East 3D Printing in Oil and Gas Market, by Drilling and Exploration Applications, 2023-2030 (US$ Mn)
TABLE 747 Rest of Middle East 3D Printing in Oil and Gas Market, by Sustainability and Environmental Impact, 2017-2022 (US$ Mn)
TABLE 748 Rest of Middle East 3D Printing in Oil and Gas Market, by Sustainability and Environmental Impact, 2023-2030 (US$ Mn)
TABLE 749 Rest of Middle East 3D Printing in Oil and Gas Market, by Certification and Standardization, 2017-2022 (US$ Mn)
TABLE 750 Rest of Middle East 3D Printing in Oil and Gas Market, by Certification and Standardization, 2023-2030 (US$ Mn)
TABLE 751 Rest of Middle East 3D Printing in Oil and Gas Market, by Collaborative Initiatives, 2017-2022 (US$ Mn)
TABLE 752 Rest of Middle East 3D Printing in Oil and Gas Market, by Collaborative Initiatives, 2023-2030 (US$ Mn)
TABLE 753 Rest of Middle East 3D Printing in Oil and Gas Market, by Remote and Harsh Environments, 2017-2022 (US$ Mn)
TABLE 754 Rest of Middle East 3D Printing in Oil and Gas Market, by Remote and Harsh Environments, 2023-2030 (US$ Mn)
TABLE 755 Africa 3D Printing in Oil and Gas Market, by Manufacturing of Components, 2017-2022 (US$ Mn)
TABLE 756 Africa 3D Printing in Oil and Gas Market, by Manufacturing of Components, 2023-2030 (US$ Mn)
TABLE 757 Africa 3D Printing in Oil and Gas Market, by Supply Chain Optimization, 2017-2022 (US$ Mn)
TABLE 758 Africa 3D Printing in Oil and Gas Market, by Supply Chain Optimization, 2023-2030 (US$ Mn)
TABLE 759 Africa 3D Printing in Oil and Gas Market, by Materials Development, 2017-2022 (US$ Mn)
TABLE 760 Africa 3D Printing in Oil and Gas Market, by Materials Development, 2023-2030 (US$ Mn)
TABLE 761 Africa 3D Printing in Oil and Gas Market, by Retrofitting and Maintenance, 2017-2022 (US$ Mn)
TABLE 762 Africa 3D Printing in Oil and Gas Market, by Retrofitting and Maintenance, 2023-2030 (US$ Mn)
TABLE 763 Africa 3D Printing in Oil and Gas Market, by Tooling and Equipment Production, 2017-2022 (US$ Mn)
TABLE 764 Africa 3D Printing in Oil and Gas Market, by Tooling and Equipment Production, 2023-2030 (US$ Mn)
TABLE 765 Africa 3D Printing in Oil and Gas Market, by Prototyping and Design Optimization, 2017-2022 (US$ Mn)
TABLE 766 Africa 3D Printing in Oil and Gas Market, by Prototyping and Design Optimization, 2023-2030 (US$ Mn)
TABLE 767 Africa 3D Printing in Oil and Gas Market, by Reducing Weight and Enhancing Performance, 2017-2022 (US$ Mn)
TABLE 768 Africa 3D Printing in Oil and Gas Market, by Reducing Weight and Enhancing Performance, 2023-2030 (US$ Mn)
TABLE 769 Africa 3D Printing in Oil and Gas Market, by Drilling and Exploration Applications, 2017-2022 (US$ Mn)
TABLE 770 Africa 3D Printing in Oil and Gas Market, by Drilling and Exploration Applications, 2023-2030 (US$ Mn)
TABLE 771 Africa 3D Printing in Oil and Gas Market, by Sustainability and Environmental Impact, 2017-2022 (US$ Mn)
TABLE 772 Africa 3D Printing in Oil and Gas Market, by Sustainability and Environmental Impact, 2023-2030 (US$ Mn)
TABLE 773 Africa 3D Printing in Oil and Gas Market, by Certification and Standardization, 2017-2022 (US$ Mn)
TABLE 774 Africa 3D Printing in Oil and Gas Market, by Certification and Standardization, 2023-2030 (US$ Mn)
TABLE 775 Africa 3D Printing in Oil and Gas Market, by Collaborative Initiatives, 2017-2022 (US$ Mn)
TABLE 776 Africa 3D Printing in Oil and Gas Market, by Collaborative Initiatives, 2023-2030 (US$ Mn)
TABLE 777 Africa 3D Printing in Oil and Gas Market, by Remote and Harsh Environments, 2017-2022 (US$ Mn)
TABLE 778 Africa 3D Printing in Oil and Gas Market, by Remote and Harsh Environments, 2023-2030 (US$ Mn)
TABLE 779 South Africa 3D Printing in Oil and Gas Market, by Manufacturing of Components, 2017-2022 (US$ Mn)
TABLE 780 South Africa 3D Printing in Oil and Gas Market, by Manufacturing of Components, 2023-2030 (US$ Mn)
TABLE 781 South Africa 3D Printing in Oil and Gas Market, by Supply Chain Optimization, 2017-2022 (US$ Mn)
TABLE 782 South Africa 3D Printing in Oil and Gas Market, by Supply Chain Optimization, 2023-2030 (US$ Mn)
TABLE 783 South Africa 3D Printing in Oil and Gas Market, by Materials Development, 2017-2022 (US$ Mn)
TABLE 784 South Africa 3D Printing in Oil and Gas Market, by Materials Development, 2023-2030 (US$ Mn)
TABLE 785 South Africa 3D Printing in Oil and Gas Market, by Retrofitting and Maintenance, 2017-2022 (US$ Mn)
TABLE 786 South Africa 3D Printing in Oil and Gas Market, by Retrofitting and Maintenance, 2023-2030 (US$ Mn)
TABLE 787 South Africa 3D Printing in Oil and Gas Market, by Tooling and Equipment Production, 2017-2022 (US$ Mn)
TABLE 788 South Africa 3D Printing in Oil and Gas Market, by Tooling and Equipment Production, 2023-2030 (US$ Mn)
TABLE 789 South Africa 3D Printing in Oil and Gas Market, by Prototyping and Design Optimization, 2017-2022 (US$ Mn)
TABLE 790 South Africa 3D Printing in Oil and Gas Market, by Prototyping and Design Optimization, 2023-2030 (US$ Mn)
TABLE 791 South Africa 3D Printing in Oil and Gas Market, by Reducing Weight and Enhancing Performance, 2017-2022 (US$ Mn)
TABLE 792 South Africa 3D Printing in Oil and Gas Market, by Reducing Weight and Enhancing Performance, 2023-2030 (US$ Mn)
TABLE 793 South Africa 3D Printing in Oil and Gas Market, by Drilling and Exploration Applications, 2017-2022 (US$ Mn)
TABLE 794 South Africa 3D Printing in Oil and Gas Market, by Drilling and Exploration Applications, 2023-2030 (US$ Mn)
TABLE 795 South Africa 3D Printing in Oil and Gas Market, by Sustainability and Environmental Impact, 2017-2022 (US$ Mn)
TABLE 796 South Africa 3D Printing in Oil and Gas Market, by Sustainability and Environmental Impact, 2023-2030 (US$ Mn)
TABLE 797 South Africa 3D Printing in Oil and Gas Market, by Certification and Standardization, 2017-2022 (US$ Mn)
TABLE 798 South Africa 3D Printing in Oil and Gas Market, by Certification and Standardization, 2023-2030 (US$ Mn)
TABLE 799 South Africa 3D Printing in Oil and Gas Market, by Collaborative Initiatives, 2017-2022 (US$ Mn)
TABLE 800 South Africa 3D Printing in Oil and Gas Market, by Collaborative Initiatives, 2023-2030 (US$ Mn)
TABLE 801 South Africa 3D Printing in Oil and Gas Market, by Remote and Harsh Environments, 2017-2022 (US$ Mn)
TABLE 802 South Africa 3D Printing in Oil and Gas Market, by Remote and Harsh Environments, 2023-2030 (US$ Mn)
TABLE 803 Egypt 3D Printing in Oil and Gas Market, by Manufacturing of Components, 2017-2022 (US$ Mn)
TABLE 804 Egypt 3D Printing in Oil and Gas Market, by Manufacturing of Components, 2023-2030 (US$ Mn)
TABLE 805 Egypt 3D Printing in Oil and Gas Market, by Supply Chain Optimization, 2017-2022 (US$ Mn)
TABLE 806 Egypt 3D Printing in Oil and Gas Market, by Supply Chain Optimization, 2023-2030 (US$ Mn)
TABLE 807 Egypt 3D Printing in Oil and Gas Market, by Materials Development, 2017-2022 (US$ Mn)
TABLE 808 Egypt 3D Printing in Oil and Gas Market, by Materials Development, 2023-2030 (US$ Mn)
TABLE 809 Egypt 3D Printing in Oil and Gas Market, by Retrofitting and Maintenance, 2017-2022 (US$ Mn)
TABLE 810 Egypt 3D Printing in Oil and Gas Market, by Retrofitting and Maintenance, 2023-2030 (US$ Mn)
TABLE 811 Egypt 3D Printing in Oil and Gas Market, by Tooling and Equipment Production, 2017-2022 (US$ Mn)
TABLE 812 Egypt 3D Printing in Oil and Gas Market, by Tooling and Equipment Production, 2023-2030 (US$ Mn)
TABLE 813 Egypt 3D Printing in Oil and Gas Market, by Prototyping and Design Optimization, 2017-2022 (US$ Mn)
TABLE 814 Egypt 3D Printing in Oil and Gas Market, by Prototyping and Design Optimization, 2023-2030 (US$ Mn)
TABLE 815 Egypt 3D Printing in Oil and Gas Market, by Reducing Weight and Enhancing Performance, 2017-2022 (US$ Mn)
TABLE 816 Egypt 3D Printing in Oil and Gas Market, by Reducing Weight and Enhancing Performance, 2023-2030 (US$ Mn)
TABLE 817 Egypt 3D Printing in Oil and Gas Market, by Drilling and Exploration Applications, 2017-2022 (US$ Mn)
TABLE 818 Egypt 3D Printing in Oil and Gas Market, by Drilling and Exploration Applications, 2023-2030 (US$ Mn)
TABLE 819 Egypt 3D Printing in Oil and Gas Market, by Sustainability and Environmental Impact, 2017-2022 (US$ Mn)
TABLE 820 Egypt 3D Printing in Oil and Gas Market, by Sustainability and Environmental Impact, 2023-2030 (US$ Mn)
TABLE 821 Egypt 3D Printing in Oil and Gas Market, by Certification and Standardization, 2017-2022 (US$ Mn)
TABLE 822 Egypt 3D Printing in Oil and Gas Market, by Certification and Standardization, 2023-2030 (US$ Mn)
TABLE 823 Egypt 3D Printing in Oil and Gas Market, by Collaborative Initiatives, 2017-2022 (US$ Mn)
TABLE 824 Egypt 3D Printing in Oil and Gas Market, by Collaborative Initiatives, 2023-2030 (US$ Mn)
TABLE 825 Egypt 3D Printing in Oil and Gas Market, by Remote and Harsh Environments, 2017-2022 (US$ Mn)
TABLE 826 Egypt 3D Printing in Oil and Gas Market, by Remote and Harsh Environments, 2023-2030 (US$ Mn)
TABLE 827 Rest of Africa 3D Printing in Oil and Gas Market, by Manufacturing of Components, 2017-2022 (US$ Mn)
TABLE 828 Rest of Africa 3D Printing in Oil and Gas Market, by Manufacturing of Components, 2023-2030 (US$ Mn)
TABLE 829 Rest of Africa 3D Printing in Oil and Gas Market, by Supply Chain Optimization, 2017-2022 (US$ Mn)
TABLE 830 Rest of Africa 3D Printing in Oil and Gas Market, by Supply Chain Optimization, 2023-2030 (US$ Mn)
TABLE 831 Rest of Africa 3D Printing in Oil and Gas Market, by Materials Development, 2017-2022 (US$ Mn)
TABLE 832 Rest of Africa 3D Printing in Oil and Gas Market, by Materials Development, 2023-2030 (US$ Mn)
TABLE 833 Rest of Africa 3D Printing in Oil and Gas Market, by Retrofitting and Maintenance, 2017-2022 (US$ Mn)
TABLE 834 Rest of Africa 3D Printing in Oil and Gas Market, by Retrofitting and Maintenance, 2023-2030 (US$ Mn)
TABLE 835 Rest of Africa 3D Printing in Oil and Gas Market, by Tooling and Equipment Production, 2017-2022 (US$ Mn)
TABLE 836 Rest of Africa 3D Printing in Oil and Gas Market, by Tooling and Equipment Production, 2023-2030 (US$ Mn)
TABLE 837 Rest of Africa 3D Printing in Oil and Gas Market, by Prototyping and Design Optimization, 2017-2022 (US$ Mn)
TABLE 838 Rest of Africa 3D Printing in Oil and Gas Market, by Prototyping and Design Optimization, 2023-2030 (US$ Mn)
TABLE 839 Rest of Africa 3D Printing in Oil and Gas Market, by Reducing Weight and Enhancing Performance, 2017-2022 (US$ Mn)
TABLE 840 Rest of Africa 3D Printing in Oil and Gas Market, by Reducing Weight and Enhancing Performance, 2023-2030 (US$ Mn)
TABLE 841 Rest of Africa 3D Printing in Oil and Gas Market, by Drilling and Exploration Applications, 2017-2022 (US$ Mn)
TABLE 842 Rest of Africa 3D Printing in Oil and Gas Market, by Drilling and Exploration Applications, 2023-2030 (US$ Mn)
TABLE 843 Rest of Africa 3D Printing in Oil and Gas Market, by Sustainability and Environmental Impact, 2017-2022 (US$ Mn)
TABLE 844 Rest of Africa 3D Printing in Oil and Gas Market, by Sustainability and Environmental Impact, 2023-2030 (US$ Mn)
TABLE 845 Rest of Africa 3D Printing in Oil and Gas Market, by Certification and Standardization, 2017-2022 (US$ Mn)
TABLE 846 Rest of Africa 3D Printing in Oil and Gas Market, by Certification and Standardization, 2023-2030 (US$ Mn)
TABLE 847 Rest of Africa 3D Printing in Oil and Gas Market, by Collaborative Initiatives, 2017-2022 (US$ Mn)
TABLE 848 Rest of Africa 3D Printing in Oil and Gas Market, by Collaborative Initiatives, 2023-2030 (US$ Mn)
TABLE 849 Rest of Africa 3D Printing in Oil and Gas Market, by Remote and Harsh Environments, 2017-2022 (US$ Mn)
TABLE 850 Rest of Africa 3D Printing in Oil and Gas Market, by Remote and Harsh Environments, 2023-2030 (US$ Mn)

How big is the global market for 3D printing in oil and gas right now?

In 2022, the market for 3D printing in oil and gas was estimated to be worth USD 215.8 million.

What is the anticipated growth rate of 3D printing in the oil and gas market from 2023 to 2030?

The market for 3D printing in oil and gas is anticipated to increase at a CAGR of 23.80% from 2023 to 2030, reaching USD 1190.73 million in 2030.

In terms of manufacturing components, which market category is in the lead?

Customized parts are the most popular category of manufacturing components.

Which segment is leading the market in terms of supply chain optimization?

On-demand manufacturing, by supply chain optimization, is the notable segment.

Which reducing weight and enhancing performance segment is estimated to have the highest CAGR throughout the forecast period?

The topology optimization category is anticipated to exhibit the highest CAGR during the projection period.

Gas Engines Market

Published:
Report ID: 6044

Air Compressor Market

Published:
Report ID: 2818

Solar Photovoltaic (PV) Market

Published:
Report ID: 6195

Gas Turbine Electrical Power Generation Market

Published:
Report ID: 6216

Home Energy Management Systems (HEMS) Market

Published:
Report ID: 7082

Power Generator for the Military Market

Published:
Report ID: 20407

Lithium-Ion Battery Binders Market

Published:
Report ID: 19637

Wind Turbine Operations And Maintenance Market

Published:
Report ID: 19534

Digital Substations Market

Published:
Report ID: 18400

Medium and High Power Electric Motors Market

Published:
Report ID: 6631

Global Horizontal Directional Drilling (HDD) Market

Published:
Report ID: 12513

Industrial Biomass Boiler Market

Published:
Report ID: 6791

Purchase Options

$2999
Delivery Format: Excel.
$4999
Designed for the individual purchaser.
$6999
Users located at a single corporate site or regional office.
$7999
Allowed for unlimited sharing globally within one company.
Smallform of Sample request

Have a question?

User Profile

Don’t settle for less – trust Mitul to help you find the best solution.

Report delivery within 24 to 48 hours

– Other Info –

What people say?-

User Review

I am very impressed with the information in this report. The author clearly did their research when they came up with this product and it has already given me a lot of ideas.

Jana Schmidt
CEDAR CX Technologies

– Connect with us –

Phone

+91 6232 49 3207


support

24/7 Research Support


sales@credenceresearch.com

– Research Methodology –

Going beyond the basics: advanced techniques in research methodology

– Trusted By –

Pepshi, LG, Nestle
Motorola, Honeywell, Johnson and johnson
LG Chem, SIEMENS, Pfizer
Unilever, Samsonite, QIAGEN