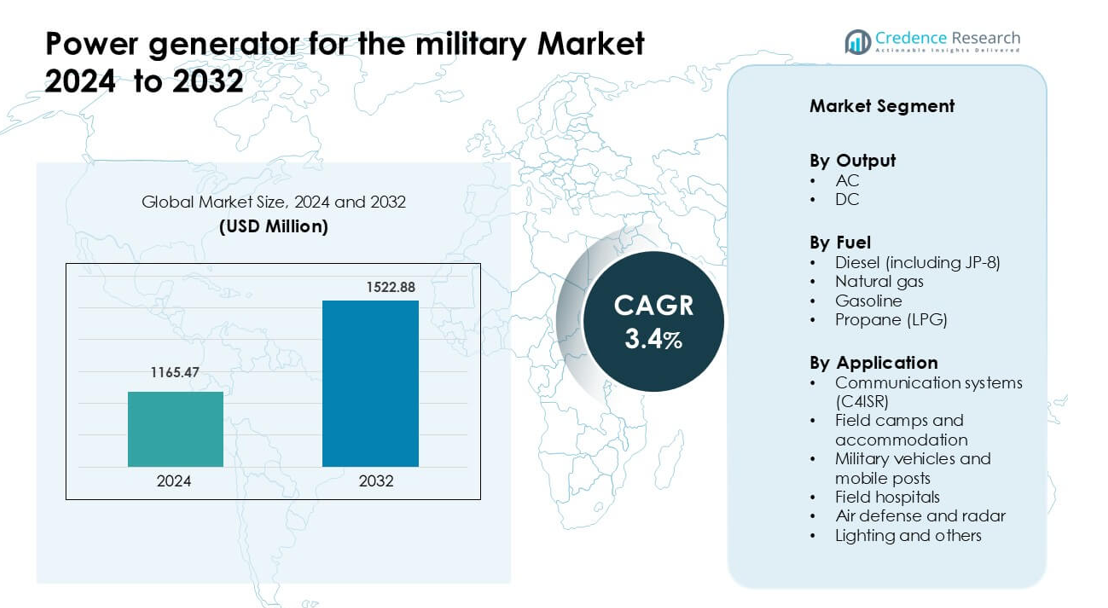
Home » Energy » Energy Utilities » Power Generator for the Military Market

Power Generator for the Military Market By Capacity (Up to 60 KW, 61 to 250 KW, 251 to 500 KW, 501 to 1000 KW, Above 1000 KW) By Output Type (AC, DC) By Fuel Type (Diesel, Natural Gas)-Growth, Future Prospects & Competitive Analysis, 2016 – 2030

Price: $4999

Published: | Report ID: 20407 | Report Format : PDF

Actionable Insights Delivered – Power Generator For The Military Market Size

Positioned with a USD 1.1 billion valuation in 2022, the Power Generator For The Military Market asserted its global eminence. Set to scale to USD 1.4 billion by 2030, the market’s remarkable Compound Annual Growth Rate (CAGR) of 3.80% (2022-2030) underscores its strategic growth trajectory.

Key Highlights of the Report

The global power generator for the military market is segmented by capacity, output type, fuel type, installation type, application, and region. Up to 60 KW generators for the military are the most popular. AC is the most commonly used output type; diesel is expected to hold a value share of nearly 85% of the global market in the segment fuel type by 2023. Regarding installation type, the portable segment is expected to hold a value share of nearly 38% of the global market by 2023. In terms of application, field hospitals are accounted for a market share of nearly 87%. However, field camps/accommodations are predicted to expand their operations and exhibit a CAGR of 5.4% in the coming decade, with North America leading the market growth.

Design Element 2

Access crucial information at unmatched prices!

Request your free sample report today & start making informed decisions powered by Credence Research!

Download Free Sample
CTA Design Element 3

The global power generator for the military market has several drivers, including the growing demand for consistent and dependable power sources for successful military operations. Military power generator sales are anticipated to increase due to rising military and defense spending and soaring demand for cutting-edge power production solutions to deliver a continuous and constant power supply. Armed forces rely on lightweight, portable generators for use in the field because transferring a heavy generator to places like hills and water boundaries is challenging. As a result, manufacturers of military power generators can expect to benefit from the increased need for mobile and portable generators in military applications. Military generator improvements and the creation of small tactical power generators are anticipated to increase. However, the global power generator for the military market also faces several challenges, including strict emission restrictions for diesel engines and alternate backup power sources.

Nonetheless, the global power generator for the military market offers significant growth opportunities, including the rising use of hybrid generators and the development and use of DRASH tent systems.

What Are the Main Drivers of The Global Power Generator for the Military Market?

The global power generator for the military market is driven by several factors, including technological improvement of generators, the creation of compact tactical power generators, and a surge in military spending.

What Are the Major Challenges The Global Power Generator Faces for Military Market?

The global power generator for the military market also faces several challenges, including strict emission restrictions for diesel engines and alternate backup power sources.

What Are the Growth Opportunities in The Global Power Generator for the Military Market?

The global power generator for the military market offers significant growth opportunities, including the rising use of hybrid generators and the development and use of DRASH tent systems.

Executive Summary

Overview of the Global Power Generator for the Military Market

The global novel drug delivery systems market has been steadily growing in recent years, driven by the technological improvement of generators, including the creation of compact tactical power generators and a surge in military spending. The market is characterized by a wide range of capacity, output types, fuel types, installation types, and applications, catering to diverse consumer preferences.

Power Generator for the Military Market

Market Definition

A device known as an electric generator transforms mechanical energy into electrical energy for transmission across power lines to military users. The mechanical power for an electric generator is typically generated by a spinning shaft and is calculated by multiplying the shaft torque by the rotational or angular velocity. There are numerous techniques to produce mechanical power, such as petrol and diesel engines, steam turbines, which utilize the heat produced by burning fossil fuels or nuclear fission to produce steam, and gas turbines, which burn gas inside the turbine. The design and speed of the generator might rely largely on the qualities of the mechanical primary mover. Generators furthermore supply the electrical power required by military vehicles, outpost camps, outpost hospitals, and training facilities.

Market Insights

  • The global demand for power generators for the military was valued at USD 1.1 Billion in 2022 and is expected to reach USD 1.4 Billion in 2030, growing at a CAGR of 3.80% between 2023 and 2030.
  • The up-to-60 KW segment accounted for the highest share in 2022, holding more than one-third of the global military generator market. It is expected to continue its leadership status during the forecast period. However, the same segment is estimated to grow at the highest CAGR of 5.2% during the forecast period.
  • The AC segment governs the demand for power generators for the military globally, holding a massive share of over 80% in 2020, and DC is expected to grow at a rapid CAGR.
  • The diesel segment is expected to post the highest share during the forecast period, with over 85% share in 2022.
  • The portable segment is expected to post the highest during the forecast period, with over 38% share in 2022.
  • The field hospitals segment is expected to post the highest share during the forecast period, with field camps/accommodation to hold the highest CAGR.
  • North America is fueling the growth of the power generator for the military industry with over one-third share in 2022, while Asia Pacific and Europe collectively account for just under 50% share in 2022. Europe held over 22% share in 2022.
  • One of the key elements influencing the increase in regional income is the deployment of US troops in various parts of the world due to the US’s involvement in numerous international conflicts. At the same time, the strict emission restrictions for diesel engines and alternate backup power sources are the main restraints on the market.
  • The major opportunities are the rising use of hybrid generators and the development and use of DRASH tent systems.

Segmentation by Capacity

  • The Up to 60 KW segment governs the demand for power generators for the military in the world, holding a massive share of over 80% in 2022, and is also expected to grow at a rapid CAGR.

Segmentation by Output Type

  • The AC segment governs the demand for power generators for the military in the world, holding a massive share of over 80% in 2022,
  • DC is expected to grow at a rapid CAGR.

Segmentation by Fuel Type

  • Diesel is the leading segment by fuel type and held over 39% share in terms of value in 2022.

Segmentation by Installation Type

  • Portable is the leading segment by installation type and held over 39% share in terms of value in 2022.
  • The stationery segment will likely exhibit the fastest CAGR during the forecast period.

Segmentation by Application

  • The field camps/accommodation retailing segment is expected to post the highest CAGR during the forecast period.
  • The field hospitals retailers segment is leading the market share with over 30% share in 2022.

Segmentation by Region

  • North America is fueling the growth of the power generator for the military industry with over one-third share in 2022.
  • Asia Pacific and Europe collectively account for just under 50% share in 2022, with Europe holding over 22% share in the same year.
  • The rest of the World, including Latin America, The Middle East, and Africa, contributes the remainder to the demand for power generators for the military.

The increasing demand for power generators for the military can be attributed to the technological improvement of generators, including the creation of compact tactical power generators and a surge in military spending. However, the market is restrained by strict emission restrictions for diesel engines and alternate backup power sources.

The United States is one of North America’s largest markets for military power generators, with a significant market share. The main factor driving the region’s expanding revenue share is the United States’ expanding demand for military power solutions. One of the major factors impacting the growth in regional income is the deployment of US troops in various parts of the world due to the US’s involvement in numerous international conflicts. Small and transportable power solutions are needed to power the varied movable military equipment of these military camps and command units on a permanent or emergency basis. The nation is improving power/battery solutions onboard several defense platforms.

China is also a major market for power generators for the military in the Asia Pacific region, with a significant market share. The increase in defense spending in the Asia-Pacific area to combat the region’s rising terrorism and regional conflicts has encouraged a surge in the use of military generators there. Additionally, a rise in defense spending across the Asia-Pacific region supports purchasing cutting-edge military generator systems. Additionally, the military generator market is predicted to be primarily driven by increased defense spending during the anticipated time frame.

Overall, the increasing demand for power generators for the military can be attributed to the technological improvement of generators, including the creation of compact tactical power generators and a surge in military spending.

While the power generator for the military market is growing, it faces challenges from the strict emission restrictions for diesel engines and alternate backup power sources. Manufacturers are innovating and forming partnerships to stay competitive.

Improvements in military generator technology

The most noticeable advancement in diesel generator technology in recent years has continued to be increased fuel efficiency. As has always been, the general public has more readily embraced diesel-powered engines. Due to the continuing debate about fuel economy, ordinary petrol users frequently neglect diesel. Many industries use diesel generators, but they are most popular among those needing fuel efficiency for heavy-duty transportation, emergency electricity, and large-scale agricultural operations. In addition, there have been several innovations and attempts to raise the overall effectiveness of diesel generators. The combination of oxygen and fuel in the generator causes the ignition, which produces power. Eventually, the mixture produces enough energy to fire up the engine. For instance, Cummins Inc. developed the HSK78G series of natural gas generators, which delivers cutting-edge gas technology and a range of cutting-edge capabilities. The new HSK78 series provides a complete set of gas generator capabilities and cutting-edge gas technology for prime and peaking power applications. No matter how harsh the fuel source or operating conditions, the HSK78G generator series was built to deliver dependable power.

creation of portable power sources for the military

Military power and energy requirements are increasing exponentially, yet the current generators are huge, heavy, and not as fuel-efficient as they may be. The easily accessible military fuels JP8, jet fuel, or diesel are used to power the small tactical power generators. The tiny, compact, and efficient power is necessary to increase the mobility of army systems. From camp support to communications systems to computerized weaponry, the Army may deploy the compact tactical power generator platform for various warfighter needs. For instance, LiquidPiston, Inc. (LPI), a manufacturer of cutting-edge rotary diesel and multi-fuel internal combustion engines, announced in December 2020 that the U.S. Army had awarded it a Small Business Innovation Research (SBIR) contract for the development of the X-Engine platform, which will power Small Tactical Generators with a power range of 2–5 kW.

The market expansion is anticipated to be driven by the development of compact tactical power generators to produce ground-breaking energy technologies that significantly reduce the logistical burden on the warfighter. This effort focuses on compact, portable generators for backup telecommunications, remote power, homeland security, first responders, and marine power. They are also utilized on the front lines of battle. Small tactical generators improve the warfighter’s system effectiveness, mobility, dependability, and maintainability.

Strict emission standards for diesel engines

Diesel generator air pollution has been rising alarmingly, a serious market restraint. This has led to serious health and environmental issues, impeding market expansion. Nitrogen oxides, carbon monoxide, hydrocarbons, and particulate matter are among the air pollutants that diesel generators generate. These air pollutants hurt human health, contributing to asthma, lung cancer, heart disease, and stroke. In addition to the Ministry of Environment and Forests, the Central Pollution Control Board have set limitations on diesel generator emissions to combat environmental pollution. Generator Set Regulations (GSR) 771E, GSR 535E, 232E, and 489E (India); EPA emission standard for emergency standby diesel generator sets; Paris Agreement COP 21 for greenhouse gas reduction -Targets 2021-2030; and Kyoto Protocol 1998 COP 3. We predict that these regulations will impede the market’s expansion by making it more difficult to use diesel engine generators.

The use of hybrid generators is expanding

Modern hybrid generators combine conventional generator sets with an additional controllable electric source to produce a fuel-efficient, quieter, and more environmentally friendly power source. A fuel cell or any device that produces energy from a non-electrical power source, such as a hydropower generator, wind turbine generator, or solar-powered power source, may be the controlled source. During operation, the fuel generators and renewable energy sources like sun, wind, and hydro charge the batteries in hybrid gensets. The charge stored in the batteries serves as the power source, negating fuel generators’ need to run continually.

A hybrid generator combines conventional fuel generators (diesel, petrol, and LPG) with renewable energy sources like wind turbines, gas turbine generators, and solar electricity. When a power loss occurs, a hybrid genset recognizes and supplies power to the connected system, ensuring an uninterrupted power supply. Due to such features, military forces search for new hybrid technology that can more effectively power command posts and division tactical operation centers.

Competitive Landscape

Key Players

The global power generator for the military market is highly competitive, with the presence of several key players. Some of the major players in the market and their market share are as follows:

  • Caterpillar Inc.
  • Cummins Inc.
  • Rolls-Royce Holdings plc
  • Harrington Generators International
  • HIMOINSA
  • Teknel SRL
  • VÝVOJ Martin
  • GRUPEL S.A.
  • HITZINGER GmbH
  • Ascot Industrial S.r.l.
  • Fischer Panda GmbH
  • GREEN POWER SYSTEMS S.r.l.
  • Kirloskar Oil Engines Ltd.
  • Kohler Co.
  • Ausonia S.r.l.

These companies focus on product innovation, expanding their applications, and mergers and acquisitions to stay ahead in the market.

The major players in the global power generator for the military market are constantly striving to stay ahead by introducing new products and innovations.

HIMOINSA: The business presented its whole line of diesel generator sets at Bauma 2022 in October 2022.

The enlargement of Kohler Co.’s current North American generator manufacturing facility in Mosel, Wisconsin, was finished in November 2022. This project started in March 2021 and consists of a 155,000-square-foot testing, production, and warehouse area and a 10,000-square-foot customer experience center. The company is still watching the market for its KD Series large diesel industrial generators and integrated power systems.

Rolls-Royce Holding plc: The business created a highly effective hybrid-electric propulsion technology for use in aerospace in July 2021.

Shape Your Report to Specific Countries or Regions & Enjoy 30% Off!

Summary of Key Findings

  • Technological improvement of generators, including the creation of compact tactical power generators, and a surge in military spending is driving market growth.
  • Market segmented by capacity, output, fuel, installation, application, and region.
  • Up to 60 KW generators for the military are the most popular segment.
  • AC is most commonly used for the output type.
  • Diesel will hold a value share of nearly 85 percent of the global market by 2023.
  • Regarding installation type, the portable segment is expected to hold a value share of nearly 38 percent of the global market by 2023.
  • In terms of application, field hospital retailing is expected to account for a market share of nearly 87%.
  • North America is leading market growth; the market is highly competitive with key players including Caterpillar Inc., Rolls-Royce Holdings plc, Harrington Generators International, Cummins Inc., HIMOINSA, VÝVOJ Martin, Kohler Co., GRUPEL S.A., Ascot Industrial S.r.l., Fischer Panda GmbH, Teknel SRL, GREEN POWER SYSTEMS S.r.l., HITZINGER GmbH, Kirloskar Oil Engines Ltd., and Ausonia S.r.l. among other domestic and global players.

Future Outlook

  • Positive outlook for the global power generator for the military market with significant growth potential in the North American region
  • The rising use of hybrid generators and the development and use of DRASH tent systems drive growth.
  • Challenges from strict emission restrictions for diesel engines and alternate backup power sources.
  • Key players to focus on product innovation, expanding market reach and maintaining competitive pricing to stay ahead in the market.

Segmentation

  • By Capacity
    • Up to 60 KW
    • 61 to 250 KW
    • 251 to 500 KW
    • 501 to 1000 KW
    • Above 1000 KW
  • By Output Type
    • AC
    • DC
  • By Fuel Type
    • Diesel
    • Natural Gas
  • By Installation Type
    • Stationery
    • Mobile
    • Portable
  • By Application
    • Communication System
    • Air Defence System
    • Field Hospitals
    • Field Camps/Accommodation
    • Lighting
    • Military Vehicles
    • Others
  • By Region
  • North America
    • The US.
    • Canada
    • Mexico
  • Europe
    • Germany
    • France
    • The U.K.
    • Italy
    • Spain
    • Rest of Europe
  • Asia Pacific
    • China
    • Japan
    • India
    • South Korea
    • South-east Asia
    • Rest of Asia Pacific
  • Latin America
    • Brazil
    • Argentina
    • Rest of Latin America
  • Middle East & Africa
    • GCC Countries
    • South Africa
    • Rest of the Middle East and Africa

1. Preface
1.1. Report Description
1.1.1. Purpose of the Report
1.1.2. Target Audience
1.1.3. USP and Key Offerings
1.2. Research Scope
1.3. Research Methodology
1.3.1. Phase I – Secondary Research
1.3.2. Phase II – Data Modelling
1.3.2.1. Company Share Analysis Model
1.3.2.2. Revenue Based Modelling
1.3.3. Phase III – Primary Research
1.3.4. Research Limitations
1.3.5. Assumptions
1.4. Market Introduction
1.5. Market Research Scope

2. Executive Summary
2.1. Market Snapshot: Global Power Generator For Military Market
2.2. Global Power Generator For Military Market, By Capacity
2.3. Global Power Generator For Military Market, By Output Type
2.4. Global Power Generator For Military Market, By Fuel Type
2.5. Global Power Generator For Military Market, By Installation Type
2.6. Global Power Generator For Military Market, By Application
2.7. Global Power Generator For Military Market, By Region

3. Market Dynamics & Factors Analysis
3.1. Introduction
3.1.1. Global Power Generator For Military Market Value, 2017-2030, (US$ Bn)
3.1.2. Y-o-Y Growth Trend Analysis
3.2. Market Dynamics
3.2.1. Market Drivers
3.2.2. Market Restraints
3.2.3. Market Opportunities
3.2.4. Major Industry Challenges
3.3. Growth and Development Patterns
3.4. Investment Feasibility Analysis
3.5. Market Opportunity Analysis
3.5.1. Capacity
3.5.2. Output Type
3.5.3. Fuel Type
3.5.4. Installation Type
3.5.5. Application
3.5.6. Geography

4. Premium Insights
4.1. STAR (Situation, Task, Action, Results) Analysis
4.2. Porter’s Five Forces Analysis
4.2.1. Threat of New Entrants
4.2.2. Bargaining Power of Buyers/Consumers
4.2.3. Bargaining Power of Suppliers
4.2.4. Threat of Substitute Types
4.2.5. Intensity of Competitive Rivalry
4.3. Key Market Trends
4.3.1. Demand Side Trends
4.3.2. Supply Side Trends
4.4. Value Chain Analysis
4.5. Capacity Analysis
4.6. Analysis and Recommendations
4.7. Marketing Strategy Analysis
4.7.1. Direct Marketing
4.7.2. Indirect Marketing
4.7.3. Marketing Channel Development Trend

5. Market Positioning of Key Players, 2022
5.1. Company market share of key players, 2022
5.2. Competitive Benchmarking
5.3. Market Positioning of Key Vendors
5.4. Geographical Presence Analysis
5.5. Major Strategies Adopted by Key Players
5.5.1. Key Strategies Analysis
5.5.2. Mergers and Acquisitions
5.5.3. Partnerships
5.5.4. Product Launch
5.5.5. Geographical Expansion
5.5.6. Others

6. Economic Impact Analysis
6.1. Recession Impact
6.1.1. North America
6.1.2. Europe
6.1.3. Asia Pacific
6.1.4. Latin America
6.1.5. Middle East and Africa
6.2. Ukraine-Russia War Impact
6.2.1. North America
6.2.2. Europe
6.2.3. Asia Pacific
6.2.4. Latin America
6.2.5. Middle East and Africa
6.3. COVID-19 Impact Analysis
6.3.1. North America
6.3.2. Europe
6.3.3. Asia Pacific
6.3.4. Latin America
6.3.5. Middle East and Africa

7. Global Power Generator For Military Market, By Capacity
7.1. Global Power Generator For Military Market Overview, by Capacity
7.1.1. Global Power Generator For Military Market Revenue Share, By Capacity, 2022 Vs 2030 (in %)
7.2. Up to 60 KW
7.2.1. Global Power Generator For Military Market, By Region, 2017-2030 (US$ Bn)
7.3. 61 to 250 KW
7.3.1. Global Power Generator For Military Market, By Region, 2017-2030 (US$ Bn)
7.4. 251 to 500 KW
7.4.1. Global Power Generator For Military Market, By Region, 2017-2030 (US$ Bn)
7.5. 501 to 1000 KW
7.5.1. Global Power Generator For Military Market, By Region, 2017-2030 (US$ Bn)
7.6. o Above 1000 KW
7.6.1. Global Power Generator For Military Market, By Region, 2017-2030 (US$ Bn)

8. Global Power Generator For Military Market, By Output Type
8.1. Global Power Generator For Military Market Overview, by Output Type
8.1.1. Global Power Generator For Military Market, By Output Type, 2022 vs 2030 (in %)
8.2. AC
8.2.1. Global Power Generator For Military Market, By Region, 2017-2030 (US$ Bn)
8.3. DC
8.3.1. Global Power Generator For Military Market, By Region, 2017-2030 (US$ Bn)

9. Global Power Generator For Military Market, by Fuel Type, 2017-2030 (US$ Bn)
9.1. Global Power Generator For Military Market Overview, by Fuel Type
9.1.1. Global Power Generator For Military Market, By Fuel Type, 2022 vs 2030 (in%)
9.2. Diesel
9.2.1. Global Power Generator For Military Market, By Region, 2017-2030 (US$ Bn)
9.3. Natural Gas
9.3.1. Global Power Generator For Military Market, By Region, 2017-2030 (US$ Bn)

10. Global Power Generator For Military Market, by Installation Type, 2017-2030 (US$ Bn)
10.1. Global Power Generator For Military Market Overview, by Installation Type
10.1.1. Global Power Generator For Military Market, By Installation Type, 2022 vs 2030 (in%)
10.2. Stationery
10.2.1. Global Power Generator For Military Market, By Region, 2017-2030 (US$ Bn)
10.3. Mobile
10.3.1. Global Power Generator For Military Market, By Region, 2017-2030 (US$ Bn)
10.4. Portable
10.4.1. Global Power Generator For Military Market, By Region, 2017-2030 (US$ Bn)

11. Global Power Generator For Military Market, by Application, 2017-2030 (US$ Bn)
11.1. Global Power Generator For Military Market Overview, by Application
11.1.1. Global Power Generator For Military Market, By Application, 2022 vs 2030 (in%)
11.2. Communication System
11.2.1. Global Power Generator For Military Market, By Region, 2017-2030 (US$ Bn)
11.3. Air Defence System
11.3.1. Global Power Generator For Military Market, By Region, 2017-2030 (US$ Bn)
11.4. Field Hospitals
11.4.1. Global Power Generator For Military Market, By Region, 2017-2030 (US$ Bn)
11.5. Field Camps/Accommodation
11.5.1. Global Power Generator For Military Market, By Region, 2017-2030 (US$ Bn)
11.6. Lighting
11.6.1. Global Power Generator For Military Market, By Region, 2017-2030 (US$ Bn)
11.7. Military Vehicles
11.7.1. Global Power Generator For Military Market, By Region, 2017-2030 (US$ Bn)
11.8. Others
11.8.1. Global Power Generator For Military Market, By Region, 2017-2030 (US$ Bn)

12. Global Power Generator For Military Market, By Region
12.1. Global Power Generator For Military Market Overview, by Region
12.1.1. Global Power Generator For Military Market, By Region, 2022 vs 2030 (in%)
12.2. Capacity
12.2.1. Global Power Generator For Military Market, By Capacity, 2017-2030 (US$ Bn)
12.3. Output Type
12.3.1. Global Power Generator For Military Market, By Output Type, 2017-2030 (US$ Bn)
12.4. Fuel Type
12.4.1. Global Power Generator For Military Market, By Fuel Type, 2017-2030 (US$ Bn)
12.5. Installation Type
12.5.1. Global Power Generator For Military Market, By Installation Type, 2017-2030 (US$ Bn)
12.6. Application
12.6.1. Global Power Generator For Military Market, By Application, 2017-2030 (US$ Bn)

13. North America Power Generator For Military Market Analysis
13.1. North America Power Generator For Military Market, by Capacity, 2017-2030(US$ Bn)
13.1.1. Overview
13.1.2. SRC Analysis
13.2. North America Power Generator For Military Market, by Output Type, 2017-2030(US$ Bn)
13.2.1. Overview
13.2.2. SRC Analysis
13.3. North America Power Generator For Military Market, by Fuel Type, 2017-2030(US$ Bn)
13.3.1. Overview
13.3.2. SRC Analysis
13.4. North America Power Generator For Military Market, by Installation Type, 2017-2030(US$ Bn)
13.4.1. Overview
13.4.2. SRC Analysis
13.5. North America Power Generator For Military Market, by Fuel Type, 2017-2030(US$ Bn)
13.5.1. Overview
13.5.2. SRC Analysis
13.6. North America Power Generator For Military Market, by Country, 2017-2030 (US$ Bn)
13.6.1. North America Power Generator For Military Market, by Country, 2022 Vs 2030 (in%)
13.6.2. U.S.
13.6.2.1. U.S. Power Generator For Military Market Estimates and Forecast, 2017-2030 (US$ Bn)
13.6.2.2. U.S. Power Generator For Military, By Capacity, 2017-2030 (US$ Bn)
13.6.2.3. U.S. Power Generator For Military, By Output Type, 2017-2030 (US$ Bn)
13.6.2.4. U.S. Power Generator For Military, By Fuel Type, 2017-2030 (US$ Bn)
13.6.2.5. U.S. Power Generator For Military, By Installation Type, 2017-2030 (US$ Bn)
13.6.2.6. U.S. Power Generator For Military, By Application, 2017-2030 (US$ Bn)
13.6.3. Canada
13.6.3.1. Canada Power Generator For Military Market Estimates and Forecast, 2017-2030 (US$ Bn)
13.6.3.2. Canada Power Generator For Military, By Capacity, 2017-2030 (US$ Bn)
13.6.3.3. Canada Power Generator For Military, By Output Type, 2017-2030 (US$ Bn)
13.6.3.4. Canada Power Generator For Military, By Fuel Type, 2017-2030 (US$ Bn)
13.6.3.5. Canada Power Generator For Military, By Installation Type, 2017-2030 (US$ Bn)
13.6.3.6. Canada Power Generator For Military, By Application, 2017-2030 (US$ Bn)
13.6.4. Mexico
13.6.4.1. Mexico Power Generator For Military Market Estimates and Forecast, 2017-2030 (US$ Bn)
13.6.4.2. Mexico Power Generator For Military, By Capacity, 2017-2030 (US$ Bn)
13.6.4.3. Mexico Power Generator For Military, By Output Type, 2017-2030 (US$ Bn)
13.6.4.4. Mexico Power Generator For Military, By Fuel Type, 2017-2030 (US$ Bn)
13.6.4.5. Mexico Power Generator For Military, By Installation Type, 2017-2030 (US$ Bn)
13.6.4.6. Mexico Power Generator For Military, By Application, 2017-2030 (US$ Bn)

14. Europe Power Generator For Military Market Analysis
14.1. Europe Power Generator For Military Market, by Capacity, 2017-2030(US$ Bn)
14.1.1. Overview
14.1.2. SRC Analysis
14.2. Europe Power Generator For Military Market, by Output Type, 2017-2030(US$ Bn)
14.2.1. Overview
14.2.2. SRC Analysis
14.3. Europe Power Generator For Military Market, by Fuel Type, 2017-2030(US$ Bn)
14.3.1. Overview
14.3.2. SRC Analysis
14.4. Europe Power Generator For Military Market, by Installation Type, 2017-2030(US$ Bn)
14.4.1. Overview
14.4.2. SRC Analysis
14.5. Europe Power Generator For Military Market, by Application, 2017-2030(US$ Bn)
14.5.1. Overview
14.5.2. SRC Analysis
14.6. Europe Power Generator For Military Market, by Country, 2017-2030 (US$ Bn)
14.6.1. Europe Power Generator For Military Market, by Country, 2022 Vs 2030 (in%)
14.6.2. Germany
14.6.2.1. Germany Power Generator For Military Market Estimates and Forecast, 2017-2030 (US$ Bn)
14.6.2.2. Germany Power Generator For Military, By Capacity, 2017-2030 (US$ Bn)
14.6.2.3. Germany Power Generator For Military, By Output Type, 2017-2030 (US$ Bn)
14.6.2.4. Germany Power Generator For Military, By Fuel Type, 2017-2030 (US$ Bn)
14.6.2.5. Germany Power Generator For Military, By Installation Type, 2017-2030 (US$ Bn)
14.6.2.6. Germany Power Generator For Military, By Application, 2017-2030 (US$ Bn)
14.6.3. France
14.6.3.1. France Power Generator For Military Market Estimates and Forecast, 2017-2030 (US$ Bn)
14.6.3.2. France Power Generator For Military, By Capacity, 2017-2030 (US$ Bn)
14.6.3.3. France Power Generator For Military, By Output Type, 2017-2030 (US$ Bn)
14.6.3.4. France Power Generator For Military, By Fuel Type, 2017-2030 (US$ Bn)
14.6.3.5. France Power Generator For Military, By Installation Type, 2017-2030 (US$ Bn)
14.6.3.6. France Power Generator For Military, By Application, 2017-2030 (US$ Bn)
14.6.4. UK
14.6.4.1. UK Power Generator For Military Market Estimates and Forecast, 2017-2030 (US$ Bn)
14.6.4.2. UK Power Generator For Military, By Capacity, 2017-2030 (US$ Bn)
14.6.4.3. UK Power Generator For Military, By Output Type, 2017-2030 (US$ Bn)
14.6.4.4. UK Power Generator For Military, By Fuel Type, 2017-2030 (US$ Bn)
14.6.4.5. UK Power Generator For Military, By Installation Type, 2017-2030 (US$ Bn)
14.6.4.6. UK Power Generator For Military, By Application, 2017-2030 (US$ Bn)
14.6.5. Italy
14.6.5.1. Italy Power Generator For Military Market Estimates and Forecast, 2017-2030 (US$ Bn)
14.6.5.2. Italy Power Generator For Military, By Capacity, 2017-2030 (US$ Bn)
14.6.5.3. Italy Power Generator For Military, By Output Type, 2017-2030 (US$ Bn)
14.6.5.4. Italy Power Generator For Military, By Fuel Type, 2017-2030 (US$ Bn)
14.6.5.5. Italy Power Generator For Military, By Installation Type, 2017-2030 (US$ Bn)
14.6.5.6. Italy Power Generator For Military, By Application, 2017-2030 (US$ Bn)
14.6.6. Spain
14.6.6.1. Spain Power Generator For Military Market Estimates and Forecast, 2017-2030 (US$ Bn)
14.6.6.2. Spain Power Generator For Military, By Capacity, 2017-2030 (US$ Bn)
14.6.6.3. Spain Power Generator For Military, By Output Type, 2017-2030 (US$ Bn)
14.6.6.4. Spain Power Generator For Military, By Fuel Type, 2017-2030 (US$ Bn)
14.6.6.5. Spain Power Generator For Military, By Installation Type, 2017-2030 (US$ Bn)
14.6.6.6. Spain Power Generator For Military, By Application, 2017-2030 (US$ Bn)
14.6.7. Rest of Europe
14.6.7.1. Rest of Europe Power Generator For Military Market Estimates and Forecast, 2017-2030 (US$ Bn)
14.6.7.2. Rest of Europe Power Generator For Military, By Capacity, 2017-2030 (US$ Bn)
14.6.7.3. Rest of Europe Power Generator For Military, By Output Type, 2017-2030 (US$ Bn)
14.6.7.4. Rest of Europe Power Generator For Military, By Fuel Type, 2017-2030 (US$ Bn)
14.6.7.5. Rest of Europe Power Generator For Military, By Installation Type, 2017-2030 (US$ Bn)
14.6.7.6. Rest of Europe Power Generator For Military, By Application, 2017-2030 (US$ Bn)

15. Asia Pacific Power Generator For Military Market Analysis
15.1. Asia Pacific Power Generator For Military Market, by Capacity, 2017-2030(US$ Bn)
15.1.1. Overview
15.1.2. SRC Analysis
15.2. Asia Pacific Power Generator For Military Market, by Output Type, 2017-2030(US$ Bn)
15.2.1. Overview
15.2.2. SRC Analysis
15.3. Asia Pacific Power Generator For Military Market, by Fuel Type, 2017-2030(US$ Bn)
15.3.1. Overview
15.3.2. SRC Analysis
15.4. Asia Pacific Power Generator For Military Market, by Installation Type, 2017-2030(US$ Bn)
15.4.1. Overview
15.4.2. SRC Analysis
15.5. Asia Pacific Power Generator For Military Market, by Application, 2017-2030(US$ Bn)
15.5.1. Overview
15.5.2. SRC Analysis
15.6. Asia Pacific Power Generator For Military Market, by Country, 2017-2030 (US$ Bn)
15.6.1. Asia Pacific Power Generator For Military Market, by Country, 2022 Vs 2030 (in%)
15.6.2. China
15.6.2.1. China Power Generator For Military Market Estimates and Forecast, 2017-2030 (US$ Bn)
15.6.2.2. China Power Generator For Military, By Capacity, 2017-2030 (US$ Bn)
15.6.2.3. China Power Generator For Military, By Output Type, 2017-2030 (US$ Bn)
15.6.2.4. China Power Generator For Military, By Fuel Type, 2017-2030 (US$ Bn)
15.6.2.5. China Power Generator For Military, By Installation Type, 2017-2030 (US$ Bn)
15.6.2.6. China Power Generator For Military, By Application, 2017-2030 (US$ Bn)
15.6.3. Japan
15.6.3.1. Japan Power Generator For Military Market Estimates and Forecast, 2017-2030 (US$ Bn)
15.6.3.2. Japan Power Generator For Military, By Capacity, 2017-2030 (US$ Bn)
15.6.3.3. Japan Power Generator For Military, By Output Type, 2017-2030 (US$ Bn)
15.6.3.4. Japan Power Generator For Military, By Fuel Type, 2017-2030 (US$ Bn)
15.6.3.4.1. Japan Power Generator For Military, By Installation Type, 2017-2030 (US$ Bn)
15.6.3.4.2. Japan Power Generator For Military, By Application, 2017-2030 (US$ Bn)
15.6.4. India
15.6.4.1. India Power Generator For Military Market Estimates and Forecast, 2017-2030 (US$ Bn)
15.6.4.2. India Power Generator For Military, By Capacity, 2017-2030 (US$ Bn)
15.6.4.3. India Power Generator For Military, By Output Type, 2017-2030 (US$ Bn)
15.6.4.4. India Power Generator For Military, By Fuel Type, 2017-2030 (US$ Bn)
15.6.4.5. India Power Generator For Military, By Installation Type, 2017-2030 (US$ Bn)
15.6.4.6. India Power Generator For Military, By Application, 2017-2030 (US$ Bn)
15.6.5. South Korea
15.6.5.1. South Korea Power Generator For Military Market Estimates and Forecast, 2017-2030 (US$ Bn)
15.6.5.2. South Korea Power Generator For Military, By Capacity, 2017-2030 (US$ Bn)
15.6.5.3. South Korea Power Generator For Military, By Output Type, 2017-2030 (US$ Bn)
15.6.5.4. South Korea Power Generator For Military, By Fuel Type, 2017-2030 (US$ Bn)
15.6.5.5. South Korea Power Generator For Military, By Installation Type, 2017-2030 (US$ Bn)
15.6.5.6. South Korea Power Generator For Military, By Application, 2017-2030 (US$ Bn)
15.6.6. South-East Asia
15.6.6.1. South-East Asia Power Generator For Military Market Estimates and Forecast, 2017-2030 (US$ Bn)
15.6.6.2. South-East Asia Power Generator For Military, By Capacity, 2017-2030 (US$ Bn)
15.6.6.3. South-East Asia Power Generator For Military, By Output Type, 2017-2030 (US$ Bn)
15.6.6.4. South-East Asia Power Generator For Military, By Fuel Type, 2017-2030 (US$ Bn)
15.6.6.5. South East Asia Power Generator For Military, By Installation Type, 2017-2030 (US$ Bn)
15.6.6.6. South East Asia Power Generator For Military, By Application, 2017-2030 (US$ Bn)
15.6.7. Rest of Asia Pacific
15.6.7.1. Rest of Asia Pacific Power Generator For Military Market Estimates and Forecast, 2017-2030 (US$ Bn)
15.6.7.2. Rest of Asia Pacific Power Generator For Military, By Capacity, 2017-2030 (US$ Bn)
15.6.7.3. Rest of Asia Pacific Power Generator For Military, By Output Type, 2017-2030 (US$ Bn)
15.6.7.4. Rest of Asia Pacific Power Generator For Military, By Fuel Type, 2017-2030 (US$ Bn)
15.6.7.5. Rest of Asia Pacific Power Generator For Military, By Installation Type, 2017-2030 (US$ Bn)
15.6.7.6. Rest of Asia Pacific Power Generator For Military, By Application, 2017-2030 (US$ Bn)

16. Latin America Power Generator For Military Market Analysis
16.1. Latin America Power Generator For Military Market, by Capacity, 2017-2030(US$ Bn)
16.1.1. Overview
16.1.2. SRC Analysis
16.2. Latin America Power Generator For Military Market, by Output Type, 2017-2030(US$ Bn)
16.2.1. Overview
16.2.2. SRC Analysis
16.3. Latin America Power Generator For Military Market, by Fuel Type, 2017-2030(US$ Bn)
16.3.1. Overview
16.3.2. SRC Analysis
16.4. Latin America Power Generator For Military Market, by Installation Type, 2017-2030(US$ Bn)
16.4.1. Overview
16.4.2. SRC Analysis
16.5. Latin America Power Generator For Military Market, by Application, 2017-2030(US$ Bn)
16.5.1. Overview
16.5.2. SRC Analysis
16.6. Latin America Power Generator For Military Market, by Country, 2017-2030 (US$ Bn)
16.6.1. Latin America Power Generator For Military Market, by Country, 2022 Vs 2030 (in%)
16.6.2. Brazil
16.6.2.1. Brazil Power Generator For Military Market Estimates and Forecast, 2017-2030 (US$ Bn)
16.6.2.2. Brazil Power Generator For Military, By Capacity, 2017-2030 (US$ Bn)
16.6.2.3. Brazil Power Generator For Military, By Output Type, 2017-2030 (US$ Bn)
16.6.2.4. Brazil Power Generator For Military, By Fuel Type, 2017-2030 (US$ Bn)
16.6.2.5. Brazil Power Generator For Military, By Installation Type, 2017-2030 (US$ Bn)
16.6.2.6. Brazil Power Generator For Military, By Application, 2017-2030 (US$ Bn)
16.6.3. Argentina
16.6.3.1. Argentina Power Generator For Military Market Estimates and Forecast, 2017-2030 (US$ Bn)
16.6.3.2. Argentina Power Generator For Military, By Capacity, 2017-2030 (US$ Bn)
16.6.3.3. Argentina Power Generator For Military, By Output Type, 2017-2030 (US$ Bn)
16.6.3.4. Argentina Power Generator For Military, By Fuel Type, 2017-2030 (US$ Bn)
16.6.3.5. Argentina Power Generator For Military, By Installation Type, 2017-2030 (US$ Bn)
16.6.3.6. Argentina Power Generator For Military, By Application, 2017-2030 (US$ Bn)
16.6.4. Rest of Latin America
16.6.4.1. Rest of Latin America Power Generator For Military Market Estimates and Forecast, 2017-2030 (US$ Bn)
16.6.4.2. Rest of Latin America Power Generator For Military, By Capacity, 2017-2030 (US$ Bn)
16.6.4.3. Rest of Latin America Power Generator For Military, By Output Type, 2017-2030 (US$ Bn)
16.6.4.4. Rest of Latin America Power Generator For Military, By Fuel Type, 2017-2030 (US$ Bn)
16.6.4.5. Rest of Latin America Power Generator For Military, By Installation Type, 2017-2030 (US$ Bn)
16.6.4.6. Rest of Latin America Power Generator For Military, By Application, 2017-2030 (US$ Bn)

17. Middle East and Africa Power Generator For Military Market Analysis
17.1. Middle East and Africa Power Generator For Military Market, by Capacity, 2017-2030(US$ Bn)
17.1.1. Overview
17.1.2. SRC Analysis
17.2. Middle East and Africa Power Generator For Military Market, by Output Type, 2017-2030(US$ Bn)
17.2.1. Overview
17.2.2. SRC Analysis
17.3. Middle East and Africa Power Generator For Military Market, by Fuel Type, 2017-2030(US$ Bn)
17.3.1. Overview
17.3.2. SRC Analysis
17.4. Middle East & Africa Power Generator For Military Market, by Installation Type, 2017-2030(US$ Bn)
17.4.1. Overview
17.4.2. SRC Analysis
17.5. Middle East & Africa Power Generator For Military Market, by Application, 2017-2030(US$ Bn)
17.5.1. Overview
17.5.2. SRC Analysis
17.6. Middle East and Africa Power Generator For Military Market, by Country, 2017-2030 (US$ Bn)
17.6.1. Middle East and Africa Power Generator For Military Market, by Country, 2022 Vs 2030 (in%)
17.6.2. GCC Countries
17.6.2.1. GCC Countries Power Generator For Military Market Estimates and Forecast, 2017-2030 (US$ Bn)
17.6.2.2. GCC Countries Power Generator For Military, By Capacity, 2017-2030 (US$ Bn)
17.6.2.3. GCC Countries Power Generator For Military, By Output Type, 2017-2030 (US$ Bn)
17.6.2.4. GCC Countries Power Generator For Military, By Fuel Type, 2017-2030 (US$ Bn)
17.6.2.5. GCC Countries Power Generator For Military, By Installation Type, 2017-2030 (US$ Bn)
17.6.2.6. GCC Countries Power Generator For Military, By Application, 2017-2030 (US$ Bn)
17.6.3. South Africa
17.6.3.1. South Africa Power Generator For Military Market Estimates and Forecast, 2017-2030 (US$ Bn)
17.6.3.2. South Africa Power Generator For Military, By Capacity, 2017-2030 (US$ Bn)
17.6.3.3. South Africa Power Generator For Military, By Output Type, 2017-2030 (US$ Bn)
17.6.3.4. South Africa Power Generator For Military, By Fuel Type, 2017-2030 (US$ Bn)
17.6.3.5. South Africa Power Generator For Military, By Installation Type, 2017-2030 (US$ Bn)
17.6.3.6. South Africa Power Generator For Military, By Application, 2017-2030 (US$ Bn)
17.6.4. Rest of Middle East and Africa
17.6.4.1. Rest of Middle East and Africa Power Generator For Military Market Estimates and Forecast, 2017-2030 (US$ Bn)
17.6.4.2. Rest of Middle East and Africa Power Generator For Military, By Capacity, 2017-2030 (US$ Bn)
17.6.4.3. Rest of Middle East and Africa Power Generator For Military, By Output Type, 2017-2030 (US$ Bn)
17.6.4.4. Rest of Middle East and Africa Power Generator For Military, By Fuel Type, 2017-2030 (US$ Bn)
17.6.4.5. Rest of Middle East & Africa Power Generator For Military, By Installation Type, 2017-2030 (US$ Bn)
17.6.4.6. Rest of Middle East & Africa Power Generator For Military, By Application, 2017-2030 (US$ Bn)

18. Company Profiles
18.1. Caterpillar Inc.
18.1.1. Company Overview
18.1.2. Products/Services Portfolio
18.1.3. Geographical Presence
18.1.4. Financial Summary
18.1.4.1. Market Revenue and Net Profit (2019-2022)
18.1.4.2. Business Segment Revenue Analysis
18.1.4.3. Geographical Revenue Analysis
18.2. Cummins Inc.
18.3. Rolls-Royce Holdings plc
18.4. Harrington Generators International
18.5. HIMOINSA
18.6. Teknel SRL
18.7. VÝVOJ Martin
18.8. GRUPEL S.A.
18.9. HITZINGER GmbH
18.10. Ascot Industrial S.r.l.
18.11. Fischer Panda GmbH
18.12. GREEN POWER SYSTEMS S.r.l.
18.13. Kirloskar Oil Engines Ltd.
18.14. Kohler Co.
18.15. Ausonia S.r.l.

List of Figures
FIG. 1 Global Power Generator For Military Market: Research Methodology
FIG. 2 Market Size Estimation – Top Down & Bottom up Approach
FIG. 3 Global Power Generator For Military Market Segmentation
FIG. 4 Global Power Generator For Military Market, by Capacity, 2022 (US$ Bn)
FIG. 5 Global Power Generator For Military Market, by Output Type, 2022 (US$ Bn)
FIG. 6 Global Power Generator For Military Market, by Fuel Type, 2022 (US$ Bn)
FIG. 7 Global Power Generator For Military Market, by Installation Type, 2022 (US$ Bn)
FIG. 8 Global Power Generator For Military Market, by Application, 2022 (US$ Bn)
FIG. 9 Global Power Generator For Military Market, by Geography, 2022 (US$ Bn)
FIG. 10 Attractive Investment Proposition, by Capacity, 2022
FIG. 11 Attractive Investment Proposition, by Output Type, 2022
FIG. 12 Attractive Investment Proposition, by Fuel Type, 2022
FIG. 13 Attractive Investment Proposition, by Installation Type, 2022
FIG. 14 Attractive Investment Proposition, by Application, 2022
FIG. 15 Attractive Investment Proposition, by Geography, 2022
FIG. 16 Global Market Share Analysis of Key Power Generator For Military Market Manufacturers, 2022
FIG. 17 Global Market Positioning of Key Power Generator For Military Market Manufacturers, 2022
FIG. 18 Global Power Generator For Military Market Value Contribution, By Capacity, 2022 & 2030 (Value %)
FIG. 19 Global Power Generator For Military Market, by Up to 60 KW, Value, 2017-2030 (US$ Bn)
FIG. 20 Global Power Generator For Military Market, by 61 to 250 KW, Value, 2017-2030 (US$ Bn)
FIG. 21 Global Power Generator For Military Market, by 251 to 500 KW, Value, 2017-2030 (US$ Bn)
FIG. 22 Global Power Generator For Military Market, by 501 to 1000 KW, Value, 2017-2030 (US$ Bn)
FIG. 23 Global Power Generator For Military Market, by Above 1000 KW, Value, 2017-2030 (US$ Bn)
FIG. 24 Global Power Generator For Military Market Value Contribution, By Output Type, 2022 & 2030 (Value %)
FIG. 25 Global Power Generator For Military Market, by AC, Value, 2017-2030 (US$ Bn)
FIG. 26 Global Power Generator For Military Market, by DC, 2017-2030 (US$ Bn)
FIG. 27 Global Power Generator For Military Market Value Contribution, By Fuel Type, 2022 & 2030 (Value %)
FIG. 28 Global Power Generator For Military Market, by Diesel , Value, 2017-2030 (US$ Bn)
FIG. 29 Global Power Generator For Military Market, by Natural Gas, 2017-2030 (US$ Bn)
FIG. 30 Global Power Generator For Military Market Value Contribution, By Installation Type, 2022 & 2030 (Value %)
FIG. 31 Global Power Generator For Military Market, by Stationery, Value, 2017-2030 (US$ Bn)
FIG. 32 Global Power Generator For Military Market, by Mobile, 2017-2030 (US$ Bn)
FIG. 33 Global Power Generator For Military Market, by Portable, 2017-2030 (US$ Bn)
FIG. 34 Global Power Generator For Military Market Value Contribution, By Application, 2022 & 2030 (Value %)
FIG. 35 Global Power Generator For Military Market, by Communication System, Value, 2017-2030 (US$ Bn)
FIG. 36 Global Power Generator For Military Market, by Air Defence System, 2017-2030 (US$ Bn)
FIG. 37 Global Power Generator For Military Market, by Field Hospitals, Value, 2017-2030 (US$ Bn)
FIG. 38 Global Power Generator For Military Market, by Field Camps/Accommodation, Value, 2017-2030 (US$ Bn)
FIG. 39 Global Power Generator For Military Market, by Lighting, Value, 2017-2030 (US$ Bn)
FIG. 40 Global Power Generator For Military Market, by Military Vehicles, Value, 2017-2030 (US$ Bn)
FIG. 41 Global Power Generator For Military Market, by Others, Value, 2017-2030 (US$ Bn)
FIG. 42 North America Power Generator For Military Market, 2017-2030 (US$ Bn)
FIG. 43 U.S. Power Generator For Military Market, 2017-2030 (US$ Bn)
FIG. 44 Canada Power Generator For Military Market, 2017-2030 (US$ Bn)
FIG. 45 Europe Power Generator For Military Market, 2017-2030 (US$ Bn)
FIG. 46 Germany Power Generator For Military Market, 2017-2030 (US$ Bn)
FIG. 47 France Power Generator For Military Market, 2017-2030 (US$ Bn)
FIG. 48 U.K. Power Generator For Military Market, 2017-2030 (US$ Bn)
FIG. 49 Italy Power Generator For Military Market, 2017-2030 (US$ Bn)
FIG. 50 Spain Power Generator For Military Market, 2017-2030 (US$ Bn)
FIG. 51 Rest of Europe Power Generator For Military Market, 2017-2030 (US$ Bn)
FIG. 52 Asia Pacific Power Generator For Military Market, 2017-2030 (US$ Bn)
FIG. 53 China Power Generator For Military Market, 2017-2030 (US$ Bn)
FIG. 54 Japan Power Generator For Military Market, 2017-2030 (US$ Bn)
FIG. 55 India Power Generator For Military Market, 2017-2030 (US$ Bn)
FIG. 56 South Korea Power Generator For Military Market, 2017-2030 (US$ Bn)
FIG. 57 South-East Asia Power Generator For Military Market, 2017-2030 (US$ Bn)
FIG. 58 Rest of Asia Pacific Power Generator For Military Market, 2017-2030 (US$ Bn)
FIG. 59 Latin America Power Generator For Military Market, 2017-2030 (US$ Bn)
FIG. 60 Brazil Power Generator For Military Market, 2017-2030 (US$ Bn)
FIG. 61 Mexico Power Generator For Military Market, 2017-2030 (US$ Bn)
FIG. 62 Rest of Latin America Power Generator For Military Market, 2017-2030 (US$ Bn)
FIG. 63 Middle East & Africa Power Generator For Military Market, 2017-2030 (US$ Bn)
FIG. 64 GCC Countries Power Generator For Military Market, 2017-2030 (US$ Bn)
FIG. 65 South Africa Power Generator For Military Market, 2017-2030 (US$ Bn)
FIG. 66 Rest of Middle East and Africa Power Generator For Military Market, 2017-2030 (US$ Bn)

List of Tables
TABLE 1 Market Snapshot: Global Power Generator For Military Market
TABLE 2 Global Power Generator For Military Market: Market Drivers Impact Analysis
TABLE 3 Global Power Generator For Military Market: Market Restraints Impact Analysis
TABLE 4 Global Power Generator For Military Market, by Competitive Benchmarking, 2022
TABLE 5 Global Power Generator For Military Market, by Geographical Presence Analysis, 2022
TABLE 6 Global Power Generator For Military Market, by Key Strategies Analysis, 2022
TABLE 7 Global Power Generator For Military Market, by Up to 60 KW, By Region, 2017-2022 (US$ Bn)
TABLE 8 Global Power Generator For Military Market, by Up to 60 KW, By Region, 2023-2030 (US$ Bn)
TABLE 9 Global Power Generator For Military Market, by 61 to 250 KW, By Region, 2017-2022 (US$ Bn)
TABLE 10 Global Power Generator For Military Market, by 61 to 250 KW, By Region, 2023-2030 (US$ Bn)
TABLE 11 Global Power Generator For Military Market, by 251 to 500 KW, By Region, 2017-2022 (US$ Bn)
TABLE 12 Global Power Generator For Military Market, by 251 to 500 KW, By Region, 2023-2030 (US$ Bn)
TABLE 13 Global Power Generator For Military Market, by 501 to 1000 KW, By Region, 2017-2022 (US$ Bn)
TABLE 14 Global Power Generator For Military Market, by 501 to 1000 KW, By Region, 2023-2030 (US$ Bn)
TABLE 15 Global Power Generator For Military Market, by Above 1000 KW, By Region, 2017-2022 (US$ Bn)
TABLE 16 Global Power Generator For Military Market, by Above 1000 KW, By Region, 2023-2030 (US$ Bn)
TABLE 17 Global Power Generator For Military Market, by AC, By Region, 2017-2022 (US$ Bn)
TABLE 18 Global Power Generator For Military Market, by AC, By Region, 2023-2030 (US$ Bn)
TABLE 19 Global Power Generator For Military Market, by DC, By Region, 2017-2022 (US$ Bn)
TABLE 20 Global Power Generator For Military Market, by DC, By Region, 2023-2030 (US$ Bn)
TABLE 21 Global Power Generator For Military Market, by Diesel, By Region, 2017-2022 (US$ Bn)
TABLE 22 Global Power Generator For Military Market, by Diesel, By Region, 2023-2030 (US$ Bn)
TABLE 23 Global Power Generator For Military Market, by Natural Gas, By Region, 2017-2022 (US$ Bn)
TABLE 24 Global Power Generator For Military Market, by Natural Gas, By Region, 2023-2030 (US$ Bn)
TABLE 25 Global Power Generator For Military Market, by Stationery, 2017-2022 (US$ Bn)
TABLE 26 Global Power Generator For Military Market, by Stationery, 2023-2030 (US$ Bn)
TABLE 27 Global Power Generator For Military Market, by Mobile, 2017-2022 (US$ Bn)
TABLE 28 Global Power Generator For Military Market, by Mobile, 2023-2030 (US$ Bn)
TABLE 29 Global Power Generator For Military Market, by Portable, 2017-2022 (US$ Bn)
TABLE 30 Global Power Generator For Military Market, by Portable, 2023-2030 (US$ Bn)
TABLE 31 Global Power Generator For Military Market, by Communication System, 2017-2022 (US$ Bn)
TABLE 32 Global Power Generator For Military Market, by Communication System, 2023-2030 (US$ Bn)
TABLE 33 Global Power Generator For Military Market, by Air Defence System, 2017-2022 (US$ Bn)
TABLE 34 Global Power Generator For Military Market, by Air Defence System, 2023-2030 (US$ Bn)
TABLE 35 Global Power Generator For Military Market, by Field Hospitals, 2017-2022 (US$ Bn)
TABLE 36 Global Power Generator For Military Market, by Field Hospitals, 2023-2030 (US$ Bn)
TABLE 37 Global Power Generator For Military Market, by Field Camps/Accommodation, 2017-2022 (US$ Bn)
TABLE 38 Global Power Generator For Military Market, by Field Camps/Accommodation, 2023-2030 (US$ Bn)
TABLE 39 Global Power Generator For Military Market, by Lighting, 2017-2022 (US$ Bn)
TABLE 40 Global Power Generator For Military Market, by Lighting, 2023-2030 (US$ Bn)
TABLE 41 Global Power Generator For Military Market, by Military Vehicles, 2017-2022 (US$ Bn)
TABLE 42 Global Power Generator For Military Market, by Military Vehicles, 2023-2030 (US$ Bn)
TABLE 43 Global Power Generator For Military Market, by Others, 2017-2022 (US$ Bn)
TABLE 44 Global Power Generator For Military Market, by Others, 2023-2030 (US$ Bn)
TABLE 45 Global Power Generator For Military Market, by Region, 2017-2022 (US$ Bn)
TABLE 46 Global Power Generator For Military Market, by Region, 2023-2030 (US$ Bn)
TABLE 47 North America Power Generator For Military Market, by Capacity, 2017-2022 (US$ Bn)
TABLE 48 North America Power Generator For Military Market, by Capacity, 2023-2030 (US$ Bn)
TABLE 49 North America Power Generator For Military Market, by Output Type, 2017-2022 (US$ Bn)
TABLE 50 North America Power Generator For Military Market, by Output Type, 2023-2030 (US$ Bn)
TABLE 51 North America Power Generator For Military Market, by Fuel Type, 2017-2022 (US$ Bn)
TABLE 52 North America Power Generator For Military Market, by Fuel Type, 2023-2030 (US$ Bn)
TABLE 53 North America Power Generator For Military Market, by Installation Type, 2017-2022 (US$ Bn)
TABLE 54 North America Power Generator For Military Market, by Installation Type, 2023-2030 (US$ Bn)
TABLE 55 North America Power Generator For Military Market, by Application, 2017-2022 (US$ Bn)
TABLE 56 North America Power Generator For Military Market, by Application, 2023-2030 (US$ Bn)
TABLE 57 North America Power Generator For Military Market, by Country, 2017-2022 (US$ Bn)
TABLE 58 North America Power Generator For Military Market, by Country, 2023-2030 (US$ Bn)
TABLE 59 United States Power Generator For Military Market, by Capacity, 2017-2022 (US$ Bn)
TABLE 60 United States Power Generator For Military Market, by Capacity, 2023-2030 (US$ Bn)
TABLE 61 United States Power Generator For Military Market, by Output Type, 2017-2022 (US$ Bn)
TABLE 62 United States Power Generator For Military Market, by Output Type, 2023-2030 (US$ Bn)
TABLE 63 United States Power Generator For Military Market, by Fuel Type, 2017-2022 (US$ Bn)
TABLE 64 United States Power Generator For Military Market, by Fuel Type, 2023-2030 (US$ Bn)
TABLE 65 United States Power Generator For Military Market, by Installation Type, 2017-2022 (US$ Bn)
TABLE 66 United States Power Generator For Military Market, by Installation Type, 2023-2030 (US$ Bn)
TABLE 67 United States Power Generator For Military Market, by Application, 2017-2022 (US$ Bn)
TABLE 68 United States Power Generator For Military Market, by Application, 2023-2030 (US$ Bn)
TABLE 69 Canada Power Generator For Military Market, by Capacity, 2017-2022 (US$ Bn)
TABLE 70 Canada Power Generator For Military Market, by Capacity, 2023-2030 (US$ Bn)
TABLE 71 Canada Power Generator For Military Market, by Output Type, 2017-2022 (US$ Bn)
TABLE 72 Canada Power Generator For Military Market, by Output Type, 2023-2030 (US$ Bn)
TABLE 73 Canada Power Generator For Military Market, by Fuel Type, 2017-2022 (US$ Bn)
TABLE 74 Canada Power Generator For Military Market, by Fuel Type, 2023-2030 (US$ Bn)
TABLE 75 Canada Power Generator For Military Market, by Installation Type, 2017-2022 (US$ Bn)
TABLE 76 Canada Power Generator For Military Market, by Installation Type, 2023-2030 (US$ Bn)
TABLE 77 Canada Power Generator For Military Market, by Application, 2017-2022 (US$ Bn)
TABLE 78 Canada Power Generator For Military Market, by Application, 2023-2030 (US$ Bn)
TABLE 79 Mexico Power Generator For Military Market, by Capacity, 2017-2022 (US$ Bn)
TABLE 80 Mexico Power Generator For Military Market, by Capacity, 2023-2030 (US$ Bn)
TABLE 81 Mexico Power Generator For Military Market, by Output Type, 2017-2022 (US$ Bn)
TABLE 82 Mexico Power Generator For Military Market, by Output Type, 2023-2030 (US$ Bn)
TABLE 83 Mexico Power Generator For Military Market, by Fuel Type, 2017-2022 (US$ Bn)
TABLE 84 Mexico Power Generator For Military Market, by Fuel Type, 2023-2030 (US$ Bn)
TABLE 85 Mexico Power Generator For Military Market, by Installation Type, 2017-2022 (US$ Bn)
TABLE 86 Mexico Power Generator For Military Market, by Installation Type, 2023-2030 (US$ Bn)
TABLE 87 Mexico Power Generator For Military Market, by Application, 2017-2022 (US$ Bn)
TABLE 88 Mexico Power Generator For Military Market, by Application, 2023-2030 (US$ Bn)
TABLE 89 Europe Power Generator For Military Market, by Capacity, 2017-2022 (US$ Bn)
TABLE 90 Europe Power Generator For Military Market, by Capacity, 2023-2030 (US$ Bn)
TABLE 91 Europe Power Generator For Military Market, by Output Type, 2017-2022 (US$ Bn)
TABLE 92 Europe Power Generator For Military Market, by Output Type, 2023-2030 (US$ Bn)
TABLE 93 Europe Power Generator For Military Market, by Fuel Type, 2017-2022 (US$ Bn)
TABLE 94 Europe Power Generator For Military Market, by Fuel Type, 2023-2030 (US$ Bn)
TABLE 95 Europe Power Generator For Military Market, by Installation Type, 2017-2022 (US$ Bn)
TABLE 96 Europe Power Generator For Military Market, by Installation Type, 2023-2030 (US$ Bn)
TABLE 97 Europe Power Generator For Military Market, by Application, 2017-2022 (US$ Bn)
TABLE 98 Europe Power Generator For Military Market, by Application, 2023-2030 (US$ Bn)
TABLE 99 Europe Power Generator For Military Market, by Country, 2017-2022 (US$ Bn)
TABLE 100 Europe Power Generator For Military Market, by Country, 2023-2030 (US$ Bn)
TABLE 101 Germany Power Generator For Military Market, by Capacity, 2017-2022 (US$ Bn)
TABLE 102 Germany Power Generator For Military Market, by Capacity, 2023-2030 (US$ Bn)
TABLE 103 Germany Power Generator For Military Market, by Output Type, 2017-2022 (US$ Bn)
TABLE 104 Germany Power Generator For Military Market, by Output Type, 2023-2030 (US$ Bn)
TABLE 105 Germany Power Generator For Military Market, by Fuel Type, 2017-2022 (US$ Bn)
TABLE 106 Germany Power Generator For Military Market, by Fuel Type, 2023-2030 (US$ Bn)
TABLE 107 Germany Power Generator For Military Market, by Installation Type, 2017-2022 (US$ Bn)
TABLE 108 Germany Power Generator For Military Market, by Installation Type, 2023-2030 (US$ Bn)
TABLE 109 Germany Power Generator For Military Market, by Application, 2017-2022 (US$ Bn)
TABLE 110 Germany Power Generator For Military Market, by Application, 2023-2030 (US$ Bn)
TABLE 111 France Power Generator For Military Market, by Capacity, 2017-2022 (US$ Bn)
TABLE 112 France Power Generator For Military Market, by Capacity, 2023-2030 (US$ Bn)
TABLE 113 France Power Generator For Military Market, by Output Type, 2017-2022 (US$ Bn)
TABLE 114 France Power Generator For Military Market, by Output Type, 2023-2030 (US$ Bn)
TABLE 115 France Power Generator For Military Market, by Fuel Type, 2017-2022 (US$ Bn)
TABLE 116 France Power Generator For Military Market, by Fuel Type, 2023-2030 (US$ Bn)
TABLE 117 France Power Generator For Military Market, by Installation Type, 2017-2022 (US$ Bn)
TABLE 118 France Power Generator For Military Market, by Installation Type, 2023-2030 (US$ Bn)
TABLE 119 France Power Generator For Military Market, by Application, 2017-2022 (US$ Bn)
TABLE 120 France Power Generator For Military Market, by Application, 2023-2030 (US$ Bn)
TABLE 121 United Kingdom Power Generator For Military Market, by Capacity, 2017-2022 (US$ Bn)
TABLE 122 United Kingdom Power Generator For Military Market, by Capacity, 2023-2030 (US$ Bn)
TABLE 123 United Kingdom Power Generator For Military Market, by Output Type, 2017-2022 (US$ Bn)
TABLE 124 United Kingdom Power Generator For Military Market, by Output Type, 2023-2030 (US$ Bn)
TABLE 125 United Kingdom Power Generator For Military Market, by Fuel Type, 2017-2022 (US$ Bn)
TABLE 126 United Kingdom Power Generator For Military Market, by Fuel Type, 2023-2030 (US$ Bn)
TABLE 127 United Kingdom Power Generator For Military Market, by Installation Type, 2017-2022 (US$ Bn)
TABLE 128 United Kingdom Power Generator For Military Market, by Installation Type, 2023-2030 (US$ Bn)
TABLE 129 United Kingdom Power Generator For Military Market, by Application, 2017-2022 (US$ Bn)
TABLE 130 United Kingdom Power Generator For Military Market, by Application, 2023-2030 (US$ Bn)
TABLE 131 Italy Power Generator For Military Market, by Capacity, 2017-2022 (US$ Bn)
TABLE 132 Italy Power Generator For Military Market, by Capacity, 2023-2030 (US$ Bn)
TABLE 133 Italy Power Generator For Military Market, by Output Type, 2017-2022 (US$ Bn)
TABLE 134 Italy Power Generator For Military Market, by Output Type, 2023-2030 (US$ Bn)
TABLE 135 Italy Power Generator For Military Market, by Fuel Type, 2017-2022 (US$ Bn)
TABLE 136 Italy Power Generator For Military Market, by Fuel Type, 2023-2030 (US$ Bn)
TABLE 137 Italy Power Generator For Military Market, by Installation Type, 2017-2022 (US$ Bn)
TABLE 138 Italy Power Generator For Military Market, by Installation Type, 2023-2030 (US$ Bn)
TABLE 139 Italy Power Generator For Military Market, by Application, 2017-2022 (US$ Bn)
TABLE 140 Italy Power Generator For Military Market, by Application, 2023-2030 (US$ Bn)
TABLE 141 Spain Power Generator For Military Market, by Capacity, 2017-2022 (US$ Bn)
TABLE 142 Spain Power Generator For Military Market, by Capacity, 2023-2030 (US$ Bn)
TABLE 143 Spain Power Generator For Military Market, by Output Type, 2017-2022 (US$ Bn)
TABLE 144 Spain Power Generator For Military Market, by Output Type, 2023-2030 (US$ Bn)
TABLE 145 Spain Power Generator For Military Market, by Fuel Type, 2017-2022 (US$ Bn)
TABLE 146 Spain Power Generator For Military Market, by Fuel Type, 2023-2030 (US$ Bn)
TABLE 147 Spain Power Generator For Military Market, by Installation Type, 2017-2022 (US$ Bn)
TABLE 148 Spain Power Generator For Military Market, by Installation Type, 2023-2030 (US$ Bn)
TABLE 149 Spain Power Generator For Military Market, by Application, 2017-2022 (US$ Bn)
TABLE 150 Spain Power Generator For Military Market, by Application, 2023-2030 (US$ Bn)
TABLE 151 Rest of Europe Power Generator For Military Market, by Capacity, 2017-2022 (US$ Bn)
TABLE 152 Rest of Europe Power Generator For Military Market, by Capacity, 2023-2030 (US$ Bn)
TABLE 153 Rest of Europe Power Generator For Military Market, by Output Type, 2017-2022 (US$ Bn)
TABLE 154 Rest of Europe Power Generator For Military Market, by Output Type, 2023-2030 (US$ Bn)
TABLE 155 Rest of Europe Power Generator For Military Market, by Fuel Type, 2017-2022 (US$ Bn)
TABLE 156 Rest of Europe Power Generator For Military Market, by Fuel Type, 2023-2030 (US$ Bn)
TABLE 157 Rest of Europe Power Generator For Military Market, by Installation Type, 2017-2022 (US$ Bn)
TABLE 158 Rest of Europe Power Generator For Military Market, by Installation Type, 2023-2030 (US$ Bn)
TABLE 159 Rest of Europe Power Generator For Military Market, by Application, 2017-2022 (US$ Bn)
TABLE 160 Rest of Europe Power Generator For Military Market, by Application, 2023-2030 (US$ Bn)
TABLE 161 Asia Pacific Power Generator For Military Market, by Capacity, 2017-2022 (US$ Bn)
TABLE 162 Asia Pacific Power Generator For Military Market, by Capacity, 2023-2030 (US$ Bn)
TABLE 163 Asia Pacific Power Generator For Military Market, by Output Type, 2017-2022 (US$ Bn)
TABLE 164 Asia Pacific Power Generator For Military Market, by Output Type, 2023-2030 (US$ Bn)
TABLE 165 Asia Pacific Power Generator For Military Market, by Fuel Type, 2017-2022 (US$ Bn)
TABLE 166 Asia Pacific Power Generator For Military Market, by Fuel Type, 2023-2030 (US$ Bn)
TABLE 167 Asia Pacific Power Generator For Military Market, by Installation Type, 2017-2022 (US$ Bn)
TABLE 168 Asia Pacific Power Generator For Military Market, by Installation Type, 2023-2030 (US$ Bn)
TABLE 169 Asia Pacific Power Generator For Military Market, by Application, 2017-2022 (US$ Bn)
TABLE 170 Asia Pacific Power Generator For Military Market, by Application, 2023-2030 (US$ Bn)
TABLE 171 China Power Generator For Military Market, by Capacity, 2017-2022 (US$ Bn)
TABLE 172 China Power Generator For Military Market, by Capacity, 2023-2030 (US$ Bn)
TABLE 173 China Power Generator For Military Market, by Output Type, 2017-2022 (US$ Bn)
TABLE 174 China Power Generator For Military Market, by Output Type, 2023-2030 (US$ Bn)
TABLE 175 China Power Generator For Military Market, by Fuel Type, 2017-2022 (US$ Bn)
TABLE 176 China Power Generator For Military Market, by Fuel Type, 2023-2030 (US$ Bn)
TABLE 177 China Power Generator For Military Market, by Installation Type, 2017-2022 (US$ Bn)
TABLE 178 China Power Generator For Military Market, by Installation Type, 2023-2030 (US$ Bn)
TABLE 179 China Power Generator For Military Market, by Application, 2017-2022 (US$ Bn)
TABLE 180 China Power Generator For Military Market, by Application, 2023-2030 (US$ Bn)
TABLE 181 Japan Power Generator For Military Market, by Capacity, 2017-2022 (US$ Bn)
TABLE 182 Japan Power Generator For Military Market, by Capacity, 2023-2030 (US$ Bn)
TABLE 183 Japan Power Generator For Military Market, by Output Type, 2017-2022 (US$ Bn)
TABLE 184 Japan Power Generator For Military Market, by Output Type, 2023-2030 (US$ Bn)
TABLE 185 Japan Power Generator For Military Market, by Fuel Type, 2017-2022 (US$ Bn)
TABLE 186 Japan Power Generator For Military Market, by Fuel Type, 2023-2030 (US$ Bn)
TABLE 187 Japan Power Generator For Military Market, by Installation Type, 2017-2022 (US$ Bn)
TABLE 188 Japan Power Generator For Military Market, by Installation Type, 2023-2030 (US$ Bn)
TABLE 189 Japan Power Generator For Military Market, by Application, 2017-2022 (US$ Bn)
TABLE 190 Japan Power Generator For Military Market, by Application, 2023-2030 (US$ Bn)
TABLE 191 India Power Generator For Military Market, by Capacity, 2017-2022 (US$ Bn)
TABLE 192 India Power Generator For Military Market, by Capacity, 2023-2030 (US$ Bn)
TABLE 193 India Power Generator For Military Market, by Output Type, 2017-2022 (US$ Bn)
TABLE 194 India Power Generator For Military Market, by Output Type, 2023-2030 (US$ Bn)
TABLE 195 India Power Generator For Military Market, by Fuel Type, 2017-2022 (US$ Bn)
TABLE 196 India Power Generator For Military Market, by Fuel Type, 2023-2030 (US$ Bn)
TABLE 197 India Power Generator For Military Market, by Installation Type, 2017-2022 (US$ Bn)
TABLE 198 India Power Generator For Military Market, by Installation Type, 2023-2030 (US$ Bn)
TABLE 199 India Power Generator For Military Market, by Application, 2017-2022 (US$ Bn)
TABLE 200 India Power Generator For Military Market, by Application, 2023-2030 (US$ Bn)
TABLE 201 South Korea Power Generator For Military Market, by Capacity, 2017-2022 (US$ Bn)
TABLE 202 South Korea Power Generator For Military Market, by Capacity, 2023-2030 (US$ Bn)
TABLE 203 South Korea Power Generator For Military Market, by Output Type, 2017-2022 (US$ Bn)
TABLE 204 South Korea Power Generator For Military Market, by Output Type, 2023-2030 (US$ Bn)
TABLE 205 South Korea Power Generator For Military Market, by Fuel Type, 2017-2022 (US$ Bn)
TABLE 206 South Korea Power Generator For Military Market, by Fuel Type, 2023-2030 (US$ Bn)
TABLE 207 South Korea Power Generator For Military Market, by Installation Type, 2017-2022 (US$ Bn)
TABLE 208 South Korea Power Generator For Military Market, by Installation Type, 2023-2030 (US$ Bn)
TABLE 209 South Korea Power Generator For Military Market, by Application, 2017-2022 (US$ Bn)
TABLE 210 South Korea Power Generator For Military Market, by Application, 2023-2030 (US$ Bn)
TABLE 211 South-East Asia Power Generator For Military Market, by Capacity, 2017-2022 (US$ Bn)
TABLE 212 South-East Asia Power Generator For Military Market, by Capacity, 2023-2030 (US$ Bn)
TABLE 213 South-East Asia Power Generator For Military Market, by Output Type, 2017-2022 (US$ Bn)
TABLE 214 South-East Asia Power Generator For Military Market, by Output Type, 2023-2030 (US$ Bn)
TABLE 215 South-East Asia Power Generator For Military Market, by Fuel Type, 2017-2022 (US$ Bn)
TABLE 216 South-East Asia Power Generator For Military Market, by Fuel Type, 2023-2030 (US$ Bn)
TABLE 217 South East Asia Power Generator For Military Market, by Installation Type, 2017-2022 (US$ Bn)
TABLE 218 South East Asia Power Generator For Military Market, by Installation Type, 2023-2030 (US$ Bn)
TABLE 219 South East Asia Power Generator For Military Market, by Application, 2017-2022 (US$ Bn)
TABLE 220 South East Asia Power Generator For Military Market, by Application, 2023-2030 (US$ Bn)
TABLE 221 Rest of Asia Pacific Power Generator For Military Market, by Capacity, 2017-2022 (US$ Bn)
TABLE 222 Rest of Asia Pacific Power Generator For Military Market, by Capacity, 2023-2030 (US$ Bn)
TABLE 223 Rest of Asia Pacific Power Generator For Military Market, by Output Type, 2017-2022 (US$ Bn)
TABLE 224 Rest of Asia Pacific Power Generator For Military Market, by Output Type, 2023-2030 (US$ Bn)
TABLE 225 Rest of Asia Pacific Power Generator For Military Market, by Fuel Type, 2017-2022 (US$ Bn)
TABLE 226 Rest of Asia Pacific Power Generator For Military Market, by Fuel Type, 2023-2030 (US$ Bn)
TABLE 227 Rest of Asia Pacific Power Generator For Military Market, by Installation Type, 2017-2022 (US$ Bn)
TABLE 228 Rest of Asia Pacific Power Generator For Military Market, by Installation Type, 2023-2030 (US$ Bn)
TABLE 229 Rest of Asia Pacific Power Generator For Military Market, by Application, 2017-2022 (US$ Bn)
TABLE 230 Rest of Asia Pacific Power Generator For Military Market, by Application, 2023-2030 (US$ Bn)
TABLE 231 Latin America Power Generator For Military Market, by Capacity, 2017-2022 (US$ Bn)
TABLE 232 Latin America Power Generator For Military Market, by Capacity, 2023-2030 (US$ Bn)
TABLE 233 Latin America Power Generator For Military Market, by Output Type, 2017-2022 (US$ Bn)
TABLE 234 Latin America Power Generator For Military Market, by Output Type, 2023-2030 (US$ Bn)
TABLE 235 Latin America Power Generator For Military Market, by Fuel Type, 2017-2022 (US$ Bn)
TABLE 236 Latin America Power Generator For Military Market, by Fuel Type, 2023-2030 (US$ Bn)
TABLE 237 Latin America Power Generator For Military Market, by Installation Type, 2017-2022 (US$ Bn)
TABLE 238 Latin America Power Generator For Military Market, by Installation Type, 2023-2030 (US$ Bn)
TABLE 239 Latin America Power Generator For Military Market, by Application, 2017-2022 (US$ Bn)
TABLE 240 Latin America Power Generator For Military Market, by Application, 2023-2030 (US$ Bn)
TABLE 241 Brazil Power Generator For Military Market, by Capacity, 2017-2022 (US$ Bn)
TABLE 242 Brazil Power Generator For Military Market, by Capacity, 2023-2030 (US$ Bn)
TABLE 243 Brazil Power Generator For Military Market, by Output Type, 2017-2022 (US$ Bn)
TABLE 244 Brazil Power Generator For Military Market, by Output Type, 2023-2030 (US$ Bn)
TABLE 245 Brazil Power Generator For Military Market, by Fuel Type, 2017-2022 (US$ Bn)
TABLE 246 Brazil Power Generator For Military Market, by Fuel Type, 2023-2030 (US$ Bn)
TABLE 247 Brazil Power Generator For Military Market, by Installation Type, 2017-2022 (US$ Bn)
TABLE 248 Brazil Power Generator For Military Market, by Installation Type, 2023-2030 (US$ Bn)
TABLE 249 Brazil Power Generator For Military Market, by Application, 2017-2022 (US$ Bn)
TABLE 250 Brazil Power Generator For Military Market, by Application, 2023-2030 (US$ Bn)
TABLE 251 Argentina Power Generator For Military Market, by Capacity, 2017-2022 (US$ Bn)
TABLE 252 Argentina Power Generator For Military Market, by Capacity, 2023-2030 (US$ Bn)
TABLE 253 Argentina Power Generator For Military Market, by Output Type, 2017-2022 (US$ Bn)
TABLE 254 Argentina Power Generator For Military Market, by Output Type, 2023-2030 (US$ Bn)
TABLE 255 Argentina Power Generator For Military Market, by Fuel Type, 2017-2022 (US$ Bn)
TABLE 256 Argentina Power Generator For Military Market, by Fuel Type, 2023-2030 (US$ Bn)
TABLE 257 Argentina Power Generator For Military Market, by Installation Type, 2017-2022 (US$ Bn)
TABLE 258 Argentina Power Generator For Military Market, by Installation Type, 2023-2030 (US$ Bn)
TABLE 259 Argentina Power Generator For Military Market, by Application, 2017-2022 (US$ Bn)
TABLE 260 Argentina Power Generator For Military Market, by Application, 2023-2030 (US$ Bn)
TABLE 261 Rest of Latin America Power Generator For Military Market, by Capacity, 2017-2022 (US$ Bn)
TABLE 262 Rest of Latin America Power Generator For Military Market, by Capacity, 2023-2030 (US$ Bn)
TABLE 263 Rest of Latin America Power Generator For Military Market, by Output Type, 2017-2022 (US$ Bn)
TABLE 264 Rest of Latin America Power Generator For Military Market, by Output Type, 2023-2030 (US$ Bn)
TABLE 265 Rest of Latin America Power Generator For Military Market, by Fuel Type, 2017-2022 (US$ Bn)
TABLE 266 Rest of Latin America Power Generator For Military Market, by Fuel Type, 2023-2030 (US$ Bn)
TABLE 267 Rest of Latin America Power Generator For Military Market, by Installation Type, 2017-2022 (US$ Bn)
TABLE 268 Rest of Latin America Power Generator For Military Market, by Installation Type, 2023-2030 (US$ Bn)
TABLE 269 Rest of Latin America Power Generator For Military Market, by Application, 2017-2022 (US$ Bn)
TABLE 270 Rest of Latin America Power Generator For Military Market, by Application, 2023-2030 (US$ Bn)
TABLE 271 Middle East and Africa Power Generator For Military Market, by Capacity, 2017-2022 (US$ Bn)
TABLE 272 Middle East and Africa Power Generator For Military Market, by Capacity, 2023-2030 (US$ Bn)
TABLE 273 Middle East and Africa Power Generator For Military Market, by Output Type, 2017-2022 (US$ Bn)
TABLE 274 Middle East and Africa Power Generator For Military Market, by Output Type, 2023-2030 (US$ Bn)
TABLE 275 Middle East and Africa Power Generator For Military Market, by Fuel Type, 2017-2022 (US$ Bn)
TABLE 276 Middle East and Africa Power Generator For Military Market, by Fuel Type, 2023-2030 (US$ Bn)
TABLE 277 Middle East and Africa Power Generator For Military Market, by Installation Type, 2017-2022 (US$ Bn)
TABLE 278 Middle East and Africa Power Generator For Military Market, by Installation Type, 2023-2030 (US$ Bn)
TABLE 279 Middle East and Africa Power Generator For Military Market, by Application, 2017-2022 (US$ Bn)
TABLE 280 Middle East and Africa Power Generator For Military Market, by Application, 2023-2030 (US$ Bn)
TABLE 281 GCC Countries Power Generator For Military Market, by Capacity, 2017-2022 (US$ Bn)
TABLE 282 GCC Countries Power Generator For Military Market, by Capacity, 2023-2030 (US$ Bn)
TABLE 283 GCC Countries Power Generator For Military Market, by Output Type, 2017-2022 (US$ Bn)
TABLE 284 GCC Countries Power Generator For Military Market, by Output Type, 2023-2030 (US$ Bn)
TABLE 285 GCC Countries Power Generator For Military Market, by Fuel Type, 2017-2022 (US$ Bn)
TABLE 286 GCC Countries Power Generator For Military Market, by Fuel Type, 2023-2030 (US$ Bn)
TABLE 287 GCC Countries Power Generator For Military Market, by Installation Type, 2017-2022 (US$ Bn)
TABLE 288 GCC Countries Power Generator For Military Market, by Installation Type, 2023-2030 (US$ Bn)
TABLE 289 GCC Countries Power Generator For Military Market, by Application, 2017-2022 (US$ Bn)
TABLE 290 GCC Countries Power Generator For Military Market, by Application, 2023-2030 (US$ Bn)
TABLE 291 South Africa Power Generator For Military Market, by Capacity, 2017-2022 (US$ Bn)
TABLE 292 South Africa Power Generator For Military Market, by Capacity, 2023-2030 (US$ Bn)
TABLE 293 South Africa Power Generator For Military Market, by Output Type, 2017-2022 (US$ Bn)
TABLE 294 South Africa Power Generator For Military Market, by Output Type, 2023-2030 (US$ Bn)
TABLE 295 South Africa Power Generator For Military Market, by Fuel Type, 2017-2022 (US$ Bn)
TABLE 296 South Africa Power Generator For Military Market, by Fuel Type, 2023-2030 (US$ Bn)
TABLE 297 South Africa Power Generator For Military Market, by Installation Type, 2017-2022 (US$ Bn)
TABLE 298 South Africa Power Generator For Military Market, by Installation Type, 2023-2030 (US$ Bn)
TABLE 299 South Africa Power Generator For Military Market, by Application, 2017-2022 (US$ Bn)
TABLE 300 South Africa Power Generator For Military Market, by Application, 2023-2030 (US$ Bn)
TABLE 301 Rest of Middle East and Africa Power Generator For Military Market, by Capacity, 2017-2022 (US$ Bn)
TABLE 302 Rest of Middle East and Africa Power Generator For Military Market, by Capacity, 2023-2030 (US$ Bn)
TABLE 303 Rest of Middle East and Africa Power Generator For Military Market, by Output Type, 2017-2022 (US$ Bn)
TABLE 304 Rest of Middle East and Africa Power Generator For Military Market, by Output Type, 2023-2030 (US$ Bn)
TABLE 305 Rest of Middle East and Africa Power Generator For Military Market, by Fuel Type, 2017-2022 (US$ Bn)
TABLE 306 Rest of Middle East and Africa Power Generator For Military Market, by Fuel Type, 2023-2030 (US$ Bn)
TABLE 307 Rest of Middle East & Africa Power Generator For Military Market, by Installation Type, 2017-2022 (US$ Bn)
TABLE 308 Rest of Middle East & Africa Power Generator For Military Market, by Installation Type, 2023-2030 (US$ Bn)
TABLE 309 Rest of Middle East & Africa Power Generator For Military Market, by Application, 2017-2022 (US$ Bn)
TABLE 310 Rest of Middle East & Africa Power Generator For Military Market, by Application, 2023-2030 (US$ Bn)

Frequently Asked Questions

What is the current size of the global power generator for the military market?

The global power generator for the military market was valued at USD 1.1 Billion in 2022.

What is the expected growth rate of the power generator for the military market between 2023 and 2030?

The power generator for the military market is expected to grow at a CAGR of 3.80% between 2023 and 2030, reaching USD 1.4 Billion in 2030.

Which segment is leading the market share in terms of capacity?

Up to 60 KW is the leading segment by capacity, holding over 43% share in terms of value in 2022.

Which output type segment governs the demand for power generators for the military in the world?

The AC segment governs the demand for power generators for the military in the world, holding a massive share of over 80% in 2022.

Which segment is expected to post the highest share during the forecast period?

The diesel segment is expected to post the highest share during the forecast period.

Which installation type segment governs the demand for power generators for the military in the world?

The portable segment governs the demand for power generators for the military in the world, holding a massive share of over 38% in 2022.

Which application segment governs the demand for power generators for the military in the world?

The field hospitals segment governs the demand for power generators for the military in the world, holding a massive share of over 87% in 2022.

Which region is fueling the growth of power generators for the military industry?

North America is fueling the growth of the power generators for the military industry, with over one-third share in 2022.

Who are the major players in the global power generators for the military market?

The top players include Caterpillar Inc., Cummins Inc., Rolls-Royce Holdings plc, Harrington Generators International, HIMOINSA, Teknel SRL, VÝVOJ Martin, GRUPEL S.A., HITZINGER GmbH, Ascot Industrial S.r.l., Fischer Panda GmbH, GREEN POWER SYSTEMS S.r.l., Kirloskar Oil Engines Ltd., Kohler Co., and Ausonia S.r.l. among other domestic and global players.

What are the major market drivers of power generators for the military industry?

Technological improvement of generators, including the creation of compact tactical power generators and a surge in military spending, are the major market drivers.

What are the major market restraints of the power generators for the military industry?

The strict emission restrictions for diesel engines and alternate backup power sources are the major market restraints.

What are the major market opportunities for power generators for the military industry?

The rising use of hybrid generators and the development and use of DRASH tent systems are the major opportunities in the power generators for the military industry.

Gas Engines Market

Published:
Report ID: 6044

Air Compressor Market

Published:
Report ID: 2818

Solar Photovoltaic (PV) Market

Published:
Report ID: 6195

Gas Turbine Electrical Power Generation Market

Published:
Report ID: 6216

Home Energy Management Systems (HEMS) Market

Published:
Report ID: 7082

3D Printing in Oil and Gas Market

Published:
Report ID: 31968

Lithium-Ion Battery Binders Market

Published:
Report ID: 19637

Wind Turbine Operations And Maintenance Market

Published:
Report ID: 19534

Digital Substations Market

Published:
Report ID: 18400

Medium and High Power Electric Motors Market

Published:
Report ID: 6631

Global Horizontal Directional Drilling (HDD) Market

Published:
Report ID: 12513

Industrial Biomass Boiler Market

Published:
Report ID: 6791

Purchase Options

$2999
Delivery Format: Excel.
$4999
Designed for the individual purchaser.
$6999
Users located at a single corporate site or regional office.
$7999
Allowed for unlimited sharing globally within one company.
Smallform of Sample request

Have a question?

User Profile

Don’t settle for less – trust Mitul to help you find the best solution.

Report delivery within 24 to 48 hours

– Other Info –

What people say?-

User Review

I am very impressed with the information in this report. The author clearly did their research when they came up with this product and it has already given me a lot of ideas.

Jana Schmidt
CEDAR CX Technologies

– Connect with us –

Phone

+91 6232 49 3207


support

24/7 Research Support


sales@credenceresearch.com

– Research Methodology –

Going beyond the basics: advanced techniques in research methodology

– Trusted By –

Pepshi, LG, Nestle
Motorola, Honeywell, Johnson and johnson
LG Chem, SIEMENS, Pfizer
Unilever, Samsonite, QIAGEN