C-Arms Market Overview:
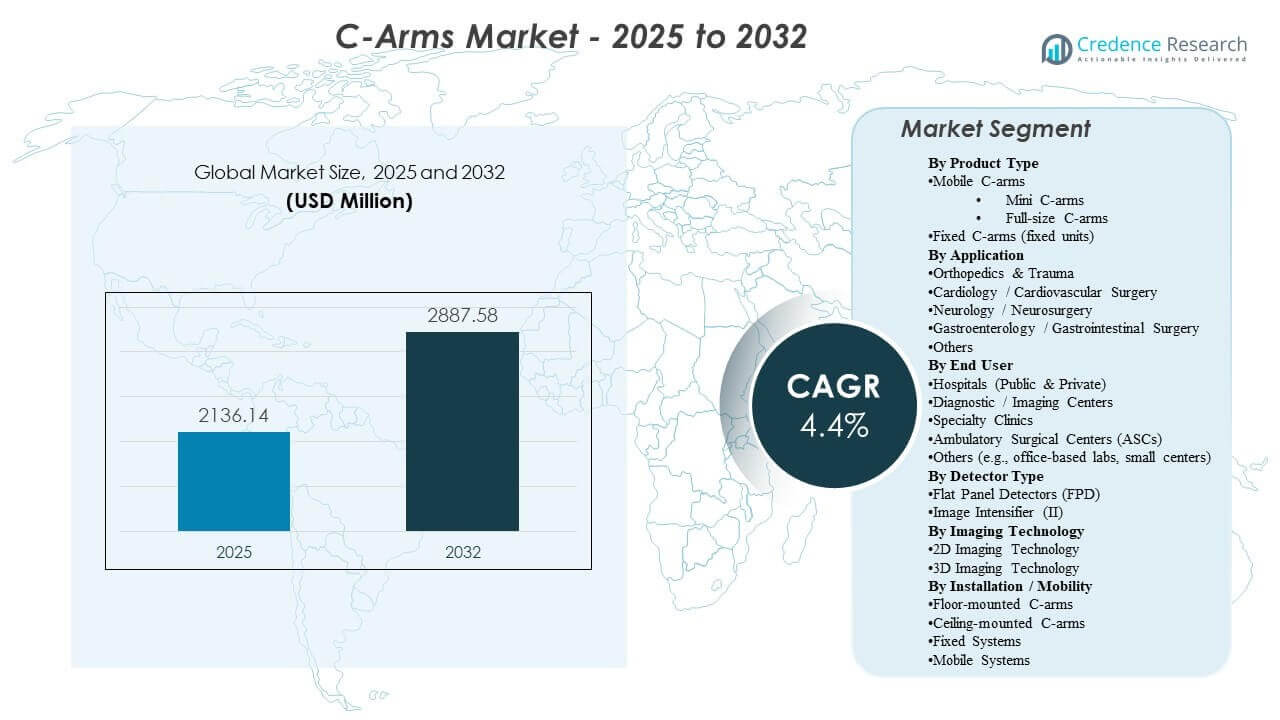
The global C-Arms Market size was estimated at USD 2,136.14 million in 2025 and is expected to reach USD 2,887.58 million by 2032, growing at a CAGR of 4.4% from 2025 to 2032. Growth is primarily driven by sustained expansion in minimally invasive and image-guided procedures across orthopedic, cardiovascular, and pain workflows, where intraoperative visualization improves precision and reduces rework. Demand is further supported by continued modernization of surgical imaging infrastructure, including upgrades from legacy fleets and wider adoption of workflow-optimized mobile systems across hospitals and ambulatory settings.
| REPORT ATTRIBUTE |
DETAILS |
| Historical Period |
2020-2024 |
| Base Year |
2025 |
| Forecast Period |
2026-2032 |
| C-Arms Market Size 2025 |
USD 2,136.14 million |
| C-Arms Market, CAGR |
4.4% |
| C-Arms Market Size 2032 |
USD 2,887.58 million |
Key Market Trends & Insights
- North America accounted for 52.90% in 2025, supported by a large installed base, higher capital intensity, and faster replacement and upgrade cycles.
- Europe represented 20.80% in 2025, reflecting steady demand from mature hospital systems and structured procurement for imaging modernization.
- Mobile C-arms accounted for the largest share of 74.20% in 2025, indicating that flexible deployment and multi-room utilization remain the dominant buying logic.
- Hospitals (Public & Private) held 62.80% in 2025, reinforcing hospitals as the primary site of placement due to breadth of surgical case mix and complexity.
- Orthopedics & Trauma led with 32.40% in 2025, reflecting high fluoroscopy utilization across fracture fixation, joint, and trauma interventions.
Segment Analysis
The C-arms market is shaped by a combination of procedure volume growth and technology refresh cycles, with buyers prioritizing consistent image quality, dose management, and faster room turnover. Procurement decisions increasingly focus on systems that reduce positioning time, support repeatable workflows, and integrate smoothly into operating room processes. Serviceability, uptime, and predictable total cost of ownership remain central evaluation criteria, particularly for high-utilization environments.
Across end users, hospitals continue to anchor demand due to higher-acuity caseloads and multi-specialty utilization, but outpatient migration is steadily expanding the opportunity set in ambulatory facilities and specialty clinics. As providers pursue productivity and standardization, vendors are emphasizing workflow automation, configurable platforms, and upgrade pathways that extend system life and improve clinical versatility without requiring full replacement.
Access crucial information at unmatched prices!
Request your sample report today & start making informed decisions powered by Credence Research Inc.!
Download Sample
By Product Type Insights
Mobile C-arms accounted for the largest share of 74.20% in 2025. This leadership is supported by their flexibility to serve multiple rooms and departments, enabling higher utilization versus fixed installations. Mobile configurations also align with throughput-driven operating rooms where rapid positioning and repeatable workflows reduce procedure time and staff burden. In addition, mobile platforms are often favored in settings balancing capex constraints with broad procedural coverage, making them the most practical choice across a wide range of facilities.
By Application Insights
Orthopedics & Trauma accounted for the largest share of 32.40% in 2025. The segment leads because orthopedic and trauma procedures commonly require real-time imaging for alignment, fixation, and verification during complex interventions. High procedural frequency and emergency-case dependency create consistent utilization of C-arms in this setting. The breadth of orthopedic workflows also supports recurring upgrades as providers seek better image clarity, faster setup, and dose-optimized protocols.
By End User Insights
Hospitals (Public & Private) accounted for the largest share of 62.80% in 2025. Hospitals lead due to their broad surgical service lines, higher-acuity patient loads, and continuous demand across specialties that rely on intraoperative imaging. Procurement in hospitals also reflects a stronger emphasis on interoperability, governance, and service coverage to protect uptime. Replacement cycles are sustained by high utilization rates and ongoing modernization of imaging fleets across operating rooms, emergency, and interventional environments.
By Detector Insights
Flat panel detectors lead adoption in many new procurements due to their strong image performance and workflow efficiency for demanding procedures. Buyer preference is influenced by dose-management capabilities and consistency of visualization across a wide range of clinical use cases. However, image intensifier systems remain present in cost-sensitive purchases and legacy fleets, particularly where budgets prioritize basic fluoroscopy functionality. As a result, detector choice is often a function of case mix, facility budget, and upgrade timing.
By Technology Insights
2D imaging technology remains the most widely used approach across routine intraoperative workflows because it fits the needs of high-volume procedures and supports standardized operating room protocols. 3D imaging adoption is strongest where advanced visualization materially improves outcomes, such as complex orthopedic, spine, and interventional workflows. Capital allocation decisions often weigh incremental clinical benefit against system cost and infrastructure readiness. Over time, workflow automation and navigation-ready configurations are expected to strengthen the role of advanced imaging in higher-acuity environments.
By Installation / Mobility (Model) Insights
Mobile systems continue to see strong preference because they maximize deployment flexibility and enable multi-room coverage without major infrastructure changes. Fixed and mounted configurations are typically selected in specialized suites where workflow design, space planning, and high procedural intensity justify dedicated installations. Ceiling- and floor-mounted approaches are influenced by facility layout, sterility considerations, and the need to reduce clutter in complex procedure rooms. Overall, model choice reflects a balance between utilization intensity, infrastructure constraints, and the facility’s long-term service line strategy.
C-Arms Market Drivers
Expansion of minimally invasive and image-guided procedures
Minimally invasive techniques rely on real-time visualization to improve accuracy and reduce repeat interventions. As procedural volumes expand across orthopedics, cardiovascular care, and pain management, demand for intraoperative imaging remains structurally supported. Providers also pursue workflow reliability to reduce time variability in operating rooms. This reinforces replacement and upgrade activity across installed C-arm fleets. In addition, hospitals increasingly standardize imaging protocols across service lines to improve consistency and reduce operator variability. As case complexity rises, demand strengthens for systems that deliver stable image quality and dose-optimized performance across longer procedures.
- For instance, Ziehm’s Vision RFD 3D mobile C-arm has demonstrated substantially lower radiation exposure than the Medtronic O‑arm O2 in cervical 3D scans while maintaining sufficient image quality for intraoperative control, supporting ALARA-compliant minimally invasive spine workflows.
Modernization and replacement of aging imaging fleets
Many facilities operate mixed fleets with varying performance levels and service profiles. Replacement cycles are driven by the need for improved image clarity, dose-management features, and higher uptime expectations. Standardization across rooms and sites further encourages procurement of consistent platforms. Service contracts and lifecycle economics play a significant role in modernization decisions. Facilities also prioritize equipment that reduces unplanned downtime and supports predictable maintenance planning, especially in high-utilization operating rooms. Upgrades are often justified by measurable workflow gains, such as faster positioning, fewer repeats, and improved clinical throughput.
Hospital throughput and productivity requirements
High-volume surgical settings prioritize systems that reduce setup time and improve positioning repeatability. Workflow optimization improves scheduling reliability and increases room utilization. These operational priorities create demand for configurations that streamline imaging steps and reduce staff workload. Productivity-driven procurement supports steady demand even in constrained budget environments. Hospitals increasingly evaluate C-arms based on total procedure time impact, including repositioning frequency and ease of sterile workflow management. As staffing shortages persist, demand rises for systems that simplify operation and reduce dependency on highly specialized imaging personnel.
Outpatient migration and distributed care delivery
A rising share of procedures is shifting toward ambulatory settings and specialty clinics, expanding the addressable market beyond large hospitals. These sites typically prioritize compact footprints, ease of use, and cost-efficient ownership models. The distributed nature of care increases demand for flexible, mobile imaging solutions. Vendors that align product configurations to outpatient workflows gain an advantage. ASCs and specialty clinics also prefer systems with fast setup and intuitive controls to support rapid room turnover with lean staffing. Financing, service bundles, and upgrade pathways are becoming key differentiators as outpatient providers seek predictable costs and reliable uptime.
- For instance, GE HealthCare’s OEC One CFD integrates a 4K display and control panel on a single all‑in‑one mobile C‑arm with a five‑minute standby power feature, allowing quick transports between ambulatory surgery rooms without data loss and supporting flexible deployment in outpatient workflows.
C-Arms Market Challenges
Budget constraints and capital procurement cycles continue to influence purchase timing and configuration choices. Facilities often prioritize essential upgrades, which can delay adoption of higher-end systems unless clinical value is clearly established. In addition, long tender cycles and approval requirements can slow decision-making, particularly in public systems. These factors create variability in annual demand despite stable long-term fundamentals.
- For instance, in the Government of Maharashtra’s PPP radiology program, bids for CT/MRI centers were structured in three hospital clusters under a single‑stage process with bid validity of at least 180 days, leading to elongated decision cycles before equipment awards were finalized.
Operational complexity and service dependency also pose challenges. Downtime risk, parts availability, and service responsiveness can materially affect the value delivered by imaging platforms. Facilities with limited technical staff may struggle to maintain consistent performance without robust vendor support. As a result, buyers increasingly scrutinize total cost of ownership, service coverage, and lifecycle guarantees.
C-Arms Market Trends and Opportunities
Workflow-centric product positioning is becoming more prominent, with vendors emphasizing features that reduce positioning time, streamline imaging steps, and improve repeatability across procedure types. Systems that support standardized protocols and reduce operator variability are increasingly favored. The shift toward productivity metrics in the operating room creates opportunities for platforms designed around throughput, not only image quality. Upgrade pathways and modular enhancements can also strengthen customer retention over time.
- For instance, Philips’ Precise Position AI-enabled camera-based workflow for CT demonstrated a 54% reduction in average preparation time, from 79.4 seconds with manual positioning to 36.8 seconds, while improving centering accuracy from 68% to 93% in real-world clinical use.
Opportunities are expanding in outpatient and specialty care settings where footprint, ease of use, and economic efficiency drive procurement. Portable and mobile-friendly configurations enable broader utilization across smaller procedure rooms and distributed networks. Vendors can capture growth by aligning product packages to ambulatory budgets and staffing realities. Partnerships that support training, service coverage, and workflow integration can further improve adoption in these environments.
Regional Insights
North America
North America accounted for 52.90% in 2025, supported by strong capital investment capacity, high procedure volumes, and large installed bases across hospitals and ambulatory settings. Procurement is strongly influenced by uptime expectations, service coverage, and workflow standardization across multi-site health systems. Replacement and upgrade cycles are reinforced by productivity targets in operating rooms and the need to maintain consistent imaging performance. Advanced configurations gain traction where clinical complexity and throughput requirements justify higher total ownership cost.
Europe
Europe represented 20.80% in 2025, reflecting steady demand from mature healthcare systems and structured modernization programs. Buyers often prioritize standardization, procurement compliance, and long-term lifecycle value. Replacement cycles remain consistent due to the need to refresh mixed fleets and maintain reliability across high-utilization surgical environments. Demand is sustained across both large hospitals and specialty centers as providers continue to optimize surgical workflows.
Asia Pacific
Asia Pacific held 17.60% in 2025, supported by expanding surgical capacity, growth in procedural volumes, and progressive adoption of image-guided workflows. The region includes a wide mix of procurement profiles, ranging from premium installations in major urban centers to value-focused demand in developing markets. Infrastructure expansion and broader access to surgical services support ongoing equipment placement. Over time, modernization of hospital networks and rising outpatient procedure capacity are expected to reinforce growth momentum.
Latin America
Latin America accounted for 5.20% in 2025, with demand concentrated in larger private networks and major public centers. Procurement is influenced by budget sensitivity, service coverage, and availability of financing models. Replacement timing can be uneven, but targeted modernization programs support periodic demand spikes. Growth opportunities persist where private sector expansion and specialty procedure growth increase need for intraoperative imaging.
Middle East & Africa
Middle East & Africa represented 3.50% in 2025, with demand concentrated in well-funded health systems and urban centers. Procurement is often project-driven, tied to capacity expansion and modernization of surgical infrastructure. Variability across countries remains a key characteristic, influencing market predictability. Opportunities are strongest where hospital investment programs and specialty care expansion increase procedural intensity.
Competitive Landscape
Competition is shaped by portfolio breadth, service footprint, and the ability to deliver consistent workflow outcomes across varied procedure environments. Vendors differentiate through imaging performance, usability, dose-management capabilities, and upgrade pathways that protect lifecycle value. Product positioning increasingly emphasizes productivity in operating rooms, integration readiness, and long-term serviceability. Strong distribution and service networks remain critical to win tenders and sustain installed-base expansion.
GE HealthCare Technologies Inc. is positioned as a leading supplier with broad surgical imaging coverage and an emphasis on platform scalability across diverse clinical use cases. The company’s approach typically aligns product development with workflow efficiency and utilization optimization, supporting adoption in high-volume environments. Its competitive strength is also supported by service infrastructure and the ability to standardize deployments across multi-site networks. This positioning helps maintain relevance across both replacement cycles and new capacity expansion.
The industry research and growth report includes detailed analyses of the competitive landscape of the market and information about key companies, including:
- GE HealthCare Technologies Inc. (GE HealthCare)
- Siemens Healthineers AG (Siemens Healthcare GmbH)
- Koninklijke Philips N.V. (Philips Healthcare)
- Canon Medical Systems Corporation
- Shimadzu Corporation
- Ziehm Imaging GmbH
- FUJIFILM Holdings Corporation (FUJIFILM Corporation)
- Hologic, Inc.
- Genoray Co., Ltd.
- DMS Imaging (DMS Group)
- Eurocolumbus s.r.l.
- Allengers Medical Systems Ltd.
- Trivitron Healthcare
- Mindray Medical International Ltd.
Qualitative and quantitative analysis of companies has been conducted to help clients understand the wider business environment as well as the strengths and weaknesses of key industry players. Data is qualitatively analyzed to categorize companies as pure play, category-focused, industry-focused, and diversified; it is quantitatively analyzed to categorize companies as dominant, leading, strong, tentative, and weak.
Shape Your Report to Specific Countries or Regions & Enjoy 30% Off!
Recent Developments
- In January 2026, Siemens Healthineers launched a next-generation C-arm system featuring 3D imaging and AI enhanced visualization to support minimally invasive surgeries and interventional cardiology procedures.
- In December 2025, GE Healthcare introduced a new C-arm solution positioned for North American markets, focusing on advanced imaging performance for surgical and interventional applications.
- In November 2025, Philips Healthcare (Koninklijke Philips N.V.) announced the installation of its 5,000th Zenition mobile C arm system worldwide, highlighting expanded global access to its surgical imaging platform.
Report Scope
| Report Attribute |
Details |
| Market Name |
C-Arms Market |
| Market size value in 2025 |
USD 2,136.14 million |
| Revenue forecast in 2032 |
USD 2,887.58 million |
| Growth rate (CAGR) |
4.4% (2025–2032) |
| Base year |
2025 |
| Forecast period |
2026–2032 |
| Historical period |
2021–2025 |
| Quantitative units |
USD million |
| Segments covered |
By Product Type; By Application; By End User; By Detector; By Technology; By Installation / Mobility (Model); By Region |
| Regional scope |
North America, Europe, Asia Pacific, Latin America, Middle East & Africa |
| Leading regional share (2025) |
North America: 52.90% |
| Key companies profiled |
14 companies |
| Companies covered |
GE HealthCare, Siemens Healthineers, Philips, Canon Medical, Shimadzu, Ziehm Imaging, FUJIFILM, Hologic, Genoray, DMS Imaging, Eurocolumbus, Allengers, Trivitron, Mindray |
| No. of Pages |
340 |
Segments
- By Product Type
- Mobile C-arms
- Mini C-arms
- Full-size C-arms
- Fixed C-arms (Fixed units)
- By Application
- Orthopedics & Trauma
- Cardiology / Cardiovascular Surgery
- Neurology / Neurosurgery
- Gastroenterology / Gastrointestinal Surgery
- Oncology
- Urology
- Pain Management
- General Surgery
- Dental
- Others
- By End User
- Hospitals (Public & Private)
- Diagnostic / Imaging Centers
- Specialty Clinics
- Ambulatory Surgical Centers (ASCs)
- Others (e.g., office-based labs, small centers)
- By Detector
- Flat Panel Detectors
- Image Intensifier
- By Technology
- 2D Imaging Technology
- 3D Imaging Technology
- By Installation / Mobility (Model)
- Floor-mounted C-arms
- Ceiling-mounted C-arms
- Fixed Systems
- Mobile Systems
- By Region
- North America
- Europe
- Germany
- France
- U.K.
- Italy
- Spain
- Rest of Europe
- Asia Pacific
- China
- Japan
- India
- South Korea
- South-east Asia
- Rest of Asia Pacific
- Latin America
- Brazil
- Argentina
- Rest of Latin America
- Middle East & Africa
- GCC Countries
- South Africa
- Rest of the Middle East and Africa


