
Market Overview:
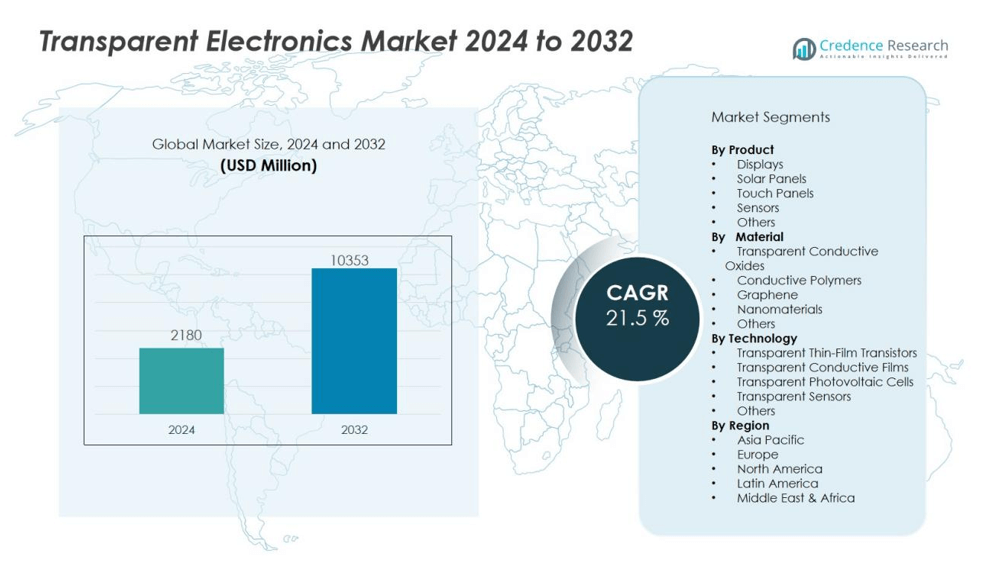
The Transparent electronics market size was valued at US 2180 million in 2024 and is anticipated to reach USD 10353 million by 2032, at a CAGR of 21.5 % during the forecast period (2024-2032).
| REPORT ATTRIBUTE | DETAILS |
|---|---|
| Historical Period | 2020-2023 |
| Base Year | 2024 |
| Forecast Period | 2025-2032 |
| Transparent Electronics Market Size 2024 | US 2180 million |
| Transparent Electronics Market, CAGR | 21.5% |
| Transparent Electronics Market Size 2032 | USD 10353 million |
Growth drivers of the transparent electronics market include rising demand for smart consumer devices, sustainability trends, and the push for lightweight, flexible, and energy-efficient electronics. Transparent conductive oxides, polymers, and graphene are playing a key role in developing next-generation displays and solar panels. The adoption of transparent displays in augmented reality, vehicle windshields, and smart wearables further strengthens market expansion. Increasing R&D investments from major technology firms and government support for renewable energy integration also drive growth opportunities.
Regionally, North America leads the transparent electronics market with strong adoption in automotive, aerospace, and consumer electronics, accounting for nearly 35 percent of global share. Europe follows closely, supported by advanced research programs and demand for sustainable energy technologies. Asia Pacific is expected to register the fastest growth, driven by consumer electronics manufacturing in China, Japan, and South Korea, along with expanding adoption of transparent solar applications. Latin America and the Middle East & Africa show gradual growth with increasing investment in renewable projects.
Market Insights:
- The Transparent electronics market was valued at USD 2180 million in 2024 and is projected to reach USD 10353 million by 2032, recording a CAGR of 21.5 % during the forecast period.
- Growth is fueled by rising demand for smart consumer devices, transparent displays in AR, vehicle windshields, and wearable technologies, supported by innovation in conductive oxides, polymers, and graphene.
- Key challenges include high production costs, complex fabrication methods, and performance limitations such as trade-offs between conductivity, transparency, and long-term durability under environmental stress.
- North America leads with 35 % share, backed by strong adoption in consumer electronics, aerospace, and automotive sectors, while Asia Pacific holds 32 % share and shows the fastest expansion driven by manufacturing dominance in China, Japan, and South Korea.
- Europe maintains 22 % share, supported by sustainability initiatives, green energy policies, and advanced R&D, while Latin America and the Middle East & Africa show gradual growth through renewable energy integration and smart infrastructure projects.
Market Drivers:
Rising Demand for Advanced Consumer Electronics:
The Transparent electronics market is driven by the increasing adoption of next-generation consumer devices. Transparent displays and touch panels are gaining traction in smartphones, tablets, and smart wearables. Manufacturers seek lightweight, flexible, and energy-efficient solutions to meet evolving consumer expectations. It supports innovation in device design while improving product performance and aesthetics.
- For instance, Samsung Electronics showcased its 55-inch transparent OLED display achieving 40% transparency while maintaining full HD resolution, demonstrating a significant leap in balancing clarity with display quality.
Expanding Applications in Automotive and Aerospace:
Automotive and aerospace industries are fueling market growth with the integration of transparent displays and conductive materials. Heads-up displays, smart windows, and augmented windshields are becoming standard in premium vehicles. Aerospace applications use transparent electronics for lightweight control panels and advanced navigation systems. It enhances safety, efficiency, and user experience while reducing material weight.
- For instance, Panasonic Automotive developed a transparent OLED heads-up display that delivers 1000 nits of brightness, significantly improving visibility even in direct sunlight.
Technological Advancements in Materials and Nanotechnology:
Advances in nanomaterials, conductive polymers, and graphene play a key role in market expansion. These materials improve conductivity, durability, and flexibility of transparent components. Their adoption in solar panels and medical devices increases the scope of applications. It positions transparent electronics as a critical enabler of innovation across diverse industries.
Support from Renewable Energy and Sustainability Goals:
Global sustainability efforts create strong demand for transparent solar cells and energy-efficient devices. Governments and corporations are investing in renewable energy technologies that integrate transparent electronics. This includes applications in building-integrated photovoltaics and smart glass systems. It supports environmental goals while creating profitable opportunities for industry players worldwide.
Market Trends:
Integration of Transparent Electronics into Smart Devices and Displays:
The Transparent electronics market is witnessing a strong trend of integration into smart devices and interactive displays. Transparent OLEDs, LCDs, and micro-LED technologies are advancing design possibilities for smartphones, televisions, and wearable devices. Manufacturers are focusing on thinner, flexible, and energy-efficient components that deliver enhanced user experiences. Retail and advertising sectors are adopting transparent display panels for interactive signage and immersive customer engagement. Automotive companies are also embedding transparent electronics into windshields and dashboard systems to improve driver safety and visibility. It demonstrates the expanding role of transparent components in reshaping both consumer electronics and industrial applications.
- For instance, LG Display’s 55EW5P-M 55-inch Transparent OLED signage combines self-emitting pixels with no backlight, achieving 43% transparency while delivering up to 600 nits peak brightness.
Growth in Renewable Energy and Smart Infrastructure Applications:
The Transparent electronics market is also shaped by its rising role in renewable energy solutions and smart infrastructure. Transparent solar cells and building-integrated photovoltaics are being used in windows, facades, and smart glass to improve energy efficiency. Governments and corporations are investing in these technologies to align with sustainability goals and carbon reduction targets. Healthcare and medical device industries are deploying transparent sensors for diagnostics and monitoring, reflecting broader adoption across sectors. Smart cities are incorporating transparent electronics into urban infrastructure to create intelligent, connected environments. It highlights the role of transparent technologies in enabling energy savings, advanced monitoring, and sustainable development across industries.
- For instance, View Inc.’s electrochromic dynamic windows reduced total building energy consumption by 28% compared to single-pane baseline in a Department of Defense demonstration project, delivering 2.4× greater savings than upgrading to low-e glazing.
Market Challenges Analysis:
High Production Costs and Complex Manufacturing Processes:
The Transparent electronics market faces a significant challenge due to high production costs and complex fabrication methods. Advanced materials such as graphene, conductive polymers, and transparent oxides require expensive processes to achieve scalability. Limited yield rates in mass production restrict widespread adoption across industries. Manufacturers struggle to balance performance, durability, and cost efficiency in commercial applications. It creates barriers for small and medium enterprises to enter the market and compete with established players.
Material Limitations and Performance Concerns in End-Use Applications:
Another key challenge lies in material limitations and performance concerns for transparent electronic components. Transparent conductors often face trade-offs between conductivity, transparency, and long-term stability. Their vulnerability to environmental conditions, such as moisture and UV exposure, reduces device lifespan. Integration into automotive, aerospace, and energy systems demands higher durability standards that current materials may not always meet. It slows adoption in critical applications where safety and reliability remain top priorities.
Market Opportunities:
Expanding Role in Renewable Energy and Smart Infrastructure:
The Transparent electronics market presents strong opportunities in renewable energy and sustainable infrastructure development. Transparent solar cells and building-integrated photovoltaics offer dual benefits of energy generation and design flexibility. Governments and private investors are funding projects that integrate smart glass and transparent panels into modern architecture. Healthcare facilities and transportation hubs are adopting transparent electronics to enhance energy efficiency and monitoring capabilities. It strengthens market adoption by aligning with global sustainability and carbon reduction targets.
Adoption in Advanced Consumer Electronics and Automotive Applications:
The Transparent electronics market also benefits from growing demand in consumer electronics and automotive sectors. Transparent displays, touch panels, and sensors are increasingly integrated into smartphones, wearables, and home appliances. Automakers are exploring transparent windshields and heads-up displays to enhance safety and user experience. Smart retail and advertising applications are embracing transparent displays for interactive engagement. It creates profitable opportunities for manufacturers developing flexible, lightweight, and durable transparent components to meet diverse industry needs.
Market Segmentation Analysis:
By Product:
The Transparent electronics market by product includes displays, solar panels, touch panels, and sensors. Displays lead the segment, driven by adoption in smartphones, wearables, and advertising panels. Solar panels are expanding in demand due to the integration of transparent photovoltaics in buildings and infrastructure. Touch panels are widely used in automotive dashboards, smart devices, and consumer electronics. It shows strong potential across industries where transparency and functionality combine to enhance user experience.
- For instance, the EU-funded CitySolar project’s transparent tandem solar cell combines perovskite and organic layers to achieve a record 12.3 percent power conversion efficiency at 30 percent transparency, paving the way for fully functional solar windows.
By Material:
Materials shaping this market include transparent conductive oxides, conductive polymers, and graphene. Transparent conductive oxides remain dominant due to their balance of conductivity and optical clarity. Graphene is gaining momentum for its superior flexibility and durability in next-generation electronics. Conductive polymers are also advancing applications in displays and solar cells. It highlights the role of advanced materials in driving cost efficiency and performance improvements across applications.
By Technology:
Key technologies include transparent thin-film transistors, transparent conductive films, and transparent photovoltaic cells. Transparent thin-film transistors dominate display applications, enabling high-resolution and flexible designs. Transparent conductive films are widely applied in touchscreens, smart windows, and solar cells. Transparent photovoltaic cells are gaining traction in renewable energy integration for buildings and vehicles. It reinforces how technology adoption shapes the versatility and growth of transparent electronics across multiple sectors.
- For instance, LG Display integrated oxide-based transparent thin-film transistors in their 55-inch transparent OLED signage display, achieving a pixel density of 403 pixels per inch (PPI), enhancing image clarity for commercial applications.
Segmentations:
By Product:
- Displays
- Solar Panels
- Touch Panels
- Sensors
- Others
By Material:
- Transparent Conductive Oxides
- Conductive Polymers
- Graphene
- Nanomaterials
- Others
By Technology:
- Transparent Thin-Film Transistors
- Transparent Conductive Films
- Transparent Photovoltaic Cells
- Transparent Sensors
- Others
By Region:
- North America
- U.S.
- Canada
- Mexico
- Europe
- Germany
- France
- U.K.
- Italy
- Spain
- Rest of Europe
- Asia Pacific
- China
- Japan
- India
- South Korea
- South-east Asia
- Rest of Asia Pacific
- Latin America
- Brazil
- Argentina
- Rest of Latin America
- Middle East & Africa
- GCC Countries
- South Africa
- Rest of the Middle East and Africa
Regional Analysis:
North America:
North America holds 35 % share of the Transparent electronics market, supported by strong adoption in advanced industries. The region benefits from early deployment of transparent displays, solar cells, and automotive applications. High investments in R&D from technology giants strengthen innovation in flexible displays and energy-efficient solutions. Aerospace and defense sectors also contribute by adopting transparent control panels and navigation systems. Government initiatives promoting renewable energy integration enhance market growth. It positions North America as a leading hub for transparent electronics development and commercialization.
Asia Pacific:
Asia Pacific accounts for 32 % share of the Transparent electronics market, driven by its strong electronics manufacturing base. Countries like China, Japan, and South Korea dominate in consumer electronics and semiconductor production. Expanding adoption of transparent OLEDs, solar panels, and heads-up displays fuels regional demand. Local companies and research institutes are advancing nanomaterials and transparent conductive polymers. Rising consumer demand for smart devices further accelerates growth in this region. It establishes Asia Pacific as the fastest-growing market with significant opportunities across end-use industries.
Europe:
Europe captures 22 % share of the Transparent electronics market, supported by advanced research and sustainability initiatives. Regional players are developing transparent photovoltaics and integrating them into smart infrastructure projects. Automotive manufacturers adopt transparent windshields and display systems to improve safety and driver experience. EU policies focused on green energy and innovation funding create favorable conditions for growth. Research institutions and industry collaborations strengthen advancements in transparent conductive materials. It enhances Europe’s position as a competitive and innovative region within the global market.
Key Player Analysis:
- 3M Company
- Apple Inc.
- LG Electronics Inc.
- Samsung Electronics Co., Ltd.
- Panasonic Corporation
- Sony Corporation
- Pioneer Corporation
- AU Optronics Corp.
- PolyIC GmbH & Co. KG
- ClearLED Ltd.
- Grafoid Inc.
Competitive Analysis:
The Transparent electronics market is characterized by strong competition among global technology leaders and innovators. Major players include 3M Company, Apple Inc., LG Electronics Inc., Samsung Electronics Co., Ltd., Panasonic Corporation, Sony Corporation, and Pioneer Corporation. These companies focus on advancing transparent displays, solar panels, and conductive films to strengthen their market positions. Strategic investments in research and development help them deliver innovative materials and applications for consumer electronics, automotive, and renewable energy. Partnerships and collaborations with research institutes further accelerate product innovation and commercialization. It reflects a dynamic market where continuous technological progress, brand strength, and product diversification determine competitiveness. Global leaders maintain dominance through large-scale production capabilities, while emerging players compete by offering specialized solutions in flexible and energy-efficient transparent technologies.
Recent Developments:
- In August 2025, LG Electronics Inc. announced new content partnerships at IAA MOBILITY 2025, introducing enhanced in-cabin entertainment and connectivity experiences through its Automotive Content Platform (ACP) powered by webOS, further elevating the digital capabilities of vehicles.
- In August 2025, Samsung Electronics expanded its mobile cloud gaming platform to Europe through new strategic partnerships, resulting in rapid user growth and increased platform adoption.
- In August 2024, Panasonic Connect’s subsidiary Blue Yonder acquired One Network Enterprises, strengthening its position in supply chain management software and analytical solutions.
Market Concentration & Characteristics:
The Transparent electronics market demonstrates moderate concentration, with a mix of established players and emerging innovators shaping competition. Leading companies focus on developing advanced materials such as transparent conductive oxides, polymers, and graphene to support high-performance applications. Startups and research-driven firms play an important role in expanding product portfolios through novel nanomaterials and energy-efficient solutions. It reflects a market characterized by rapid technological advancements, strong R&D investment, and continuous product innovation. Strategic partnerships between manufacturers, research institutes, and government agencies further enhance commercialization. The market also shows high potential in consumer electronics, automotive, aerospace, and renewable energy, making it a dynamic and innovation-driven sector.
Report Coverage:
The research report offers an in-depth analysis based on Product, Material, Technology and Region. It details leading Market players, providing an overview of their business, product offerings, investments, revenue streams, and key applications. Additionally, the report includes insights into the competitive environment, SWOT analysis, current Market trends, as well as the primary drivers and constraints. Furthermore, it discusses various factors that have driven Market expansion in recent years. The report also explores Market dynamics, regulatory scenarios, and technological advancements that are shaping the industry. It assesses the impact of external factors and global economic changes on Market growth. Lastly, it provides strategic recommendations for new entrants and established companies to navigate the complexities of the Market.
Future Outlook:
- The Transparent electronics market will expand with higher adoption in smart consumer devices.
- Transparent OLED and micro-LED technologies will strengthen demand in display applications.
- Automotive integration of transparent windshields and heads-up displays will accelerate industry growth.
- Building-integrated photovoltaics will emerge as a key solution in sustainable construction projects.
- Healthcare applications will grow with transparent sensors and diagnostic devices supporting patient monitoring.
- Continuous material innovation in graphene and polymers will enhance durability and conductivity.
- Strategic collaborations between manufacturers and research institutions will drive faster commercialization of new products.
- Smart retail and advertising will increasingly use transparent displays for interactive consumer engagement.
- Aerospace and defense sectors will adopt transparent systems for advanced navigation and control panels.
- Global sustainability initiatives will create strong opportunities for transparent electronics in renewable energy systems.

Request a Free Sample
Fill in your details and we'll send you a free sample report.
- Sample data tables & charts
- Research methodology
Market Dynamics
Rising Demand for Smart Consumer Devices
The proliferation of transparent displays and touch panels in smartphones, tablets, and wearables is driving market growth, as manufacturers seek lightweight, flexible, and energy-efficient solutions to enhance device design and user experience.
Expansion in Automotive and Aerospace Applications
Automotive and aerospace sectors are increasingly integrating transparent electronics into heads-up displays, smart windows, and control panels, improving safety, efficiency, and user interaction while reducing material weight.
Technological Advancements in Materials
Innovations in transparent conductive oxides, polymers, and graphene are enabling higher conductivity, flexibility, and durability, expanding the range of applications in displays, solar panels, and medical devices.
Support from Renewable Energy and Sustainability Initiatives
Global sustainability goals and government incentives are boosting the adoption of transparent solar cells and building-integrated photovoltaics, creating new opportunities for energy-efficient and eco-friendly electronics.
Growth in Smart Infrastructure and Urban Development
The integration of transparent electronics into smart infrastructure, such as intelligent windows and interactive signage, is supporting the development of connected, energy-efficient urban environments and smart cities.
Need a Custom Version of This Report?
Tailor the scope, geography, or segments to your exact requirements.
- Custom geography or segment scope
- Direct access to our analyst team
Frequently Asked Questions
What is the current market size for the Transparent electronics market, and what is its projected size in 2032?
At what Compound Annual Growth Rate is the Transparent electronics market projected to grow between 2024 and 2032?
What are the primary factors fueling the growth of the Transparent electronics market?
Who are the leading companies in the Transparent electronics market?
Table of Content
Chapter 1 Market Segmentation
- 1.1 Segmentation Framework
- 1.1.1 Product and Service Classification
- 1.1.2 Application and End-Use Classification
- 1.1.3 Technology and Solution Classification
- 1.1.4 Customer and Distribution Channel Classification
- 1.1.5 Geographic Segmentation
- 1.1.6 Market Segment Definitions and Boundaries
- 1.2 By Product
- 1.2.1 Displays
- 1.2.2 Solar Panels
- 1.2.3 Touch Panels
- 1.2.4 Sensors
- 1.2.5 Others
- 1.3 By Material
- 1.3.1 Transparent Conductive Oxides
- 1.3.2 Conductive Polymers
- 1.3.3 Graphene
- 1.3.4 Nanomaterials
- 1.3.5 Others
- 1.4 By Technology
- 1.4.1 Transparent Thin-Film Transistors
- 1.4.2 Transparent Conductive Films
- 1.4.3 Transparent Photovoltaic Cells
- 1.4.4 Transparent Sensors
- 1.4.5 Others
Chapter 2 Introduction
- 2.1 Report Objectives and Scope
- 2.2 Product Definition and Industry Terminology
- 2.3 Market Inclusions and Exclusions
- 2.4 Research Process
- 2.4.1 Primary Research and Expert Interviews
- 2.4.2 Secondary Research and Source Review
- 2.4.3 Top-Down and Bottom-Up Estimation
- 2.4.4 Data Triangulation and Verification
- 2.5 Market Size Measurement Basis
- 2.5.1 2024: USD 2180 million → 2032: USD 10353 million
- 2.6 Historical and Forecast Reference Periods
- 2.6.1 Base Year: 2024
- 2.6.2 Forecast Period: 2024-2032
- 2.7 Research Assumptions and Limitations
Chapter 3 Executive Summary
- 3.1 Market Snapshot and Key Findings
- 3.2 Base-Year Market Size, 2024
- 3.3 Forecast Market Size, 2032
- 3.4 Revenue and Volume Growth Outlook
- 3.5 Key Demand and Supply Indicators
- 3.6 Leading Market Segments
- 3.7 Fastest-Growing Market Opportunities
- 3.8 Regional Performance Highlights
- 3.9 Technology and Industry Transformation
- 3.10 Competitive Landscape Summary
- 3.11 Analyst View and Strategic Implications
Chapter 4 Global Transparent Electronics Market Trends and Developments
- 4.1 Historical Industry Development
- 4.2 Recent Market Trends and Developments
- 4.3 Demand and Customer Behavior Trends
- 4.4 Technology and Product Innovation
- 4.5 Artificial Intelligence, Automation and Digitalization
- 4.6 Local Manufacturing and Supply Chain Realignment
- 4.7 Industry Partnerships, Mergers and Acquisitions
- 4.8 Sustainability and Circular Economy Developments
- 4.9 Government and Private Sector Investment Trends
- 4.10 Emerging Business Models and Commercialization
- 4.11 Industry Developments and Announcements
Chapter 5 Global Transparent Electronics Market Production, Supply and Demand Analysis
- 5.1 Demand Trend and Consumption Analysis
- 5.2 Demand Forecast, 2024-2032
- 5.3 Production and Output Trend
- 5.4 Production and Output Forecast, 2024-2032
- 5.5 Installed Capacity and Capacity Utilization
- 5.6 Company-Wise Production Plants and Statistics
- 5.6.1 Installed Production Capacity
- 5.6.2 Actual Production
- 5.6.3 Planned Capacity and Expansion Targets
- 5.7 Supply Chain Structure and Procurement Trends
- 5.8 Supply-Demand Gap and Bottlenecks
- 5.9 Import Dependence and Sourcing Structure
- 5.10 Contract Manufacturing and Outsourcing
- 5.11 Regional Supply and Demand Concentration
Chapter 6 Global Transparent Electronics Market Pricing Analysis
- 6.1 Pricing Structure and Measurement
- 6.2 Historical Pricing Trends
- 6.3 Pricing Outlook, 2024-2032
- 6.4 Average Selling Price and Unit Economics
- 6.5 Pricing by Product and Market Segment
- 6.6 Geographic Pricing Differences
- 6.7 Key Input, Energy, Labor and Logistics Costs
- 6.8 Contract Pricing and Purchasing Models
- 6.9 Pricing Sensitivity and Competitive Positioning
- 6.10 Price, Margin and Profitability Implications
Chapter 7 Global Transparent Electronics Market Dynamics
- 7.1 Market Growth Drivers
- 7.1.1 Demand-Side Drivers
- 7.1.2 Technology and Innovation Drivers
- 7.1.3 Infrastructure and Investment Drivers
- 7.1.4 Regulatory and Policy Drivers
- 7.2 Market Restraints
- 7.2.1 Cost and Affordability Constraints
- 7.2.2 Technology and Adoption Barriers
- 7.2.3 Supply Chain and Operational Constraints
- 7.3 Market Challenges
- 7.3.1 Competitive Pressure and Margin Erosion
- 7.3.2 Skills, Infrastructure and Implementation Gaps
- 7.4 Emerging Market Opportunities
- 7.5 Market Dynamics Impact and Time-Horizon Assessment
Chapter 8 Global Transparent Electronics Value Chain Analysis
- 8.1 Industry Value Chain Overview
- 8.2 Upstream Suppliers and Critical Inputs
- 8.3 Technology and Component Providers
- 8.4 Manufacturing or Service Delivery
- 8.5 Distribution, Channel Partners and Integrators
- 8.6 Downstream Applications and End Users
- 8.7 Value Addition and Profit Pools
- 8.8 Vertical Integration and Outsourcing
- 8.9 Supplier Concentration and Risk
- 8.10 Supply Chain Localization and Resilience
Chapter 9 Global Transparent Electronics Market Regulations and Policies
- 9.1 Relevant Laws, Standards and Compliance Frameworks
- 9.2 Product, Service, Safety and Quality Requirements
- 9.3 Government Policies, Incentives and Subsidies
- 9.4 Imports, Exports and Trade Barriers
- 9.5 Public Procurement and Local Content Requirements
- 9.6 Environmental and Sustainability Compliance
- 9.7 Upcoming Policy Changes and Market Implications
Chapter 10 Global Transparent Electronics Market Hotspots and Opportunities
- 10.1 Market Opportunity Mapping and Growth Hotspots
- 10.2 High-Growth Applications and Customer Groups
- 10.3 Underserved Markets and White-Space Opportunities
- 10.4 Emerging Technology and Product Opportunities
- 10.5 New Capacity and Investment Hotspots
- 10.6 Market Entry and Expansion Opportunities
- 10.7 Distribution and Partnership Opportunities
- 10.8 Near-Term and Long-Term Commercial Potential
- 10.9 Opportunity Attractiveness and Execution Risks
Chapter 11 Global Transparent Electronics Market Outlook, 2024-2032
- 11.1 Market Size and Analysis
- 11.1.1 Revenue (Market Measurement: 2024: USD 2180 million → 2032: USD 10353 million)
- 11.1.2 Market Volume and Quantity Sold
- 11.1.3 Historical Market Size
- 11.1.4 Base-Year Market Size, 2024
- 11.2 Market Forecast, 2024-2032
- 11.2.1 Revenue Forecast to 2032
- 11.2.2 Volume Forecast to 2032
- 11.2.3 CAGR and Year-on-Year Growth
- 11.2.4 Incremental Revenue Opportunity
- 11.3 Forecast Assumptions and Scenario Analysis
- 11.3.1 Base-Case Forecast
- 11.3.2 Optimistic and Conservative Scenarios
- 11.3.3 Technology, Pricing and Policy Sensitivities
- 11.4 Market Attractiveness and Growth Outlook
Chapter 12 Global Transparent Electronics Market Segmentation and Outlook
- 12.1 Segmentation Summary and Market Shares, 2024
- 12.2 Largest and Fastest-Growing Segments
- 12.3 By Product - Market Size and Forecast, 2024-2032
- 12.3.1 Segment Definition and Scope
- 12.3.2 Historical Market Size
- 12.3.3 Revenue Forecast, 2024-2032
- 12.3.4 Volume Forecast, 2024-2032
- 12.3.5 Base-Year Market Share, 2024
- 12.3.6 Segment CAGR and Growth Drivers
- 12.3.7 Subsegment Market Size and Forecast
- 12.3.7.1 Displays
- 12.3.7.2 Solar Panels
- 12.3.7.3 Touch Panels
- 12.3.7.4 Sensors
- 12.3.7.5 Others
- 12.3.8 Subsegment Pricing and Adoption Trends
- 12.3.9 Leading Suppliers and Competition
- 12.3.10 Regional Demand and Opportunities
- 12.4 By Material - Market Size and Forecast, 2024-2032
- 12.4.1 Segment Definition and Scope
- 12.4.2 Historical Market Size
- 12.4.3 Revenue Forecast, 2024-2032
- 12.4.4 Volume Forecast, 2024-2032
- 12.4.5 Base-Year Market Share, 2024
- 12.4.6 Segment CAGR and Growth Drivers
- 12.4.7 Subsegment Market Size and Forecast
- 12.4.7.1 Transparent Conductive Oxides
- 12.4.7.2 Conductive Polymers
- 12.4.7.3 Graphene
- 12.4.7.4 Nanomaterials
- 12.4.7.5 Others
- 12.4.8 Subsegment Pricing and Adoption Trends
- 12.4.9 Leading Suppliers and Competition
- 12.4.10 Regional Demand and Opportunities
- 12.5 By Technology - Market Size and Forecast, 2024-2032
- 12.5.1 Segment Definition and Scope
- 12.5.2 Historical Market Size
- 12.5.3 Revenue Forecast, 2024-2032
- 12.5.4 Volume Forecast, 2024-2032
- 12.5.5 Base-Year Market Share, 2024
- 12.5.6 Segment CAGR and Growth Drivers
- 12.5.7 Subsegment Market Size and Forecast
- 12.5.7.1 Transparent Thin-Film Transistors
- 12.5.7.2 Transparent Conductive Films
- 12.5.7.3 Transparent Photovoltaic Cells
- 12.5.7.4 Transparent Sensors
- 12.5.7.5 Others
- 12.5.8 Subsegment Pricing and Adoption Trends
- 12.5.9 Leading Suppliers and Competition
- 12.5.10 Regional Demand and Opportunities
- 12.6 Segment Growth Comparison
- 12.7 Segment Attractiveness and Priority Matrix
Chapter 13 Global Transparent Electronics Geographic Market Outlook, 2024-2032
- 13.1 Regional Market Size and Share, 2024
- 13.2 Regional Market Forecast, 2024-2032
- 13.3 Regional Pricing, Production and Demand Differences
- 13.4 North America
- 13.4.1 United States
- 13.4.2 Canada
- 13.4.3 Mexico
- 13.5 Europe
- 13.5.1 Germany
- 13.5.2 France
- 13.5.3 Italy
- 13.5.4 United Kingdom
- 13.5.5 Spain
- 13.5.6 Poland
- 13.5.7 Russia
- 13.5.8 Netherlands
- 13.5.9 Belgium
- 13.5.10 Sweden
- 13.5.11 Denmark
- 13.5.12 Norway
- 13.5.13 Rest of Europe
- 13.6 Asia Pacific
- 13.6.1 China
- 13.6.2 India
- 13.6.3 Japan
- 13.6.4 South Korea
- 13.6.5 Thailand
- 13.6.6 Indonesia
- 13.6.7 Vietnam
- 13.6.8 Malaysia
- 13.6.9 Australia
- 13.6.10 Rest of Asia Pacific
- 13.7 Latin America
- 13.7.1 Brazil
- 13.7.2 Argentina
- 13.7.3 Colombia
- 13.7.4 Chile
- 13.7.5 Rest of Latin America
- 13.8 Middle East
- 13.8.1 Saudi Arabia
- 13.8.2 United Arab Emirates
- 13.8.3 Turkey
- 13.8.4 Israel
- 13.8.5 Iran
- 13.8.6 Rest of the Middle East
- 13.9 Africa
- 13.9.1 South Africa
- 13.9.2 Egypt
- 13.9.3 Nigeria
- 13.9.4 Morocco
- 13.9.5 Rest of Africa
- 13.10 Regional Investment, Policy and Supply Chain Differences
- 13.11 Regional Competitive Landscape
- 13.12 Geographic Growth Hotspots
Chapter 14 Global Transparent Electronics Technology, Innovation and Sustainability Outlook
- 14.1 Technology Landscape and Maturity
- 14.2 Product, Process and Service Innovation
- 14.3 AI, Automation and Digital Tools in the Industry
- 14.4 Technology Adoption and Performance Benchmarking
- 14.5 Innovation Pipeline and R&D Investment
- 14.6 Patent and Intellectual Property Trends
- 14.7 Energy Efficiency and Resource Management
- 14.8 Sustainability, Recycling and Circularity
- 14.9 Technology Roadmap, 2024-2032
- 14.10 Risks of Obsolescence and Technology Substitution
Chapter 15 Global Transparent Electronics Market Key Strategic Imperatives
- 15.1 Growth and Market Entry Priorities
- 15.2 High-Return Products and Segments
- 15.3 Pricing, Profitability and Cost Optimization
- 15.4 Technology Investment and Product Differentiation
- 15.5 Supply Chain Localization and Resilience
- 15.6 Distribution and Customer Acquisition
- 15.7 Partnership, Acquisition and Capacity Strategy
- 15.8 Regional Expansion Priorities
- 15.9 Short-, Medium- and Long-Term Actions
Chapter 16 Competition Outlook
- 16.1 Industry Competition Characteristics
- 16.2 Market Structure and Concentration
- 16.3 Market Share and Competitive Positioning, 2024
- 16.4 Company-Wise Revenue and Product Benchmarking
- 16.5 Production and Service Capacity Benchmarking
- 16.6 Technology, Pricing and Differentiation
- 16.7 Regional Footprint and Distribution Strength
- 16.8 Mergers, Acquisitions and Strategic Alliances
- 16.9 New Entrants and Competitive Threats
- 16.10 Porter's Five Forces and Industry Attractiveness
- 16.11 Competitive Outlook, 2024-2032
Chapter 17 Company Profiles
- 17.1 Company Coverage and Selection Criteria
- 17.2 3M Company
- 17.2.1 Business Description
- 17.2.2 Company Ownership and Geographic Presence
- 17.2.3 Product and Service Portfolio
- 17.2.4 Manufacturing and Operating Footprint
- 17.2.5 Production Capacity and Expansion Plans
- 17.2.6 Financial Performance and Investment
- 17.2.7 Market Share and Competitive Position
- 17.2.8 Technology and Innovation Capabilities
- 17.2.9 Strategic Alliances or Partnerships
- 17.2.10 Recent Developments
- 17.2.11 Growth Strategy and Outlook
- 17.3 Apple Inc.
- 17.4 LG Electronics Inc.
- 17.5 Samsung Electronics Co., Ltd.
- 17.6 Panasonic Corporation
- 17.7 Sony Corporation
- 17.8 Pioneer Corporation
- 17.9 AU Optronics Corp.
- 17.10 PolyIC GmbH & Co. KG
- 17.11 ClearLED Ltd.
- 17.12 Other Relevant Market Participants
Note: Every listed company is profiled on the structure shown under the first company. The company list is preliminary and may change based on research findings, market developments, data availability and client requirements.
Chapter 18 Disclaimer
- 18.1 Research and Forecast Disclaimer
- 18.2 Data Source and Estimation Limitations
Note: The depth of individual sections depends on data availability for this market. Volume, capacity, trade and other unit-based metrics are included where applicable.

