| REPORT ATTRIBUTE |
DETAILS |
| Historical Period |
2020-2023 |
| Base Year |
2024 |
| Forecast Period |
2025-2032 |
| Aerospace Composites Market Size 2024 |
USD 29,434.2 Million |
| Aerospace Composites Market , CAGR |
8.13% |
| Aerospace Composites Market size 2032 |
USD 55,104.5Million |
Market Overview
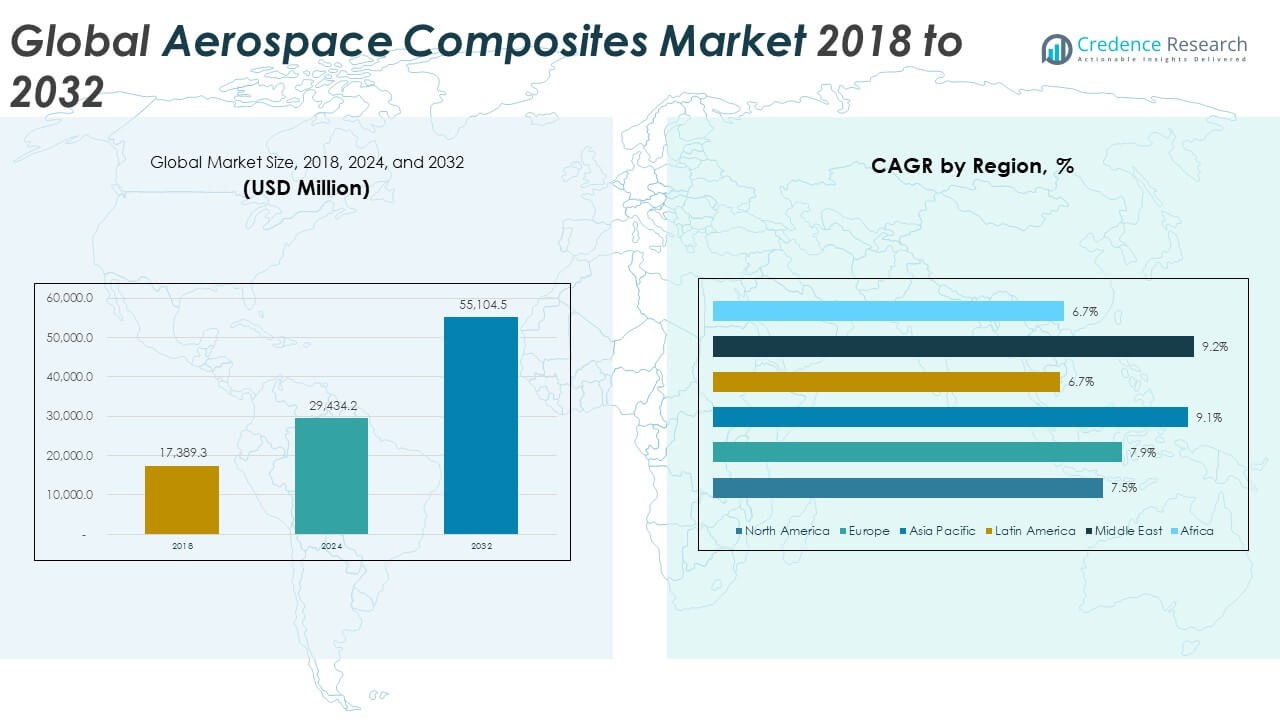
The Global Aerospace Composites Market size was valued at USD 17,389.3 million in 2018 to USD 29,434.2 million in 2024 and is anticipated to reach USD 55,104.5 million by 2032, at a CAGR of 8.13% during the forecast period.
Several key factors are propelling the growth of the aerospace composites market. One of the most prominent is the global push for improved fuel economy and sustainable aviation. As airlines and manufacturers aim to lower operational costs and meet environmental targets, lightweight composite materials are becoming essential in aircraft design. The Boeing 787 Dreamliner, for instance, is composed of roughly 50% composite materials, resulting in notable fuel savings. Technological advancements in manufacturing processes—such as automated fiber placement, out-of-autoclave curing, and 3D printing—are also reducing production times and costs, further encouraging adoption. Moreover, the expansion of the global aircraft fleet, driven by increasing passenger traffic and the replacement of aging aircraft, is boosting demand for new-generation, composite-intensive airframes. The market is also witnessing the rise of smart composites and bio-based materials, aligning with sustainability trends and evolving regulatory standards. However, challenges remain in terms of high raw material costs, complex certification requirements, and a limited number of qualified suppliers, which may restrain market growth to some extent.
Regionally, North America dominates the global aerospace composites market, accounting for the largest share due to the presence of major aerospace OEMs such as Boeing, Lockheed Martin, and Raytheon, along with a highly developed manufacturing and R&D ecosystem. The U.S. continues to lead innovation in advanced composite technologies and holds a strong foothold in both the commercial and defense aviation sectors. Europe follows closely, supported by prominent aircraft manufacturers like Airbus and Rolls-Royce, as well as increasing investments in sustainable composite materials. The region also benefits from strong regulatory support and collaborative research programs focused on lightweight, eco-friendly aviation components. Asia-Pacific, however, is emerging as the fastest-growing region in the market, driven by rapid industrialization, rising defense spending, and the expansion of commercial aviation in countries such as China, India, and Japan. Governments in these countries are investing heavily in domestic aircraft production capabilities and composite material manufacturing infrastructure. Meanwhile, the Middle East, Latin America, and Africa represent smaller but steadily growing markets, supported by ongoing airport expansions, fleet upgrades, and defense modernization initiatives. Overall, regional dynamics reflect a global shift toward more efficient, sustainable, and technologically advanced aerospace manufacturing.
Access crucial information at unmatched prices!
Request your sample report today & start making informed decisions powered by Credence Research Inc.!
Download Sample
Market Insights:
- The Global Aerospace Composites Market was valued at USD 17,389.3 million in 2018 and grew to USD 29,434.2 million in 2024; it is expected to reach USD 55,104.5 million by 2032, expanding at a CAGR of 8.13% during the forecast period.
- The increasing push for sustainable aviation and reduced fuel consumption is driving demand for lightweight composite materials, which now make up nearly 50% of advanced aircraft such as the Boeing 787 Dreamliner.
- Advanced manufacturing technologies like automated fiber placement, out-of-autoclave curing, and 3D printing are accelerating the production of composite components, reducing labor costs and enabling faster development cycles.
- Rising global passenger traffic and the need to replace aging aircraft are prompting OEMs and airlines to adopt composite-intensive designs, boosting market demand across commercial, regional, and defense aviation segments.
- Composites offer superior corrosion resistance, durability, and design flexibility, enabling multifunctional applications in both structural and interior components of next-generation aircraft.
- High raw material costs, complex fabrication processes, and limited supplier capabilities continue to restrict broader adoption, particularly among smaller manufacturers and in cost-sensitive market segments.
- North America leads the market due to its mature aerospace ecosystem and innovation in composite technologies, while Asia-Pacific is emerging as the fastest-growing region, driven by rapid industrialization and expanding domestic aviation infrastructure.
Market Drivers:
Rising Demand for Lightweight Materials to Improve Fuel Efficiency and Reduce Emissions:
The aviation industry faces increasing pressure to lower fuel consumption and carbon emissions. Aircraft manufacturers are turning to composite materials for their superior strength-to-weight ratio, which helps reduce overall aircraft weight and improves fuel efficiency. The Global Aerospace Composites Market is benefiting directly from this shift, with demand growing for carbon fiber reinforced polymers (CFRP), aramid fibers, and other advanced composites. These materials support compliance with international environmental standards and airline operating cost targets. Major commercial programs, such as Boeing’s 787 and Airbus’s A350, incorporate composites in up to 50% of their structure by weight. The push toward sustainable aviation is expected to further accelerate the use of lightweight composites across both new aircraft platforms and retrofitting initiatives.
- For instance, Boeing’s 787 Dreamliner uses 23,000 kg of carbon fiber composites per aircraft, resulting in a 20% reduction in fuel consumption compared to similarly sized conventional aircraft, according to Boeing’s published technical data.
Advancements in Composite Manufacturing Technologies and Process Automation:
Technological innovation plays a critical role in expanding the applicability of aerospace composites. Manufacturers are increasingly adopting automation techniques such as automated fiber placement (AFP), resin transfer molding (RTM), and out-of-autoclave (OOA) processing. These methods reduce production cycle times, improve consistency, and lower labor costs. The Global Aerospace Composites Market is experiencing growth from these process improvements, which enable large-scale production of complex parts without sacrificing structural integrity. Integration of 3D printing and digital design tools also allows for rapid prototyping and customized solutions in both civil and military aviation. These innovations improve manufacturing scalability and open new opportunities for the incorporation of composites in high-performance, multifunctional components.
- For instance, Hexcel has installed a fully automated production line in Austria for its HexPly® M77 resin system, which cures in as little as 1.5 minutes at 160°C.
Increasing Aircraft Production and Fleet Modernization Initiatives Worldwide:
Global passenger traffic is rising steadily, driving up demand for new aircraft and fleet replacement programs. OEMs are ramping up production schedules to meet the backlog of commercial aircraft orders. The Global Aerospace Composites Market is expanding in tandem with this trend, as newer aircraft models incorporate more composite-intensive structures. Airlines are investing in modern fleets to enhance fuel economy, reduce maintenance needs, and meet evolving regulatory requirements. Governments and defense agencies are also upgrading their fleets with lighter, more agile platforms that depend on advanced composite technologies. This widespread demand supports long-term market stability and innovation across commercial, regional, business, and military aviation segments.
Growing Focus on Durability, Corrosion Resistance, and Design Flexibility:
Composites offer high corrosion resistance and excellent fatigue properties compared to traditional materials like aluminum and titanium. Their performance under extreme stress and harsh environments makes them ideal for both structural and interior components in aircraft. The Global Aerospace Composites Market is driven by this versatility, supporting applications ranging from fuselage panels and wing spars to cabin interiors and landing gear doors. These materials also allow for greater design freedom, enabling complex aerodynamic shapes that improve aircraft performance. The ability to combine multiple functions—such as load-bearing and thermal insulation—into a single composite structure further enhances operational efficiency. Such multifunctionality is attracting continuous interest from both commercial and defense stakeholders seeking to optimize aircraft capabilities.
Market Trends:
Integration of Smart Composites with Embedded Sensors for Structural Health Monitoring:
The integration of smart composite materials with embedded sensors is gaining traction across the aerospace industry. These sensors enable real-time structural health monitoring, detecting damage, stress, and fatigue before they compromise safety or performance. The Global Aerospace Composites Market is witnessing increased investment in sensor-integrated laminates and fiber-optic systems for early diagnostics and maintenance optimization. Aircraft operators use these advanced composites to reduce unscheduled maintenance and extend asset lifespans. Smart composites also support condition-based maintenance strategies, helping minimize downtime and lifecycle costs. This trend is shifting traditional MRO models toward data-driven service models and predictive maintenance systems. By embedding intelligence into materials, manufacturers enhance performance while meeting strict reliability and safety requirements.
- For instance, Boeing has reported improvement in maintenance efficiency after integrating embedded fiber optic sensors for real-time structural health monitoring in its aircraft.
Adoption of Recyclable and Bio-Based Composite Materials in Sustainable Aviation:
Sustainability targets are shaping material choices in the aerospace sector, prompting a shift toward recyclable and bio-based composites. The Global Aerospace Composites Market is embracing eco-friendly alternatives such as thermoplastic composites and natural fiber-reinforced polymers that reduce environmental impact. Unlike thermoset materials, thermoplastics are easier to recycle and support closed-loop manufacturing processes. Bio-based resins and hybrid composites are gaining attention for their low carbon footprint and reduced dependency on petroleum-based inputs. Aircraft manufacturers are experimenting with greener materials for both primary structures and cabin interiors. Regulatory support and customer pressure are accelerating the validation of these materials for aerospace-grade performance. This trend aligns with broader sustainability initiatives and next-generation aircraft design strategies.
- For instance, Hexcel’s HexPly® M77 resin system supports rapid processing and is compatible with recycling processes, enabling significant reductions in production waste and supporting closed-loop manufacturing. Hexcel’s automated line further enhances the scalability and sustainability of advanced composite production for aerospace applications.
Expansion of Composite Usage in Urban Air Mobility and Electric Aviation:
Emerging aviation platforms such as electric aircraft and urban air mobility (UAM) vehicles are driving new use cases for composites. These aircraft require lightweight, high-strength structures to achieve efficiency in electric propulsion systems. The Global Aerospace Composites Market is expanding its footprint in this segment, supporting lightweight airframes, rotor blades, battery enclosures, and integrated structural skins. Startups and established OEMs are adopting advanced composites to enhance range, payload capacity, and safety standards in these platforms. Design flexibility also allows for aerodynamic optimization, which is critical for vertical takeoff and landing (VTOL) operations. This trend reflects the aerospace industry’s transition to cleaner, decentralized, and short-haul mobility solutions.
Increased Focus on Automation and Digital Twin Technologies in Composite Fabrication:
Automation and digital twin technologies are transforming how composite parts are designed, manufactured, and validated. Aerospace manufacturers are deploying robotic systems, machine learning algorithms, and digital simulation tools to improve quality control and reduce manual errors. The Global Aerospace Composites Market is integrating these technologies to streamline fabrication processes and enable precise material placement. Digital twins replicate the behavior of composite structures in virtual environments, supporting design optimization and lifecycle assessment. Automation tools such as automated fiber placement (AFP) and advanced inspection systems enhance throughput and consistency. This trend is making composite production more scalable and responsive to complex engineering demands. It supports faster development cycles and improved performance predictability.
Market Challenges Analysis:
High Manufacturing Costs and Complex Processing Requirements Limiting Widespread Adoption:
The high cost of raw materials and complex processing methods continue to limit broader adoption of composites in aerospace applications. Carbon fiber, resin systems, and specialized tooling significantly increase production expenses compared to traditional materials like aluminum or steel. The Global Aerospace Composites Market faces constraints from the capital-intensive nature of composite fabrication, which includes labor-intensive lay-up processes, long curing times, and precise temperature control. These factors increase production lead times and restrict the scalability of composite-based components. Small and mid-sized suppliers struggle to meet the stringent requirements for aerospace-grade parts, further contributing to a fragmented supply chain. Many manufacturers remain hesitant to adopt composites at scale due to cost sensitivities, especially in price-driven commercial aviation segments. Reducing these barriers requires continued investment in automation, alternative materials, and process optimization.
Regulatory Hurdles and Qualification Bottlenecks Slowing Material Innovation:
Strict aerospace regulations and certification protocols pose significant challenges to the adoption of new composite materials and manufacturing techniques. The Global Aerospace Composites Market must adhere to extensive qualification processes that can span years, especially for critical load-bearing structures. Regulatory bodies require comprehensive mechanical, thermal, and fatigue testing under simulated operational conditions before approving new materials. These procedures ensure safety but also slow innovation and increase development timelines. OEMs and suppliers must invest heavily in documentation, traceability, and compliance to meet certification standards. The lack of standardized testing frameworks across regions adds further complexity, requiring tailored validation efforts for different markets. This regulatory burden limits the speed at which new, cost-effective, and sustainable composites can reach commercial viability.
Market Opportunities:
Expansion of Defense Modernization Programs and Space Exploration Initiatives:
Global defense modernization and renewed interest in space exploration present strong opportunities for advanced composite adoption. Governments are investing in lightweight, high-strength materials to enhance performance in fighter jets, unmanned aerial vehicles (UAVs), and next-generation spacecraft. The Global Aerospace Composites Market can benefit from these programs through increased demand for radar-absorbing structures, high-temperature engine components, and lightweight structural elements. Space agencies and private spaceflight companies are also shifting toward composite-based modules to reduce launch weight and improve mission efficiency. These applications require precision engineering and advanced materials that composites can provide. As defense and space budgets rise, composite suppliers are positioned to secure long-term, high-value contracts.
Emergence of Next-Generation Aircraft and Aftermarket Retrofit Demand:
Next-generation aircraft designs focused on sustainability, efficiency, and noise reduction offer new avenues for composite integration. The Global Aerospace Composites Market is well positioned to support aircraft electrification, hybrid propulsion systems, and lightweight cabin interiors. Retrofitting older fleets with composite components for structural reinforcement and weight reduction is gaining momentum across both commercial and military sectors. Airlines are seeking solutions that extend aircraft lifespan while improving operational efficiency. The aftermarket segment offers recurring revenue potential through composite repair kits and service solutions. This creates a strong opportunity for material suppliers and MRO providers to expand their value-added offerings.
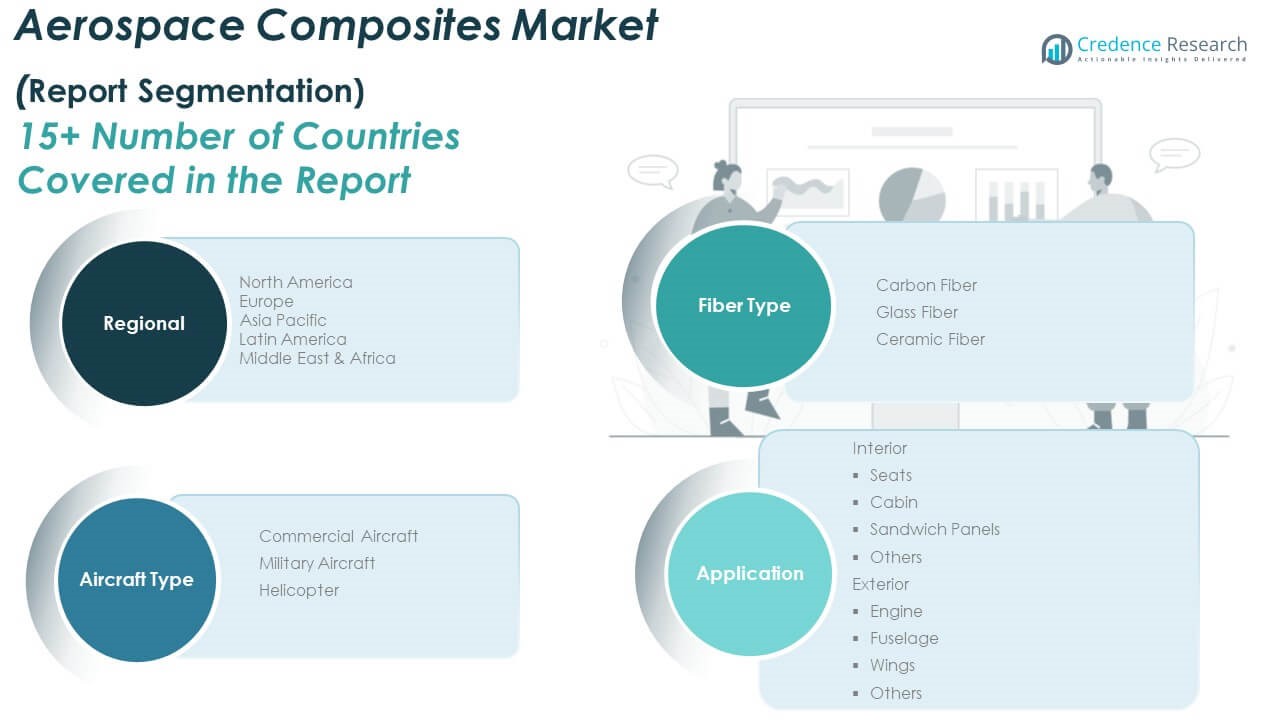
Market Segmentation Analysis:
By Fiber Type
The Global Aerospace Composites Market is categorized into carbon fiber, glass fiber, and ceramic fiber. Carbon fiber holds the largest share due to its high strength-to-weight ratio and excellent fatigue resistance, making it ideal for structural components. Glass fiber is used in secondary structures and interiors where cost-effectiveness is essential. Ceramic fiber is gaining traction in high-temperature applications, especially in engine insulation and thermal protection systems.
- For instance, Toray Industries’ TORAYCA® T1100G carbon fiber achieves both high tensile strength and high modulus, supporting its use in demanding aerospace structural applications. This fiber is widely adopted in high-end aerospace projects for its reliability and advanced mechanical properties.
By Aircraft
The market is segmented into commercial aircraft, military aircraft, and helicopters. Commercial aircraft lead the segment, driven by growing air travel demand and airline fleet expansion. Military aircraft incorporate composites to enhance stealth, durability, and mission performance. Helicopters utilize composites to reduce vibration, improve lift, and extend operational life in challenging environments.
- In helicopters, for example, Sikorsky’s S-97 Raider uses advanced rotor blade composites that enable reduced vibration and improved lift, directly contributing to enhanced operational performance and extended service life in challenging environments.
By Application
Application-wise, the market is divided into interior and exterior segments. Interior applications include seats, cabin structures, sandwich panels, and others, where composites contribute to weight reduction and enhanced comfort. Exterior applications such as engines, fuselages, wings, and other aerodynamic surfaces demand high-performance composites for structural integrity, thermal resistance, and fuel efficiency. The Global Aerospace Composites Market continues to expand across these segments, driven by material innovation and aerospace industry demands.
Segmentation:
By Fiber Type
- Carbon Fiber
- Glass Fiber
- Ceramic Fiber
By Aircraft
- Commercial Aircraft
- Military Aircraft
- Helicopter
By Application
Interior
- Seats
- Cabin
- Sandwich Panels
- Others
Exterior
- Engine
- Fuselage
- Wings
- Others
By Region
North America
Europe
- UK
- France
- Germany
- Italy
- Spain
- Russia
- Rest of Europe
Asia Pacific
- China
- Japan
- South Korea
- India
- Australia
- Southeast Asia
- Rest of Asia Pacific
Latin America
- Brazil
- Argentina
- Rest of Latin America
Middle East
- GCC Countries
- Israel
- Turkey
- Rest of Middle East
Africa
- South Africa
- Egypt
- Rest of Africa
Regional Analysis:
North America
The North America Aerospace Composites Market size was valued at USD 6,028.86 million in 2018 to USD 9,868.03 million in 2024 and is anticipated to reach USD 17,633.45 million by 2032, at a CAGR of 7.5% during the forecast period. North America holds the largest share of the Global Aerospace Composites Market, driven by a mature aerospace industry and the strong presence of major OEMs like Boeing, Lockheed Martin, and Raytheon. It benefits from advanced R&D infrastructure and high adoption of carbon fiber-reinforced composites in both commercial and defense programs. The region leads in the integration of automated manufacturing technologies and smart composites. Increasing investments in lightweight materials for next-generation aircraft continue to fuel growth. Government defense budgets and private-sector innovation sustain high demand for aerospace composites.
Europe
The Europe Aerospace Composites Market size was valued at USD 3,980.41 million in 2018 to USD 6,637.83 million in 2024 and is anticipated to reach USD 12,178.10 million by 2032, at a CAGR of 7.9% during the forecast period. Europe holds a significant share in the Global Aerospace Composites Market, supported by leading players such as Airbus, Rolls-Royce, and Safran. The region is focused on sustainable aviation, with growing investments in recyclable and bio-based composite materials. Collaborative R&D projects and regulatory backing enhance composite innovation and application. European countries are expanding production capabilities for both civil and military aircraft. Strong government support and green aviation goals are shaping the region’s composite landscape.
Asia Pacific
The Asia Pacific Aerospace Composites Market size was valued at USD 4,540.34 million in 2018 to USD 8,155.80 million in 2024 and is anticipated to reach USD 16,443.19 million by 2032, at a CAGR of 9.1% during the forecast period. Asia Pacific is the fastest-growing region in the Global Aerospace Composites Market, led by rising commercial aviation activity in China, India, and Southeast Asia. The region is witnessing major investments in domestic aircraft production and composite manufacturing infrastructure. Governments are prioritizing aerospace self-reliance and expanding defense capabilities. Demand for lightweight, fuel-efficient aircraft is rising due to increasing passenger traffic and growing low-cost carrier fleets. Local OEMs are collaborating with global firms to integrate advanced composite solutions.
Latin America
The Latin America Aerospace Composites Market size was valued at USD 1,043.36 million in 2018 to USD 1,639.91 million in 2024 and is anticipated to reach USD 2,755.23 million by 2032, at a CAGR of 6.7% during the forecast period. Latin America represents a smaller but steadily growing share of the Global Aerospace Composites Market. The region’s growth is supported by commercial fleet upgrades and increasing focus on MRO services. Brazil, as a hub for aircraft manufacturing, contributes significantly to regional demand. Airlines are adopting composites to reduce maintenance costs and improve fuel efficiency. Infrastructure development and regional connectivity initiatives are boosting new aircraft procurement.
Middle East
The Middle East Aerospace Composites Market size was valued at USD 1,295.50 million in 2018 to USD 2,342.96 million in 2024 and is anticipated to reach USD 4,761.03 million by 2032, at a CAGR of 9.2% during the forecast period. The Middle East is showing strong potential in the Global Aerospace Composites Market due to expanding fleets of major airlines and investments in defense modernization. Countries like UAE and Saudi Arabia are enhancing aerospace manufacturing capabilities and adopting high-performance materials. Demand for long-haul, fuel-efficient aircraft is driving the use of composites in wide-body fleets. The region is also attracting partnerships for local composite component production. Rising geopolitical focus on domestic aerospace sectors supports long-term market development.
Africa
The Africa Aerospace Composites Market size was valued at USD 500.81 million in 2018 to USD 789.68 million in 2024 and is anticipated to reach USD 1,333.53 million by 2032, at a CAGR of 6.7% during the forecast period. Africa holds a modest share in the Global Aerospace Composites Market but presents untapped potential. Growing investments in airport infrastructure and regional aviation connectivity are increasing demand for modern aircraft. Several countries are upgrading military fleets, creating opportunities for composite applications. The region is gradually adopting lightweight materials to improve aircraft performance and maintenance efficiency. Market growth is supported by government interest in developing local aerospace industries.
Shape Your Report to Specific Countries or Regions & Enjoy 30% Off!
Key Player Analysis:
- Solvay
- Toray Industries Inc.
- Hexcel Corporation
- Mitsubishi Chemical Group Corporation
- Spirit AeroSystems
- General Dynamics Corporation
- SGL Group
- Koninklijke TenCate NV
- GKN Aerospace
- Collins Aerospace
- FDC Composites Inc.
- Other Key Players
Competitive Analysis:
The Global Aerospace Composites Market is highly competitive, with leading players focusing on product innovation, strategic partnerships, and capacity expansion to maintain market position. Key companies such as Solvay, Toray Industries Inc., Hexcel Corporation, and Mitsubishi Chemical Group dominate through advanced material portfolios and integration with major aerospace OEMs. It reflects strong vertical integration, with players involved in raw material processing, composite fabrication, and component supply. Companies are investing in automated production lines, thermoplastic composite development, and sustainable material alternatives to meet rising performance and regulatory demands. Strategic mergers and acquisitions are strengthening global presence and technological capabilities. The market rewards firms that combine technical expertise with agile supply chain management and long-term contracts. Competitive differentiation depends on material quality, certification standards, and ability to scale for high-volume aerospace programs. The Global Aerospace Composites Market continues to attract new entrants, particularly in niche applications and regional manufacturing hubs.
Recent Developments:
- In June 2025, Spirit AeroSystems shareholders approved the company’s acquisition by Boeing, with the transaction expected to close by mid-2025. This acquisition is set to improve commercial aircraft production efficiency and quality, as Boeing takes direct control of Spirit’s operations related to Boeing aircraft, while Airbus will acquire Spirit’s facilities supplying Airbus components.
- In January 2025, Hexcel Corporation showcased its latest innovations for aerospace applications at Aero India 2025, Bengaluru. The company highlighted new lightweight, high-performance materials such as HexTow® IM9 24K carbon fiber and rapid-curing prepregs like HexPly® M51 and M56 (OOA), which support high-rate automated production and are already being supplied to major Indian and global aerospace programs.
- In June 2023, Solvay and Spirit AeroSystems deepened their research and technology collaboration to accelerate the adoption of composite aerostructures in aerospace. This partnership focuses on advancing composite materials and manufacturing processes for next-generation aircraft.
- In April 2023, Solvay and GKN Aerospace renewed their collaboration agreement to expand the use of thermoplastic composite materials in aerospace structures. This partnership includes joint development of new materials and processes, such as a TPC wing rib and a cost-effective AFP TPC fuselage panel, supporting high-rate manufacturing and primary structure applications.
Market Concentration & Characteristics:
The Global Aerospace Composites Market is moderately concentrated, with a few dominant players controlling a significant share of global production and technology capabilities. It features high entry barriers due to stringent certification requirements, capital-intensive manufacturing, and long development cycles. The market is characterized by long-term supply agreements, close collaboration with OEMs, and high specialization in material science. It demands consistent quality, traceability, and compliance with aerospace-grade standards. Players differentiate through innovation in high-performance fibers, resin systems, and processing techniques. The market favors companies with integrated operations and strong relationships across the aerospace value chain. It continues to evolve with increasing focus on automation, sustainability, and advanced application-specific solutions.
Report Coverage:
The research report offers an in-depth analysis based on by fiber type, aircraft type, and application . It details leading market players, providing an overview of their business, product offerings, investments, revenue streams, and key applications. Additionally, the report includes insights into the competitive environment, SWOT analysis, current market trends, as well as the primary drivers and constraints. Furthermore, it discusses various factors that have driven market expansion in recent years. The report also explores market dynamics, regulatory scenarios, and technological advancements that are shaping the industry. It assesses the impact of external factors and global economic changes on market growth. Lastly, it provides strategic recommendations for new entrants and established companies to navigate the complexities of the market.
Future Outlook:
- Demand for lightweight materials will rise as airlines prioritize fuel efficiency and emissions reduction.
- Growth in electric and hybrid aircraft programs will increase the use of advanced composites.
- Defense modernization initiatives will drive composite adoption in next-generation military platforms.
- Urban air mobility and unmanned aerial systems will create new, high-growth application areas.
- Technological advancements in thermoplastic composites will support faster and more cost-effective production.
- Sustainable composite development, including recyclable and bio-based materials, will gain industry traction.
- Automation in composite manufacturing will enhance production scalability and reduce labor dependency.
- Strategic collaborations between OEMs and material suppliers will strengthen integrated supply chains.
- Emerging markets, particularly in Asia Pacific and the Middle East, will contribute significantly to demand.
- Regulatory harmonization and material certification improvements will accelerate the commercialization of novel composites.


