
Crude Oil Carriers Market Overview:
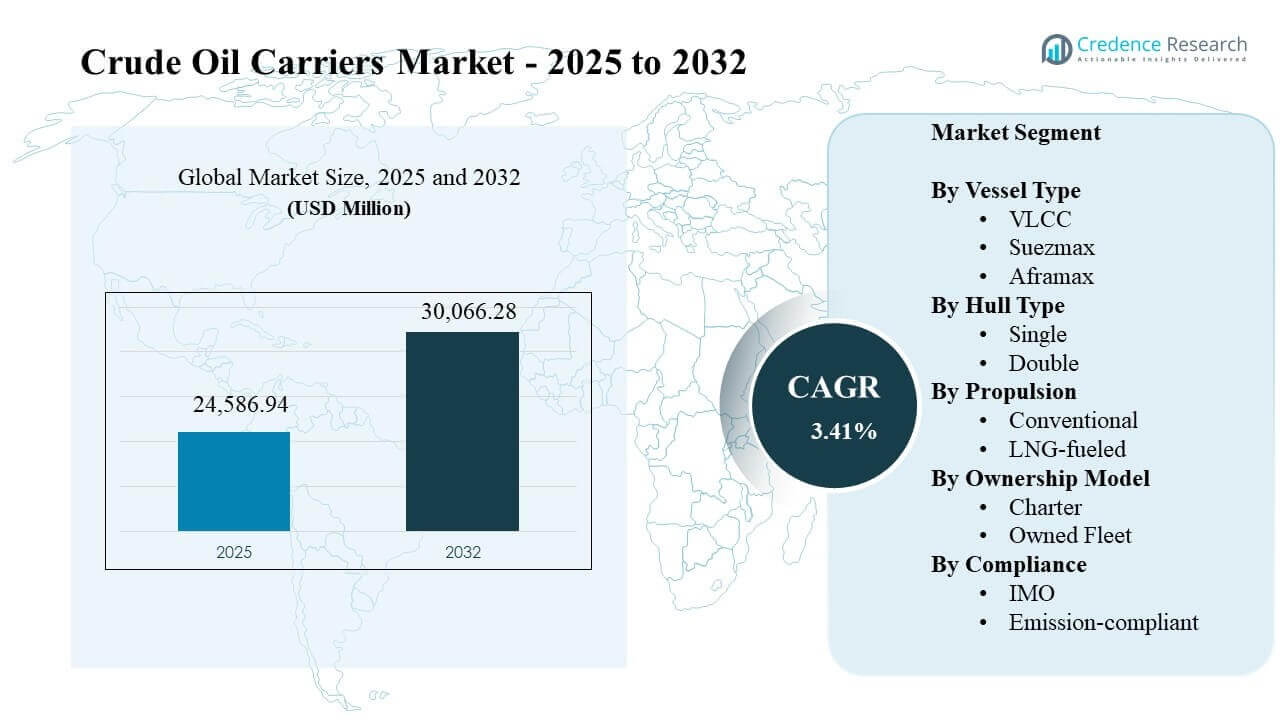
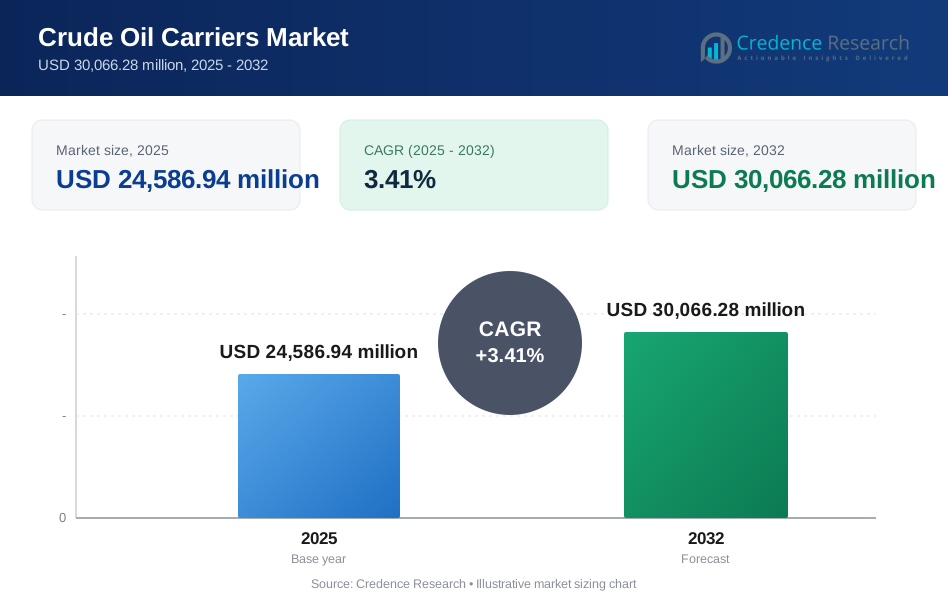
The global Crude Oil Carriers Market size was estimated at USD 24,586.94 million in 2025 and is expected to reach USD 30,066.28 million by 2032, growing at a CAGR of 3.41% from 2025 to 2032. Demand is being shaped by shifting crude trade routes and the continued need for reliable long-haul transportation capacity that can flex with refinery throughput, export availability, and inventory cycles. Fleet modernization and compliance-led upgrades are reinforcing replacement demand, with owners prioritizing operating efficiency, charterer acceptance, and lifecycle resilience across major tanker classes.
| REPORT ATTRIBUTE | DETAILS |
|---|---|
| Historical Period | 2020-2024 |
| Base Year | 2025 |
| Forecast Period | 2026-2032 |
| Crude Oil Carriers Market Size 2025 | USD 24,586.94 million |
| Crude Oil Carriers Market, CAGR | 3.41% |
| Crude Oil Carriers Market Size 2032 | USD 30,066.28 million |
Key Market Trends & Insights
- Asia Pacific accounted for 39.6% of 2025 revenue, reflecting sustained crude import dependency and dense refining capacity across major consuming economies.
- Middle East & Africa represented 23.7% of 2025 revenue, supported by export-led crude flows and strong utilization of large crude carriers on long-haul routes.
- VLCC held the leading vessel-type share at 36.8% in 2025, underpinned by scale economics on high-volume trade corridors.
- The market is projected to expand from USD 24,586.94 million (2025) to USD 30,066.28 million (2032), indicating steady fleet demand despite rate cyclicality.
- The market is expected to grow at a 3.41% CAGR (2025–2032), supported by replacement ordering, compliance investments, and evolving trade patterns.
Segment Analysis
Fleet procurement and chartering behavior in crude oil carriers tends to prioritize reliability, vetting acceptance, and fuel-performance economics, which elevates demand for modern tonnage across core tanker sizes. Buyers and charterers increasingly screen vessels for operating efficiency and compliance readiness, pushing owners toward renewal programs and retrofit pathways that improve competitiveness over multi-year cycles. Trade volatility also favors flexible deployment, which supports a mix of large and mid-size tankers depending on route economics, port constraints, and cargo parcel requirements.
Segment momentum is also influenced by propulsion and compliance choices that can reshape total cost of ownership. Conventional propulsion remains widely used across incumbent fleets, but cleaner-fuel readiness and emissions performance are becoming more important in commercial negotiations. Ownership strategies often blend chartering and owned fleets to balance utilization stability, counterparty quality, and exposure to spot-market upside. Across segments, operational discipline and fleet quality increasingly determine access to premium contracts and stronger utilization.
By Vessel Type Insights
VLCC accounted for the largest share of 36.8% in 2025. Scale advantages support VLCC positioning on long-haul, high-volume routes where cargo aggregation aligns with terminal capability and voyage economics. Charterers also value consistent availability of modern VLCC tonnage when supply tightens, which can support utilization and contract quality. Fleet renewal and eco-spec upgrades further strengthen VLCC competitiveness by improving operating efficiency and meeting higher screening expectations.
By Hull Type Insights
Double-hull configurations are structurally favored because safety expectations and spill-risk reduction remain central to tanker specification decisions. Charterer vetting and insurer expectations typically reinforce preference for modern, higher-standard designs, particularly for large crude movements. Owners also benefit from stronger asset marketability when vessels align with prevailing safety norms and inspection outcomes. Over the forecast period, hull design choices are likely to remain closely linked to compliance posture and commercial acceptance.
By Propulsion Insights
Propulsion decisions are increasingly evaluated through the lens of emissions performance, fuel-cost uncertainty, and compliance trajectories. Conventional propulsion continues to dominate legacy fleets due to established infrastructure and operating familiarity. LNG-fueled options gain traction where bunkering access, shipyard availability, and charterer preference support adoption. Over time, owners are expected to weigh propulsion upgrades and newbuild specifications to preserve contract competitiveness and reduce regulatory exposure.
By Ownership Model Insights
Charter-based strategies remain important for aligning capacity with volatile crude flows and shifting route economics. Owned fleets can provide greater deployment control, consistent technical management, and stronger long-term customer positioning when contract coverage is stable. Many operators blend both approaches to balance spot-market earnings potential with downside protection. Financing conditions, fleet age, and counterparty quality continue to influence the preferred operating model.
By Compliance Insights
Compliance requirements continue to shape vessel selection, retrofit planning, and newbuild specifications across crude carrier fleets. IMO-aligned operating practices remain foundational, but higher emissions scrutiny is strengthening demand for vessels that can demonstrate improved efficiency and readiness for tighter requirements. Commercial benefits increasingly accrue to owners that can document compliance performance and support charterer reporting needs. Over the forecast period, compliance positioning is expected to remain a key differentiator in charter negotiations.
Crude Oil Carriers Market Drivers
Evolving crude trade routes and refinery demand centers
Crude flows continue to realign as importing regions adjust sourcing strategies and refiners optimize feedstock selection. These shifts influence voyage length, vessel class selection, and utilization patterns across major trade corridors. Larger parcel movements can support demand for VLCC capacity where terminal infrastructure enables efficient loading and discharge. Route volatility also increases the value of operational flexibility and reliable tonnage availability.
- For instance, Moda Ingleside Energy Center upgraded its crude export system with three 20-inch loading arms capable of pumping 80,000 barrels per hour, and its three deepwater berths can load up to 160,000 barrels per hour concurrently, demonstrating how terminal capability can materially strengthen VLCC handling on long-haul routes.
Fleet renewal and efficiency-led ordering
Owners are increasingly focused on modernizing fleets to improve fuel performance, reduce downtime, and maintain charterer acceptance. Older vessels face higher operating risk and often require more costly maintenance and compliance investments. Renewal strategies can improve lifecycle economics and strengthen positioning in competitive tenders. Newer tonnage also supports more predictable performance outcomes for charterers and cargo interests.
- For instance, Wärtsilä’s Fuel Efficiency Boost retrofit for four Kuwait Oil Tanker Company VLCCs was designed to deliver up to 4% fuel savings, and the pilot installation recorded about 10 to 12 tons per day lower fuel consumption than a sister vessel, with 1,195 tons of fuel saved over a nine-month period.
Compliance pressure and emissions expectations
Tightening regulatory scrutiny and commercial screening standards are reinforcing investments in compliance and efficiency measures. Operators that maintain strong inspection outcomes and transparent compliance practices can access higher-quality employment. Compliance readiness also supports risk management, particularly under volatile fuel prices and changing operational constraints. As requirements evolve, compliance-led differentiation remains a durable growth lever.
Expansion of energy logistics and trading activity
Oil trading, storage optimization, and inventory cycles can expand seaborne movement requirements even when demand growth is moderate. Market participants increasingly use logistics flexibility to manage regional imbalances and pricing differentials. This supports steady demand for crude carrier capacity across different vessel sizes and routes. Over time, trading-driven movement can sustain baseline utilization and support replacement demand.
Crude Oil Carriers Market Challenges
Crude oil carriers operate in a highly cyclical environment where freight rates can swing sharply based on fleet supply, geopolitics, and demand variability. Rate volatility complicates investment timing, charter strategy, and cash-flow planning, particularly for operators with large spot exposure. Regulatory changes also introduce uncertainty, as compliance upgrades and reporting expectations can raise operating costs. Port constraints and route disruptions can further affect vessel class utilization and scheduling efficiency.
Fleet oversupply risk remains a structural challenge when ordering accelerates during strong cycles and deliveries arrive into softer markets. Newbuild lead times can amplify timing mismatches, affecting earnings and asset values. Financing conditions and shipyard pricing can also limit flexibility for mid-sized owners. Competitive pressure intensifies when charterers consolidate cargo programs and raise screening requirements, narrowing access for older or less efficient tonnage.
- For instance, Sovcomflot’s LNG-fueled Aframax crude tankers were engineered to cut CO2emissions by up to 26%, NOx emissions by up to 95% and eliminate SOx and particulate matter emissions, showing how newer high-spec vessels can strengthen charterer acceptance as vetting standards become stricter.
Crude Oil Carriers Market Trends and Opportunities
Fleet strategies increasingly emphasize eco-spec performance, technical reliability, and commercial acceptance as charterers tighten screening standards. This creates opportunities for owners that can modernize fleets, improve fuel performance, and demonstrate consistent inspection outcomes. Contract structures may evolve to reflect emissions-related requirements, which can reward operators with newer tonnage. Over time, operational data and maintenance discipline are likely to become stronger differentiators.
Alternative-fuel readiness and compliance-focused retrofits represent another opportunity set, particularly where owners can align investments with premium employment. LNG-fueled and dual-fuel pathways can improve long-term competitiveness when bunkering access and contract demand support adoption. Digital monitoring and voyage optimization tools also offer measurable operating improvements. These trends collectively strengthen the investment case for higher-quality fleets and differentiated operating models.
- For instance, Hapag-Lloyd reported that its Hamburg Express-class dual-fuel LNG vessels can reduce CO2 emissions by about 15-25%, sulfur dioxide by about 95%, and carbon black by about 95% compared with diesel operation. Digital monitoring and voyage optimization tools also offer measurable operating improvements.
Regional Insights
North America
North America accounted for 15.2% of 2025 revenue, supported by active crude production, export flows, and a large base of trading and logistics activity. Demand is influenced by shifting export destinations and the economics of long-haul routes that can favor larger crude carriers. Operational efficiency and schedule reliability remain critical as cargo programs adjust to pricing differentials and refinery requirements. Fleet quality is central for maintaining contract access and consistent utilization.
Europe
Europe represented 17.1% of 2025 revenue, reflecting the region’s role in tanker ownership, chartering activity, and crude import requirements tied to major refining hubs. Commercial decisions often emphasize vetting performance, compliance readiness, and predictable technical management. Operators with modern fleets and strong inspection outcomes are well positioned for premium employment. Trade reconfiguration continues to shape utilization across vessel classes serving European routes.
Asia Pacific
Asia Pacific led with 39.6% of 2025 revenue, anchored by high crude import dependence and dense refining capacity across key economies. Long-haul sourcing patterns and cargo aggregation dynamics support sustained demand for large crude carriers. Market participants also value flexible access to mid-size tankers depending on port constraints and parcel sizes. Over the forecast period, fleet renewal and efficiency-led procurement remain important for sustaining commercial competitiveness in this region.
Latin America
Latin America held 4.4% of 2025 revenue, with demand shaped by regional production, refinery throughput, and selective export activity. Utilization tends to reflect route economics and the balance between regional movements and long-haul placements. Cost sensitivity can influence charter structures and preferred vessel specifications. Operators with strong regional networks and reliable tonnage can capture stable employment where cargo programs are consistent.
Middle East & Africa
Middle East & Africa accounted for 23.7% of 2025 revenue, driven by export-oriented crude flows and the strategic role of regional loading hubs in global supply. Large-parcel movements support sustained VLCC utilization, with mid-size tankers also used for route flexibility and destination constraints. Compliance positioning and technical reliability remain critical due to charterer scrutiny and high operational intensity. Fleet renewal strategies are likely to remain important as export corridors and compliance expectations evolve.
Competitive Landscape
Competition is shaped by fleet scale, vessel quality, operating discipline, and access to premium chartering relationships. Leading operators focus on modernizing tonnage, optimizing deployment across routes, and balancing spot exposure with contract coverage to manage cyclicality. Differentiation increasingly depends on vetting performance, technical reliability, and compliance readiness, which influence utilization quality and commercial terms. Shipyard-linked players also affect competition by enabling newbuild pipelines and supporting technology upgrades.
MOL competes through fleet management discipline, long-standing commercial relationships, and a portfolio approach that supports stable employment across market cycles. The company’s positioning benefits from consistent technical standards and the ability to align vessel deployment with customer cargo programs. Strong compliance practices and operational reliability can support access to premium employment under tighter screening norms. MOL’s approach typically emphasizes resilience across rate cycles through diversified coverage and disciplined asset strategy.
The industry research and growth report includes detailed analyses of the competitive landscape of the market and information about key companies, including:
- MOL
- NYK Line
- Euronav
- Frontline
- DHT Holdings
- Teekay
- COSCO Shipping
- Samsung HI
- Hyundai HI
- BW Group
Qualitative and quantitative analysis of companies has been conducted to help clients understand the wider business environment as well as the strengths and weaknesses of key industry players. Data is qualitatively analyzed to categorize companies as pure play, category-focused, industry-focused, and diversified; it is quantitatively analyzed to categorize companies as dominant, leading, strong, tentative, and weak.
Recent Developments
- In a March 2026 announcement, Argus Media launched the Argus Crude Tanker Index (ACTI), a new global benchmark designed to measure crude shipping costs in dollars per barrel across 15 major crude trade routes. The launch also introduced separate VLCC, Suezmax, and Aframax indexes, expanding freight price transparency for participants across the crude tanker market.
- In a February 2025 update, Bahri said it expected to add at least 10 modern eco scrubber-fitted VLCCs to its fleet during the first half of 2025 after already adding five VLCCs in 2024. The company also disclosed that Bahri Oil had secured a long-term contract of affreightment with Rongtong Logistics in December, marking its first direct contract of that kind with a Chinese customer.
- In a September 2025 report, Indian Oil Corporation was said to be preparing to buy at least 10 Aframax crude carriers from a joint venture led by Shipping Corporation of India and an Indian shipyard, with Cochin Shipyard mentioned as a possible partner. This planned move highlights a strategic effort to build domestic crude transport capacity and reduce India’s reliance on foreign vessel operators.
- In a November 2025 update, Scorpio Tankers signed letters of intent to build two VLCCs at Hanwha Ocean in South Korea in a deal valued at about $256 million. The order marked Scorpio Tankers’ entry into the crude tanker segment and reflected a strategic shift beyond its traditional product tanker business.
Report Scope
| Report Attribute | Details |
| Market size value in 2025 | USD 24,586.94 million |
| Revenue forecast in 2032 | USD 30,066.28 million |
| Growth rate (CAGR) | 3.41% (2025–2032) |
| Base year | 2025 |
| Forecast period | 2026-2032 |
| Quantitative units | USD million |
| Segments covered | By Vessel Type Outlook: VLCC, Suezmax, Aframax; By Hull Type Outlook: Single, Double; By Propulsion Outlook: Conventional, LNG-fueled; By Ownership Model Outlook: Charter, Owned Fleet; By Compliance Outlook: IMO, Emission-compliant |
| Regional scope | North America, Europe, Asia Pacific, Latin America, Middle East & Africa |
| Key companies profiled | MOL, NYK Line, Euronav, Frontline, DHT Holdings, Teekay, COSCO Shipping, Samsung HI, Hyundai HI, BW Group |
| No. of Pages | 332 |
Segmentation
By Vessel Type
- VLCC
- Suezmax
- Aframax
By Hull Type
- Single
- Double
By Propulsion
- Conventional
- LNG-fueled
By Ownership Model
- Charter
- Owned Fleet
By Compliance
- IMO
- Emission-compliant
By Region
- North America
- U.S.
- Canada
- Mexico
- Europe
- Germany
- France
- U.K.
- Italy
- Spain
- Rest of Europe
- Asia Pacific
- China
- Japan
- India
- South Korea
- South-east Asia
- Rest of Asia Pacific
- Latin America
- Brazil
- Argentina
- Rest of Latin America
- Middle East & Africa
- GCC Countries
- South Africa
- Rest of the Middle East and Africa
Request a Free Sample
Fill in your details and we'll send you a free sample report.
- Sample data tables & charts
- Research methodology
Need a Custom Version of This Report?
Tailor the scope, geography, or segments to your exact requirements.
- Custom geography or segment scope
- Direct access to our analyst team
Frequently Asked Questions
What is the market size and forecast for the Crude Oil Carriers Market?
What is the CAGR for the Crude Oil Carriers Market during 2025–2032?
Which segment is the largest in the Crude Oil Carriers Market?
What factors are driving growth in the Crude Oil Carriers Market?
Who are the leading companies in the Crude Oil Carriers Market?
Which region leads the Crude Oil Carriers Market?
Table of Content
Chapter 1. Report Introduction
- 1.1 Report Description & Purpose
- 1.1.1 Report Title & Market Definition
- 1.1.2 Unique Selling Propositions (USP) & Key Differentiators
- 1.1.3 Value Proposition for Stakeholders
- 1.2 Research Objectives
- 1.2.1 Market Sizing Objectives (Volume & Revenue)
- 1.2.2 Segmentation Objectives
- 1.2.3 Competitive Intelligence Objectives
- 1.2.4 Forecast & Scenario Objectives
- 1.3 Report Scope
- 1.3.1 Crude Oil Carriers Scope – Types & Subtypes Covered
- 1.3.2 Geographic Scope – Regions & Countries Covered
- 1.3.3 Historical Period, Base Year & Forecast Period (2025; forecast to 2032)
- 1.3.4 Inclusions & Exclusions
- 1.4 HS Code & Classification Framework
- 1.5 Currency, Units & Pricing Basis
- 1.6 Target Stakeholders
- 1.7 Limitations & Assumptions
Chapter 2. Executive Summary
- 2.1 Global Crude Oil Carriers Market Snapshot
- 2.1.1 Market Size – Historical (2025) & Forecast (2025-2032) (2025: USD 24,586.94 million → 2032: USD 30,066.28 million)
- 2.1.2 Volume & Revenue – Global Totals
- 2.1.3 Key Market Highlights – Top Five Facts
- 2.2 Crude Oil Carriers Market Segmentation Snapshot
- 2.2.1 Market Split by Region – 2025 vs. 2032
- 2.3 Competitive Snapshot
- 2.3.1 Top 10 Players by Revenue Share – 2025
- 2.3.2 Top 10 Players by Volume Share – 2025
- 2.3.3 Recent Strategic Developments (18-Month Summary)
- 2.4 Key Investment Highlights & Strategic Conclusions
Chapter 3. Crude Oil Carriers Market Dynamics & Industry Analysis
- 3.1 Market Overview & Context
- 3.1.1 Crude Oil Carriers Market Position in the Broader Automotive Value Chain
- 3.1.2 OEM vs. Replacement Market Dynamics
- 3.1.3 Market Maturity & Development Stage by Region
- 3.2 Crude Oil Carriers Market Drivers
- 3.3 Crude Oil Carriers Market Restraints & Challenges
- 3.4 Crude Oil Carriers Market Opportunities
- 3.5 Porter's Five Forces Analysis
- 3.5.1 Threat of New Entrants
- 3.5.2 Bargaining Power of Suppliers
- 3.5.3 Bargaining Power of Buyers
- 3.5.4 Threat of Substitutes
- 3.5.5 Competitive Rivalry – Intensity Assessment
- 3.6 Crude Oil Carriers Value Chain Analysis
- 3.6.1 Upstream – Raw Material/Input Suppliers
- 3.6.1.1 Raw Material/Input 1
- 3.6.1.2 Raw Material/Input 2
- 3.6.1.3 Raw Material/Input 3
- 3.6.2 Midstream – Production/Manufacturing/Service Delivery
- 3.6.2.1 Production/Process Overview
- 3.6.2.2 Key Facility Locations & Capacity by Manufacturer
- 3.6.3 Downstream – Distribution & End Consumer
- 3.6.3.1 Primary Channel – B2B/OEM
- 3.6.3.2 Secondary Channels – Dealer, Retail, Online, Direct
- 3.6.4 Value Chain Profitability Analysis
- 3.6.1 Upstream – Raw Material/Input Suppliers
- 3.7 PESTEL Analysis
- 3.7.1 Political Factors
- 3.7.2 Economic Factors
- 3.7.3 Social Factors
- 3.7.4 Technological Factors
- 3.7.5 Environmental Factors
- 3.7.6 Legal Factors
- 3.8 Crude Oil Carriers Supply Chain Analysis
- 3.8.1 Raw Material/Input Supply Risk Assessment
- 3.8.2 Manufacturing Concentration Risk (Geographic Exposure)
- 3.8.3 Trade Disruption Impact Analysis
- 3.9 Regulatory & Policy Landscape
Note: The regulatory and policy landscape section covers regulations based on their applicability to the market, Crude Oil Carriers category, geography, and scope of the study. Only regulatory frameworks with a material impact on operations, compliance, trade, sustainability, or market access are analyzed in detail.
Chapter 4. Key Investment Pockets & Opportunity Analysis
- 4.1 Crude Oil Carriers Market Attractiveness Analysis
- 4.1.1 By Region – Investment Attractiveness Matrix (Volume × CAGR)
- 4.2 Absolute Revenue Growth Opportunity
- 4.2.1 By Region – Absolute USD Growth Through 2032
- 4.3 Incremental Volume Opportunity
- 4.3.1 By Region – Incremental Volume Through 2032
- 4.3.2 Segment – Incremental Volume
- 4.4 Emerging Submarket Opportunity Deep Dive (Subject to Applicability)
- 4.5 Emerging Market Opportunity Scorecards
- 4.5.1 United States
- 4.5.2 Europe
- 4.5.3 Asia
- 4.5.4 Middle East & Africa
Note: Emerging Market Opportunity Scorecards will be included based on relevance and strategic importance. Regions listed are indicative and may vary depending on data availability and market dynamics.
Chapter 5. Crude Oil Carriers Import-Export Analysis & Trade Flows
- 5.1 Global Trade Overview
- 5.1.1 Global Export Value by Country (2025)
- 5.1.2 Global Export Volume by Country (2025)
- 5.1.3 Global Import Value by Country (2025)
- 5.1.4 Global Import Volume by Country (2025)
- 5.1.5 Net Trade Balance by Country (2025)
- 5.2 Export Analysis – Segment
- 5.2.1 Type 1 (HS Code)
- 5.2.2 Type 2 (HS Code)
- 5.2.3 Type 3 (HS Code)
- 5.2.4 Type 4 (HS Code)
- 5.2.5 Type 5 (HS Code)
- 5.3 Import Analysis – Segment
- 5.3.1 Type 1 (HS Code)
- 5.3.2 Type 2 (HS Code)
- 5.3.3 Type 3 (HS Code)
- 5.3.4 Type 4 (HS Code)
- 5.3.5 Type 5 (HS Code)
- 5.4 Average Unit Trade Prices
- 5.4.1 Average Export Price – Segment & Country
- 5.4.2 Average Import Price – Segment & Source Country
- 5.4.3 Price Trends (2025)
- 5.5 Key Trade Route Analysis
- 5.5.1 Trade Route 1
- 5.5.2 Trade Route 2
- 5.5.3 Trade Route 3
- 5.5.4 Trade Route 4
- 5.5.5 Trade Route 5
- 5.6 Trade Policy Impact Assessment
- 5.6.1 US Anti-Dumping & Section 301 Tariffs
- 5.6.2 EU Customs Union Impact
- 5.6.3 Major Free Trade Agreements
- 5.6.4 USMCA Rules of Origin
Note: Trade policy analysis will be included only where relevant to the Crude Oil Carriers market.
Chapter 6. Competitive Landscape & Company Benchmarking
- 6.1 Crude Oil Carriers Market Concentration & Structure
- 6.1.1 Herfindahl-Hirschman Index (HHI) – vs. 2025
- 6.1.2 Tier 1, Tier 2 & Tier 3 Market Structure
- 6.1.3 Global, Regional & Local Player Dynamics
- 6.2 Crude Oil Carriers Market Share Analysis – 2025
- 6.2.1 Global Revenue Share by Company
- 6.2.2 Global Volume Share by Company
- 6.2.3 Regional Revenue Share
- 6.2.4 Market Share Evolution ( vs. 2025)
- 6.2.5 OEM Segment Share by Company
- 6.2.6 Replacement Segment Share by Company
- 6.3 Production/Delivery Capacity & Facility Analysis
- 6.3.1 Global Installed Capacity
- 6.3.2 Capacity Utilization Rates
- 6.3.3 Production/Output Volume
- 6.3.4 Facility Locations & Capacity Map
- 6.3.5 Planned Capacity Additions
- 6.4 Crude Oil Carriers Competitive Benchmarking Matrix
- 6.4.1 Revenue, Volume, CAGR & Profitability Comparison
- 6.4.2 Channel Revenue Mix
- 6.4.3 Geographic Revenue Exposure
- 6.4.4 R&D Intensity
- 6.4.5 Sustainability Maturity
- 6.5 Strategic Developments in Crude Oil Carriers (Last 24 Months)
- 6.5.1 Mergers, Acquisitions & Divestments
- 6.5.2 New Crude Oil Carriers Launches
- 6.5.3 Facility Expansions
- 6.5.4 Strategic Alliances, Joint Ventures & Partnerships
- 6.5.5 Distribution Expansion & Market Entry
- 6.5.6 Sustainability & ESG Initiatives
- 6.6 Competitive Strategy Mapping
- 6.6.1 Leader, Challenger, Follower & Niche Classification
- 6.6.2 Pricing Strategy Comparison
- 6.6.3 Channel Strategy Matrix
Note: Strategic developments are included based on their materiality and the availability of reliable information.
Chapter 7. Global Crude Oil Carriers Market – By Distribution Channel
- 7.1 Segment Overview
- 7.1.1 Volume & Revenue Split by Channel (2025 & 2032)
- 7.1.2 Channel Mix Evolution (2025-2032)
Chapter 8. Regional Market Analysis – Global Overview
- 8.1 Global Regional Overview
- 8.1.1 Regional Volume Share
- 8.1.2 Regional Revenue Share
- 8.1.3 Regional Volume by Region
- 8.1.4 Regional Revenue by Region
- 8.1.5 Regional Forecast Through 2032
- 8.2 Cross-Regional Segment Analysis
- 8.2.1 By Distribution Channel
- 8.2.2 By Brand/Price Tier
Chapter 9. North America Crude Oil Carriers Market
- 9.1 United States
- 9.2 Canada
- 9.3 Mexico
Chapter 10. Europe Crude Oil Carriers Market
- 10.1 Germany
- 10.2 France
- 10.3 Italy
- 10.4 United Kingdom
- 10.5 Spain
- 10.6 Poland
- 10.7 Russia
- 10.8 Netherlands
- 10.9 Belgium
- 10.10 Sweden
- 10.11 Denmark
- 10.12 Norway
- 10.13 Rest of Europe
Chapter 11. Asia Pacific Crude Oil Carriers Market
- 11.1 China
- 11.2 India
- 11.3 Japan
- 11.4 South Korea
- 11.5 Thailand
- 11.6 Indonesia
- 11.7 Vietnam
- 11.8 Malaysia
- 11.9 Australia
- 11.10 Rest of Asia Pacific
Chapter 12. Latin America Crude Oil Carriers Market
- 12.1 Brazil
- 12.2 Argentina
- 12.3 Colombia
- 12.4 Chile
- 12.5 Rest of Latin America
Chapter 13. Middle East Crude Oil Carriers Market
- 13.1 Saudi Arabia
- 13.2 United Arab Emirates
- 13.3 Turkey
- 13.4 Israel
- 13.5 Iran
- 13.6 Rest of the Middle East
Chapter 14. Africa Crude Oil Carriers Market
- 14.1 South Africa
- 14.2 Egypt
- 14.3 Nigeria
- 14.4 Morocco
- 14.5 Rest of Africa
Chapter 15. Crude Oil Carriers Company Profiles
- 15.1 [Company 01]
- 15.1.1 Company Overview
- 15.1.2 Key Management Personnel
- 15.1.3 Products & Services Portfolio
- 15.1.4 Financial Performance
- 15.1.5 Key Market Focus & Geographic Presence
- 15.1.6 Recent Developments & Strategic Initiatives
Note: The company profile list is preliminary and may change based on research findings, market developments, data availability, and client requirements.
Chapter 16. Appendices
- Appendix A – List of Abbreviations & Acronyms
- Appendix B – Industry Classification Code Reference – Full Series
- Appendix C – Production & Capacity Data Tables
- Appendix D – End-Use & Demand Base Tables
- Appendix E – Consumption & Replacement Rate Assumptions
- Appendix F – ASP Reference Tables
- Appendix G – Manufacturing & Facility Database
- Appendix H – Import-Export Data Tables
- Appendix I – Regulatory Summary Tables
- Appendix J – Primary Research Participant List (Anonymized)
- Appendix K – Primary Research Questionnaire Framework
- Appendix L – Data Sources & Bibliography
- Appendix M – Market Size Divergence & Source Comparison
Chapter 17. Research Methodology
- 17.1 Research Framework & Philosophy
- 17.2 Secondary Research – Sources, Hierarchy & Data Extraction
- 17.3 Data Modeling – Bottom-Up & Top-Down Market Sizing
- 17.4 Primary Research – Stakeholder Framework, LOI & Sample Sizes
- 17.5 Forecast Methodology – Regression, Scenario & Sensitivity Analysis
- 17.6 Quality Control – Four-Layer Validation Framework
- 17.7 Limitations & Standard Assumptions
- 17.8 Disclaimer
