
Cryogenic Vessels Market Overview:
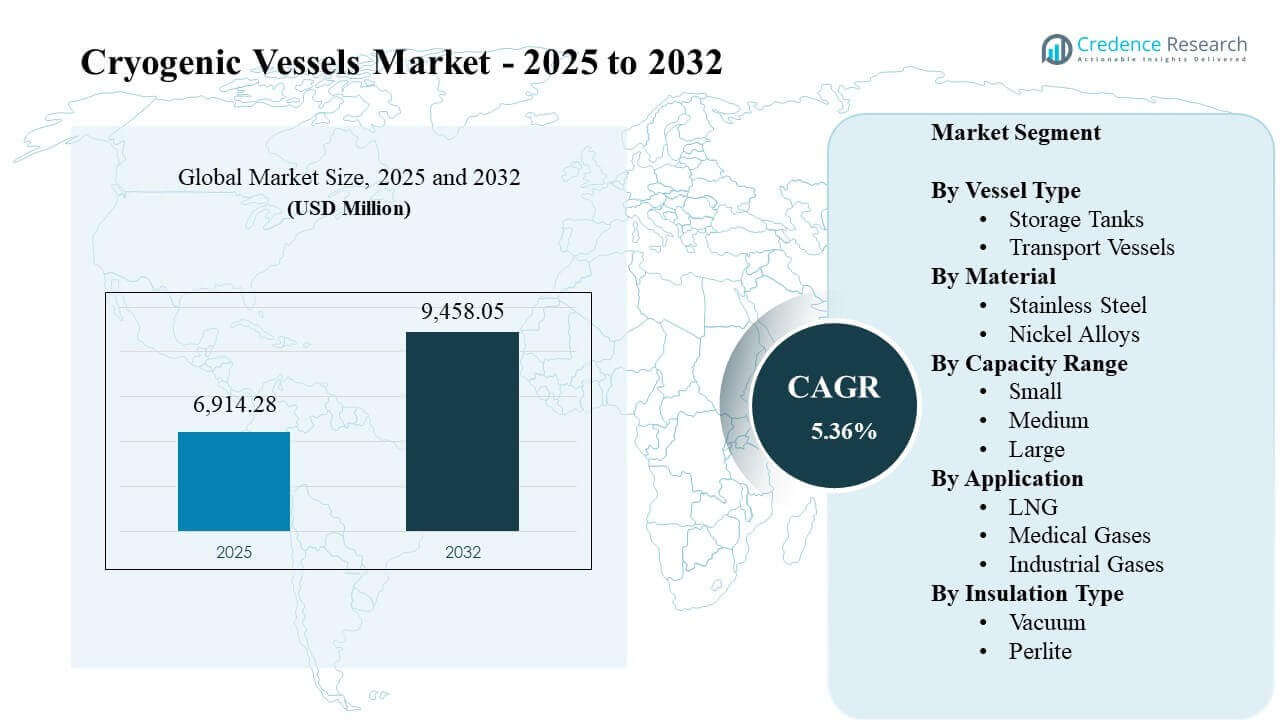
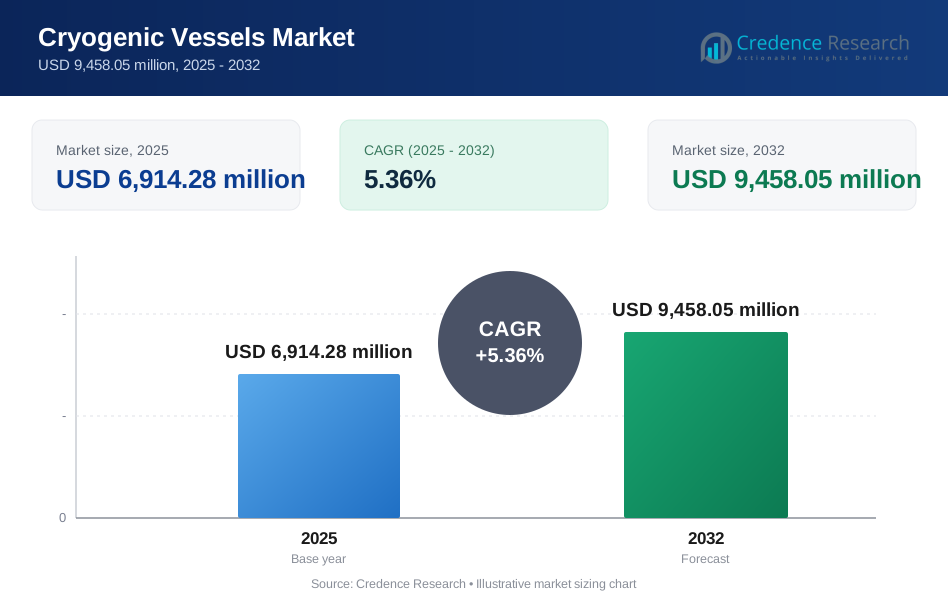
The global Cryogenic Vessels Market size was estimated at USD 6,914.28 million in 2025 and is expected to reach USD 9,458.05 million by 2032, growing at a CAGR of 5.36% from 2025 to 2032. Demand growth is primarily driven by the expansion of LNG and industrial gas supply chains that require safe, low-loss storage and transport of liquefied gases across terminals, production sites, and end-user networks. Cryogenic vessel procurement also benefits from continued capacity additions in Asia Pacific, supported by industrialization and energy infrastructure investment that increases requirements for bulk cryogenic storage, distribution, and downstream handling.
| REPORT ATTRIBUTE | DETAILS |
|---|---|
| Historical Period | 2020-2024 |
| Base Year | 2025 |
| Forecast Period | 2026-2032 |
| Cryogenic Vessels Market Size 2025 | USD 6,914.28 million |
| Cryogenic Vessels Market, CAGR | 5.36% |
| Cryogenic Vessels Market Size 2032 | USD 9,458.05 million |
Key Market Trends & Insights
- The Cryogenic Vessels Market is projected to expand at a CAGR of 5.36% during 2025–2032.
- Asia Pacific accounted for 36.8% of Cryogenic Vessels Market revenue in 2025, supported by LNG and industrial gas infrastructure buildouts.
- LNG held 31.7% share of Cryogenic Vessels Market applications in 2025, reflecting storage and logistics intensity in liquefied gas value chains.
- Steel/stainless-dominant vessel construction represented 46.6% share in 2025, indicating preference for scalable fabrication and durability at cryogenic temperatures.
- Latin America represented 7.4% share of Cryogenic Vessels Market revenue in 2025, reflecting more concentrated project-driven demand.
Segment Analysis
Cryogenic Vessels Market demand is shaped by use cases that prioritize thermal performance, safety compliance, and lifecycle economics across LNG, industrial gases, and medical gases. Storage-heavy purchasing patterns reflect the need to preserve cryogenic liquids with controlled boil-off and consistent availability across distribution networks and end-user sites. Buyers typically evaluate vessel suppliers on proven insulation performance, fabrication quality, testing standards, and delivery reliability for engineered projects.
Procurement decisions also vary by deployment model, with large stationary installations supporting terminals, bulk depots, and production facilities, and transport-oriented assets enabling distribution to industrial and healthcare customers. Material selection remains a cost-performance decision tied to cryogenic toughness, weld integrity, corrosion behavior, and code compliance. Cryogenic Vessels Market growth also tracks regional infrastructure spending, with Asia Pacific demand strengthened by LNG buildouts and broader industrialization.
By Vessel Type Insights
Storage Tanks remain central to Cryogenic Vessels Market demand because stationary storage underpins LNG terminals, bulk industrial gas depots, and healthcare supply continuity. Storage Tanks are commonly favored where low-loss holding, safety systems, and long service life drive total-cost outcomes. Transport Vessels expand with distribution needs for industrial gases and cryogenic logistics that connect production, filling, and end-user consumption points. Vessel qualification and compliance requirements influence fleet replacement cycles and supplier selection across both vessel types.
By Material Insights
Steel/stainless-dominant vessel construction accounted for the largest share of 46.6% in 2025. Steel and stainless-heavy fabrication benefits from scalable manufacturing, strong weldability, and broad code familiarity across large stationary vessels and standardized product lines. Material performance at cryogenic temperatures supports reliability in demanding duty cycles across LNG and industrial gas applications. Nickel Alloys strengthen relevance in more specialized operating envelopes where ultra-low-temperature performance and higher mechanical resilience support long-term safety margins.
By Capacity Range Insights
Large capacity vessels remain critical where bulk storage and terminal-linked requirements dominate Cryogenic Vessels Market deployments. Medium capacity systems align with industrial gas depots, regional distribution points, and site-level storage where footprint and refill logistics must be balanced. Small capacity vessels support hospitals, laboratories, and distributed industrial users that need reliable on-site storage with manageable handling requirements. Capacity selection is influenced by permitting constraints, safety clearances, boil-off tolerance, refill frequency, and operational continuity expectations.
By Application Insights
LNG accounted for the largest share of 31.7% in 2025. LNG-led demand is supported by requirements for bulk storage and distribution across terminals, peak-shaving systems, and downstream supply nodes that depend on engineered cryogenic vessel performance. Medical Gases sustain consistent demand for reliable storage that supports hospital oxygen availability, laboratory workflows, and specialty gas handling needs. Industrial Gases drive recurring vessel demand tied to metals, chemicals, electronics, food processing, and freezing applications that require continuous cryogenic supply.
By Insulation Type Insights
Vacuum insulation remains a preferred approach in many Cryogenic Vessels Market deployments because vacuum systems reduce heat ingress and support tighter boil-off control. Vacuum systems can be attractive where operating costs and product losses materially affect lifecycle economics. Perlite insulation remains relevant in certain stationary configurations where cost, scale, and engineering preferences support proven insulation designs. Insulation selection is guided by allowable loss rates, maintenance access, system reliability, and total installed cost.
Cryogenic Vessels Market Drivers
Expansion of LNG infrastructure and distribution networks
Cryogenic Vessels Market growth is strongly linked to LNG storage and downstream distribution requirements that demand engineered containment at very low temperatures. LNG terminals, satellite storage, and regional depots require reliable vessels that minimize losses and meet strict safety expectations. Cryogenic vessel demand rises as supply chains add capacity and diversify delivery routes. Engineering requirements for large vessels, insulation systems, and compliance documentation support higher-value procurement and long project cycles.
Industrial gas demand and micro-bulk distribution growth
Industrial gases used in manufacturing, metals, chemicals, electronics, and food processing create steady demand for cryogenic storage and transport solutions. Cryogenic Vessels Market purchasing is reinforced by the need for dependable bulk storage, site-level tanks, and distribution assets that support continuous operations. Micro-bulk and distributed delivery models create additional demand for standardized vessel formats and service support. Reliability, safety, and lifecycle performance drive repeat purchasing and replacement cycles.
Healthcare and life sciences dependence on reliable cryogenic storage
Medical gases and laboratory workflows depend on dependable cryogenic vessels that support cold-chain stability and safe on-site storage. Hospitals require consistent oxygen availability and controlled storage conditions that reduce supply disruptions. Laboratories and research facilities depend on cryogenic storage for specialty gases and temperature-sensitive handling. Compliance and safety requirements increase buyer emphasis on qualification, validated performance, and operational safeguards that support long-term reliability.
- For instance, Baker Hughes deployed PT878GC and GC868 flow meters in several UK hospitals on pure-oxygen lines fed from cryogenic tanks, with operating pressure of 10–14 bar and telemetry logged every 1 minute and uploaded every 1–60 minutes, reinforcing how healthcare providers prioritize monitored, interruption-free cryogenic oxygen storage.
Material, fabrication, and compliance requirements that raise replacement demand
Cryogenic Vessels Market demand is supported by stringent fabrication and compliance expectations that encourage upgrades and replacements over time. Buyers evaluate vessel integrity, insulation performance, testing protocols, and long-term safety behavior, which elevates the importance of proven manufacturing and quality systems. New projects and retrofit needs expand demand for engineered designs that meet evolving operational expectations. Total lifecycle economics, including boil-off performance and maintenance, reinforces investment in higher-performing vessel systems.
- For instance, CRYOGAS reports LNG storage tanks ranging from 3,000 liters to 256,000 liters with operating pressure up to 17 bar(g), and it uses stainless steel at lifting lugs, transport saddles, legs, and nozzle openings to extend tank life, highlighting why material selection and fabrication quality influence replacement cycles.
Cryogenic Vessels Market Challenges
Cryogenic Vessels Market adoption faces challenges related to high upfront costs, long project lead times, and stringent compliance requirements. Engineered vessels require specialized fabrication, testing, and documentation that can extend delivery schedules and increase total installed costs. Procurement can be sensitive to project timing, permitting, and infrastructure readiness, which can create uneven order flow. Supply-chain volatility for specialty materials and components can also impact delivery predictability and manufacturing margins.
Cryogenic Vessels Market participants also manage operational challenges tied to safety assurance, installation quality, and lifecycle maintenance. Thermal performance depends on insulation integrity and workmanship, which raises expectations for experienced installers and rigorous commissioning. Operating conditions that include vibration, frequent cycling, and harsh environments can increase maintenance burdens. Buyers may delay replacements when budgets tighten, which can slow near-term demand despite long-term infrastructure needs.
- For instance, Chart Industries states that its 9,000-gallon vertical oxygen-service bulk tank using Composite Super Insulation achieves 50% longer hold time than perlite designs, with published figures of 45 days versus 30 days and losses at MAWP of 1,035 SCFD versus 1,550 SCFD; the same catalog also notes leak testing at 1.1 times MAWP and a 5-year vacuum warranty, showing how measurable thermal and integrity targets directly affect operating reliability and maintenance planning.
Cryogenic Vessels Market Trends and Opportunities
Cryogenic Vessels Market opportunity is expanding through increased focus on loss-control performance and lower boil-off solutions that improve lifecycle economics. Buyers increasingly prioritize designs and insulation approaches that reduce product losses and stabilize operations across storage and distribution nodes. Standardization and modularization also support faster deployment across distributed industrial gas and healthcare use cases. Service-enabled offerings that strengthen uptime and simplify compliance documentation can improve vendor differentiation.
- For instance, Linde states that its hydrogen storage tanks use vacuum insulation with perlite, super insulation, or glass bubbles and deliver a boil-off ratio of 0.25% to 0.95% per day, providing a measurable benchmark for low-loss cryogenic storage performance.
Cryogenic Vessels Market growth prospects also benefit from expanding cryogenic logistics requirements beyond traditional industrial applications. Hydrogen and low-carbon fuel initiatives increase interest in high-performance cryogenic storage systems and transport assets. Micro-bulk distribution and site-level storage models create opportunities for scalable product lines and stronger channel partnerships. Digital monitoring and predictive maintenance can strengthen operational safety and performance assurance in high-utilization environments.
Regional Insights
North America
North America represented 28.4% of Cryogenic Vessels Market revenue in 2025, supported by LNG-linked infrastructure, established industrial gas networks, and a large installed base of storage assets. The United States is a key demand center due to industrial manufacturing intensity and energy logistics needs. Procurement emphasizes compliance readiness, safety performance, and lifecycle economics for bulk storage and distribution. Replacement demand also supports steady purchasing, particularly for assets operating under demanding duty cycles.
Europe
Europe accounted for 21.3% of Cryogenic Vessels Market revenue in 2025, supported by mature industrial gas networks and high standards for safety and compliance. Demand is strengthened by process industries, healthcare requirements, and energy system needs that require reliable cryogenic storage and handling. Engineering discipline and documentation expectations can favor suppliers with proven qualification and delivery performance. Project timing can be uneven, though recurring industrial demand supports steady baseline purchasing.
Asia Pacific
Asia Pacific led the Cryogenic Vessels Market with 36.8% share in 2025, driven by industrialization and major investments in LNG terminals, storage hubs, and downstream distribution. China and India support large-scale demand across industrial gases, manufacturing, and expanding energy infrastructure. Buyers often prioritize scalable manufacturing, fast delivery capability, and robust aftersales support to meet growing deployment needs. Strong infrastructure momentum supports both large stationary vessels and transport-linked assets that expand distribution reach.
Latin America
Latin America represented 7.4% of Cryogenic Vessels Market revenue in 2025, with demand often concentrated in a smaller set of countries and industrial clusters. Brazil and Mexico commonly anchor project-driven requirements tied to industrial gases, energy logistics, and healthcare supply chains. Procurement can be sensitive to capital cycles and project approvals, which can create variability in order flow. Distribution partnerships and service coverage can be important differentiators for suppliers operating across dispersed end users.
Middle East & Africa
Middle East & Africa accounted for 6.1% of Cryogenic Vessels Market revenue in 2025, with demand influenced by large industrial projects and energy-linked infrastructure in key hubs. GCC markets can drive episodic requirements for large storage vessels tied to terminals, processing hubs, and distribution systems. Procurement frequently emphasizes engineered project execution, safety compliance, and lifecycle reliability under demanding operating environments. Broader regional demand remains more uneven outside core industrial clusters.
Competitive Landscape
Cryogenic Vessels Market competition is shaped by engineering capability, fabrication quality, and delivery performance across large projects and standardized product lines. Suppliers differentiate through insulation performance, compliance readiness, safety systems integration, and lifecycle service support. Channel reach and aftersales execution influence competitiveness in micro-bulk and distributed storage formats. Partnerships and project wins in LNG and industrial gas ecosystems can strengthen positioning and backlog stability.
Chart Industries maintains a strong position through engineered cryogenic equipment capabilities and project execution across large storage vessels and distribution formats. Chart Industries strategy often emphasizes scalable manufacturing, portfolio breadth, and delivery reliability for infrastructure-driven deployments. Product availability across bulk and portable formats supports coverage across industrial, medical, and energy-linked applications. Channel arrangements and manufacturing milestones can strengthen Chart Industries reach and reinforce competitiveness in both stationary storage and distribution-linked segments.
The industry research and growth report includes detailed analyses of the competitive landscape of the market and information about key companies, including:
- Chart Industries
- Linde
- Air Products
- Cryofab
- Taylor-Wharton
- INOX India
- Messer
- Worthington
- Kawasaki HI
- IHI
Qualitative and quantitative analysis of companies has been conducted to help clients understand the wider business environment as well as the strengths and weaknesses of key industry players. Data is qualitatively analyzed to categorize companies as pure play, category-focused, industry-focused, and diversified; it is quantitatively analyzed to categorize companies as dominant, leading, strong, tentative, and weak.
Recent Developments
- In July 2025, Alfa Laval completed the acquisition of Fives Energy Cryogenics from the French group Fives, adding a major cryogenic heat transfer and pump technology platform to its portfolio. The deal strengthens Alfa Laval’s position in LNG, hydrogen, carbon capture, and industrial gas applications, which are closely tied to cryogenic vessel and storage infrastructure.
- In September 2024, TransTech Group acquired Cryogenic Technology Resources (CTR), a company known for engineered cryogenic and high-pressure bulk gas storage and transfer solutions. This acquisition expanded TransTech’s capabilities in areas such as storage tanks, transfer systems, installation, service, and recertification for the industrial gas market.
Report Scope
| Report Attribute | Details |
| Market size value in 2025 | USD 6,914.28 million |
| Revenue forecast in 2032 | USD 9,458.05 million |
| Growth rate (CAGR) | 5.36% (2025–2032) |
| Base year | 2025 |
| Forecast period | 2026-2032 |
| Quantitative units | USD million |
| Segments covered | Vessel Type Outlook: Storage Tanks, Transport Vessels; Material Outlook: Stainless Steel, Nickel Alloys; Capacity Range Outlook: Small, Medium, Large; Application Outlook: LNG, Medical Gases, Industrial Gases; Insulation Type Outlook: Vacuum, Perlite |
| Regional scope | North America, Europe, Asia Pacific, Latin America, Middle East & Africa |
| Key companies profiled | Chart Industries, Linde, Air Products, Cryofab, Taylor-Wharton, INOX India, Messer, Worthington, Kawasaki HI, IHI |
| No.of Pages | 328 |
Segmentation
By Vessel Type
- Storage Tanks
- Transport Vessels
By Material
- Stainless Steel
- Nickel Alloys
By Capacity Range
- Small
- Medium
- Large
By Application
- LNG
- Medical Gases
- Industrial Gases
By Insulation Type
- Vacuum
- Perlite
By Region
- North America
- U.S.
- Canada
- Mexico
- Europe
- Germany
- France
- U.K.
- Italy
- Spain
- Rest of Europe
- Asia Pacific
- China
- Japan
- India
- South Korea
- South-east Asia
- Rest of Asia Pacific
- Latin America
- Brazil
- Argentina
- Rest of Latin America
- Middle East & Africa
- GCC Countries
- South Africa
- Rest of the Middle East and Africa
Request a Free Sample
Fill in your details and we'll send you a free sample report.
- Sample data tables & charts
- Research methodology
Need a Custom Version of This Report?
Tailor the scope, geography, or segments to your exact requirements.
- Custom geography or segment scope
- Direct access to our analyst team
Frequently Asked Questions
What is the current and forecast market size for the Cryogenic Vessels Market?
What is the CAGR for the Cryogenic Vessels Market during the forecast period?
Which application segment holds the largest share in the Cryogenic Vessels Market?
What are the key growth factors supporting the Cryogenic Vessels Market?
Which companies are covered in the Cryogenic Vessels Market competitive landscape?
Which region leads the Cryogenic Vessels Market?
Table of Content
Chapter 1. Report Introduction
- 1.1 Report Description & Purpose
- 1.1.1 Report Title & Market Definition
- 1.1.2 Unique Selling Propositions (USP) & Key Differentiators
- 1.1.3 Value Proposition for Stakeholders
- 1.2 Research Objectives
- 1.2.1 Market Sizing Objectives (Volume & Revenue)
- 1.2.2 Segmentation Objectives
- 1.2.3 Competitive Intelligence Objectives
- 1.2.4 Forecast & Scenario Objectives
- 1.3 Report Scope
- 1.3.1 Cryogenic Vessels Scope – Types & Subtypes Covered
- 1.3.2 Geographic Scope – Regions & Countries Covered
- 1.3.3 Historical Period, Base Year & Forecast Period (2025; forecast to 2032)
- 1.3.4 Inclusions & Exclusions
- 1.4 HS Code & Classification Framework
- 1.5 Currency, Units & Pricing Basis
- 1.6 Target Stakeholders
- 1.7 Limitations & Assumptions
Chapter 2. Executive Summary
- 2.1 Global Cryogenic Vessels Market Snapshot
- 2.1.1 Market Size – Historical (2025) & Forecast (2025-2032) (2025: USD 6,914.28 million → 2032: USD 9,458.05 million)
- 2.1.2 Volume & Revenue – Global Totals
- 2.1.3 Key Market Highlights – Top Five Facts
- 2.2 Cryogenic Vessels Market Segmentation Snapshot
- 2.2.1 Market Split by Region – 2025 vs. 2032
- 2.3 Competitive Snapshot
- 2.3.1 Top 10 Players by Revenue Share – 2025
- 2.3.2 Top 10 Players by Volume Share – 2025
- 2.3.3 Recent Strategic Developments (18-Month Summary)
- 2.4 Key Investment Highlights & Strategic Conclusions
Chapter 3. Cryogenic Vessels Market Dynamics & Industry Analysis
- 3.1 Market Overview & Context
- 3.1.1 Cryogenic Vessels Market Position in the Broader Automotive Value Chain
- 3.1.2 OEM vs. Replacement Market Dynamics
- 3.1.3 Market Maturity & Development Stage by Region
- 3.2 Cryogenic Vessels Market Drivers
- 3.3 Cryogenic Vessels Market Restraints & Challenges
- 3.4 Cryogenic Vessels Market Opportunities
- 3.5 Porter's Five Forces Analysis
- 3.5.1 Threat of New Entrants
- 3.5.2 Bargaining Power of Suppliers
- 3.5.3 Bargaining Power of Buyers
- 3.5.4 Threat of Substitutes
- 3.5.5 Competitive Rivalry – Intensity Assessment
- 3.6 Cryogenic Vessels Value Chain Analysis
- 3.6.1 Upstream – Raw Material/Input Suppliers
- 3.6.1.1 Raw Material/Input 1
- 3.6.1.2 Raw Material/Input 2
- 3.6.1.3 Raw Material/Input 3
- 3.6.2 Midstream – Production/Manufacturing/Service Delivery
- 3.6.2.1 Production/Process Overview
- 3.6.2.2 Key Facility Locations & Capacity by Manufacturer
- 3.6.3 Downstream – Distribution & End Consumer
- 3.6.3.1 Primary Channel – B2B/OEM
- 3.6.3.2 Secondary Channels – Dealer, Retail, Online, Direct
- 3.6.4 Value Chain Profitability Analysis
- 3.6.1 Upstream – Raw Material/Input Suppliers
- 3.7 PESTEL Analysis
- 3.7.1 Political Factors
- 3.7.2 Economic Factors
- 3.7.3 Social Factors
- 3.7.4 Technological Factors
- 3.7.5 Environmental Factors
- 3.7.6 Legal Factors
- 3.8 Cryogenic Vessels Supply Chain Analysis
- 3.8.1 Raw Material/Input Supply Risk Assessment
- 3.8.2 Manufacturing Concentration Risk (Geographic Exposure)
- 3.8.3 Trade Disruption Impact Analysis
- 3.9 Regulatory & Policy Landscape
Note: The regulatory and policy landscape section covers regulations based on their applicability to the market, Cryogenic Vessels category, geography, and scope of the study. Only regulatory frameworks with a material impact on operations, compliance, trade, sustainability, or market access are analyzed in detail.
Chapter 4. Key Investment Pockets & Opportunity Analysis
- 4.1 Cryogenic Vessels Market Attractiveness Analysis
- 4.1.1 By Region – Investment Attractiveness Matrix (Volume × CAGR)
- 4.2 Absolute Revenue Growth Opportunity
- 4.2.1 By Region – Absolute USD Growth Through 2032
- 4.3 Incremental Volume Opportunity
- 4.3.1 By Region – Incremental Volume Through 2032
- 4.3.2 Segment – Incremental Volume
- 4.4 Emerging Submarket Opportunity Deep Dive (Subject to Applicability)
- 4.5 Emerging Market Opportunity Scorecards
- 4.5.1 United States
- 4.5.2 Europe
- 4.5.3 Asia
- 4.5.4 Middle East & Africa
Note: Emerging Market Opportunity Scorecards will be included based on relevance and strategic importance. Regions listed are indicative and may vary depending on data availability and market dynamics.
Chapter 5. Cryogenic Vessels Import-Export Analysis & Trade Flows
- 5.1 Global Trade Overview
- 5.1.1 Global Export Value by Country (2025)
- 5.1.2 Global Export Volume by Country (2025)
- 5.1.3 Global Import Value by Country (2025)
- 5.1.4 Global Import Volume by Country (2025)
- 5.1.5 Net Trade Balance by Country (2025)
- 5.2 Export Analysis – Segment
- 5.2.1 Type 1 (HS Code)
- 5.2.2 Type 2 (HS Code)
- 5.2.3 Type 3 (HS Code)
- 5.2.4 Type 4 (HS Code)
- 5.2.5 Type 5 (HS Code)
- 5.3 Import Analysis – Segment
- 5.3.1 Type 1 (HS Code)
- 5.3.2 Type 2 (HS Code)
- 5.3.3 Type 3 (HS Code)
- 5.3.4 Type 4 (HS Code)
- 5.3.5 Type 5 (HS Code)
- 5.4 Average Unit Trade Prices
- 5.4.1 Average Export Price – Segment & Country
- 5.4.2 Average Import Price – Segment & Source Country
- 5.4.3 Price Trends (2025)
- 5.5 Key Trade Route Analysis
- 5.5.1 Trade Route 1
- 5.5.2 Trade Route 2
- 5.5.3 Trade Route 3
- 5.5.4 Trade Route 4
- 5.5.5 Trade Route 5
- 5.6 Trade Policy Impact Assessment
- 5.6.1 US Anti-Dumping & Section 301 Tariffs
- 5.6.2 EU Customs Union Impact
- 5.6.3 Major Free Trade Agreements
- 5.6.4 USMCA Rules of Origin
Note: Trade policy analysis will be included only where relevant to the Cryogenic Vessels market.
Chapter 6. Competitive Landscape & Company Benchmarking
- 6.1 Cryogenic Vessels Market Concentration & Structure
- 6.1.1 Herfindahl-Hirschman Index (HHI) – vs. 2025
- 6.1.2 Tier 1, Tier 2 & Tier 3 Market Structure
- 6.1.3 Global, Regional & Local Player Dynamics
- 6.2 Cryogenic Vessels Market Share Analysis – 2025
- 6.2.1 Global Revenue Share by Company
- 6.2.2 Global Volume Share by Company
- 6.2.3 Regional Revenue Share
- 6.2.4 Market Share Evolution ( vs. 2025)
- 6.2.5 OEM Segment Share by Company
- 6.2.6 Replacement Segment Share by Company
- 6.3 Production/Delivery Capacity & Facility Analysis
- 6.3.1 Global Installed Capacity
- 6.3.2 Capacity Utilization Rates
- 6.3.3 Production/Output Volume
- 6.3.4 Facility Locations & Capacity Map
- 6.3.5 Planned Capacity Additions
- 6.4 Cryogenic Vessels Competitive Benchmarking Matrix
- 6.4.1 Revenue, Volume, CAGR & Profitability Comparison
- 6.4.2 Channel Revenue Mix
- 6.4.3 Geographic Revenue Exposure
- 6.4.4 R&D Intensity
- 6.4.5 Sustainability Maturity
- 6.5 Strategic Developments in Cryogenic Vessels (Last 24 Months)
- 6.5.1 Mergers, Acquisitions & Divestments
- 6.5.2 New Cryogenic Vessels Launches
- 6.5.3 Facility Expansions
- 6.5.4 Strategic Alliances, Joint Ventures & Partnerships
- 6.5.5 Distribution Expansion & Market Entry
- 6.5.6 Sustainability & ESG Initiatives
- 6.6 Competitive Strategy Mapping
- 6.6.1 Leader, Challenger, Follower & Niche Classification
- 6.6.2 Pricing Strategy Comparison
- 6.6.3 Channel Strategy Matrix
Note: Strategic developments are included based on their materiality and the availability of reliable information.
Chapter 7. Global Cryogenic Vessels Market – By Distribution Channel
- 7.1 Segment Overview
- 7.1.1 Volume & Revenue Split by Channel (2025 & 2032)
- 7.1.2 Channel Mix Evolution (2025-2032)
Chapter 8. Regional Market Analysis – Global Overview
- 8.1 Global Regional Overview
- 8.1.1 Regional Volume Share
- 8.1.2 Regional Revenue Share
- 8.1.3 Regional Volume by Region
- 8.1.4 Regional Revenue by Region
- 8.1.5 Regional Forecast Through 2032
- 8.2 Cross-Regional Segment Analysis
- 8.2.1 By Distribution Channel
- 8.2.2 By Brand/Price Tier
Chapter 9. North America Cryogenic Vessels Market
- 9.1 United States
- 9.2 Canada
- 9.3 Mexico
Chapter 10. Europe Cryogenic Vessels Market
- 10.1 Germany
- 10.2 France
- 10.3 Italy
- 10.4 United Kingdom
- 10.5 Spain
- 10.6 Poland
- 10.7 Russia
- 10.8 Netherlands
- 10.9 Belgium
- 10.10 Sweden
- 10.11 Denmark
- 10.12 Norway
- 10.13 Rest of Europe
Chapter 11. Asia Pacific Cryogenic Vessels Market
- 11.1 China
- 11.2 India
- 11.3 Japan
- 11.4 South Korea
- 11.5 Thailand
- 11.6 Indonesia
- 11.7 Vietnam
- 11.8 Malaysia
- 11.9 Australia
- 11.10 Rest of Asia Pacific
Chapter 12. Latin America Cryogenic Vessels Market
- 12.1 Brazil
- 12.2 Argentina
- 12.3 Colombia
- 12.4 Chile
- 12.5 Rest of Latin America
Chapter 13. Middle East Cryogenic Vessels Market
- 13.1 Saudi Arabia
- 13.2 United Arab Emirates
- 13.3 Turkey
- 13.4 Israel
- 13.5 Iran
- 13.6 Rest of the Middle East
Chapter 14. Africa Cryogenic Vessels Market
- 14.1 South Africa
- 14.2 Egypt
- 14.3 Nigeria
- 14.4 Morocco
- 14.5 Rest of Africa
Chapter 15. Cryogenic Vessels Company Profiles
- 15.1 [Company 01]
- 15.1.1 Company Overview
- 15.1.2 Key Management Personnel
- 15.1.3 Products & Services Portfolio
- 15.1.4 Financial Performance
- 15.1.5 Key Market Focus & Geographic Presence
- 15.1.6 Recent Developments & Strategic Initiatives
Note: The company profile list is preliminary and may change based on research findings, market developments, data availability, and client requirements.
Chapter 16. Appendices
- Appendix A – List of Abbreviations & Acronyms
- Appendix B – Industry Classification Code Reference – Full Series
- Appendix C – Production & Capacity Data Tables
- Appendix D – End-Use & Demand Base Tables
- Appendix E – Consumption & Replacement Rate Assumptions
- Appendix F – ASP Reference Tables
- Appendix G – Manufacturing & Facility Database
- Appendix H – Import-Export Data Tables
- Appendix I – Regulatory Summary Tables
- Appendix J – Primary Research Participant List (Anonymized)
- Appendix K – Primary Research Questionnaire Framework
- Appendix L – Data Sources & Bibliography
- Appendix M – Market Size Divergence & Source Comparison
Chapter 17. Research Methodology
- 17.1 Research Framework & Philosophy
- 17.2 Secondary Research – Sources, Hierarchy & Data Extraction
- 17.3 Data Modeling – Bottom-Up & Top-Down Market Sizing
- 17.4 Primary Research – Stakeholder Framework, LOI & Sample Sizes
- 17.5 Forecast Methodology – Regression, Scenario & Sensitivity Analysis
- 17.6 Quality Control – Four-Layer Validation Framework
- 17.7 Limitations & Standard Assumptions
- 17.8 Disclaimer
