Market Overview
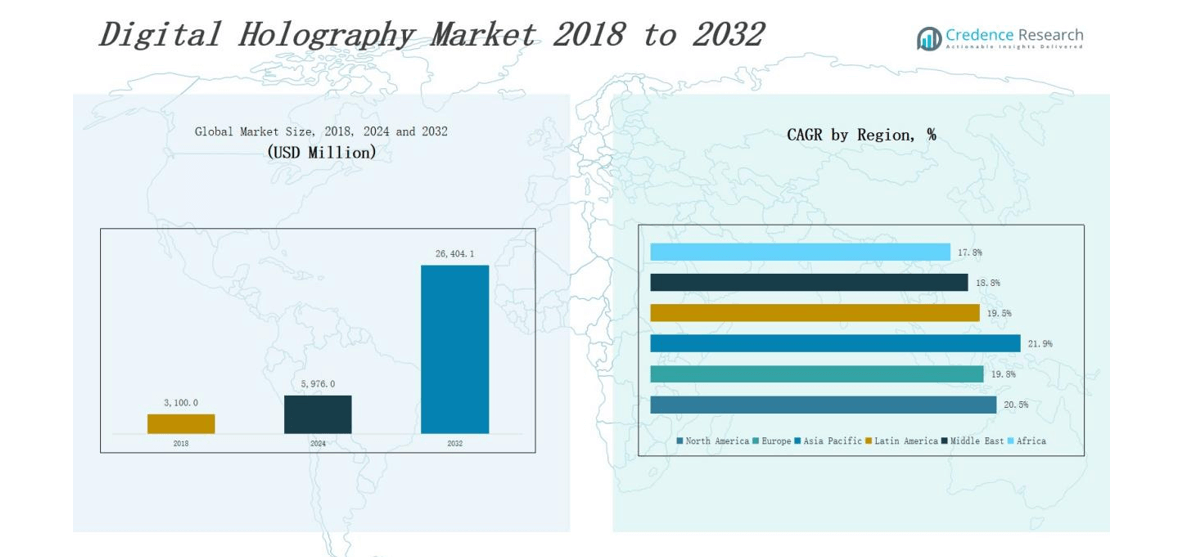
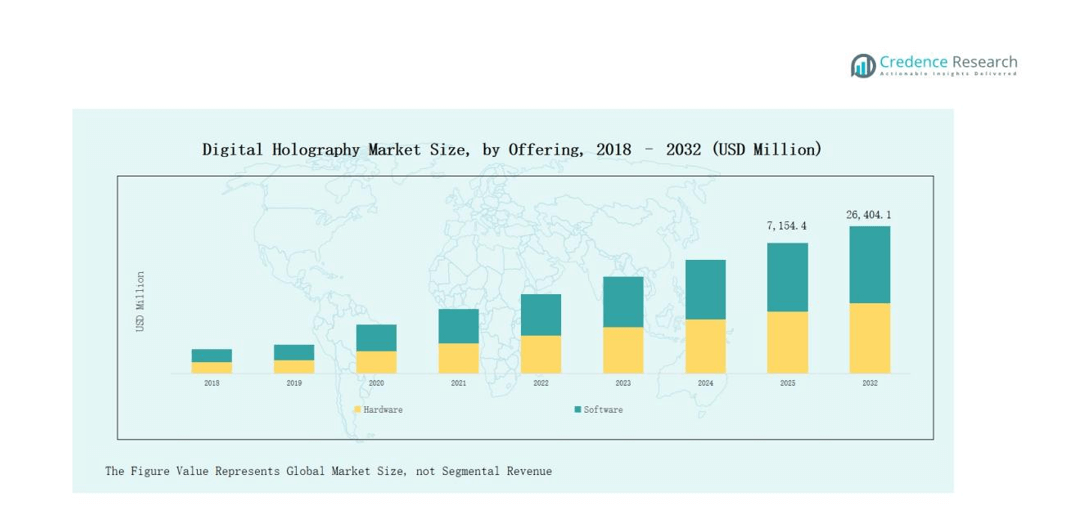
Digital Holography Market size was valued at USD 5,120.0 million in 2018 to USD 10,133.4 million in 2024 and is anticipated to reach USD 51,991.0 million by 2032, at a CAGR of 22.8% during the forecast period.
| REPORT ATTRIBUTE | DETAILS |
|---|---|
| Historical Period | 2020-2023 |
| Base Year | 2024 |
| Forecast Period | 2025-2032 |
| Digital Holography Market Size 2024 | USD 10,133.4 million |
| Digital Holography Market, CAGR | 22.8% |
| Digital Holography Market Size 2032 | USD 51,991.0 million |
The Digital Holography Market is shaped by prominent players including Lyncée Tec SA, RealView Imaging Ltd., EON Reality, Phase Holographic Imaging PHI AB, Holotech, Holmarc Opto-Mechatronics Ltd., Geola, Leia Inc., Ovizio, Himax Technologies, Inc., MetroLaser, HYPERVSN, Samsung, and Meta. These companies drive market growth through innovations in holographic imaging, microscopy, and advanced display technologies, targeting healthcare, consumer electronics, automotive, and defense applications. Their strategies focus on product development, strategic collaborations, and expanding commercialization of 3D holography. Regionally, North America leads the market with 38 percent share, supported by advanced research infrastructure, strong adoption in medical imaging, and the presence of major technology firms driving large-scale deployment.
Market Insights
- The Digital Holography Market is projected to reach USD 51,991.0 million by 2032, driven by healthcare, consumer electronics, automotive, and defense applications.
- Leading companies such as Samsung, Meta, Lyncée Tec SA, RealView Imaging, and EON Reality fuel growth through innovations in holographic imaging and advanced display technologies.
- North America holds 34 percent share by 2032, led by the U.S. with strong adoption in medical imaging, telepresence, and defense visualization applications.
- Asia Pacific accounts for 28 percent share, emerging as the fastest-growing region with rapid adoption in smartphones, AR/VR devices, and healthcare applications.
- Europe captures 27 percent share, supported by demand in automotive, aerospace, and healthcare, with Germany, the UK, and France driving industrial and R&D investments.
Market Segment Insight
By Offering
The digital holography market by offering is dominated by hardware with 67 percent share, driven by strong demand for advanced sensors, imaging systems, and holographic displays. Hardware adoption is especially high in healthcare and defense for precision visualization. Software is smaller in share but expanding quickly with innovations in real-time holographic rendering and image processing solutions.
- For instance, ZEISS introduced its ZEISS Lightsheet Z.1 microscope, which employs high-precision optical hardware for 3D holographic imaging in biomedical research.
By Dimension
The 3D segment leads with 72 percent share, as it provides depth perception, immersive experiences, and advanced visualization capabilities. Its use is strongest in medical imaging, telepresence, and consumer electronics. While 2D holography remains relevant in basic applications, industries increasingly prioritize 3D solutions supported by continuous improvements in display resolution and optics.
- For instance, Microsoft’s Holoportation project uses 3D holograms for telepresence, allowing users wearing a HoloLens to interact as if physically present.
By End Use Vertical
The healthcare segment dominates with 41 percent share, owing to applications in diagnostics, life sciences, and surgical planning. Consumer electronics follow at 19 percent, driven by AR/VR devices and smartphones. Automotive holds 17 percent share with holographic displays in infotainment and driver assistance, while aerospace and defense account for 15 percent due to simulation and mission planning. Other industries, including education and advertising, capture the remaining 8 percent, benefiting from interactive training and immersive marketing tools.
Market Overview
Advancements in Medical Imaging
The digital holography market benefits strongly from its integration in medical imaging and diagnostics. Holographic microscopy and 3D imaging provide detailed, non-invasive visualization of cells, tissues, and organs, enhancing accuracy in early disease detection. Hospitals and research institutes increasingly adopt these technologies to support life sciences and clinical workflows. Rising investments in healthcare infrastructure and the demand for precision imaging further accelerate adoption, making medical applications a key driver of market growth and technological innovation.
- For instance, 3D holography provides detailed heart imaging, allowing cardiologists to examine heart valves and structures with precise visualization, offering improved diagnostic and educational capabilities over conventional 2D methods.
Rising Adoption in Consumer Electronics
Consumer electronics is a major growth driver, fueled by the integration of holographic displays in smartphones, tablets, AR/VR headsets, and wearable devices. The demand for immersive user experiences, high-resolution visualization, and interactive content is driving manufacturers to adopt holographic technology. Companies are investing heavily in next-generation displays to differentiate products in a competitive market. The rising influence of entertainment, gaming, and virtual communication is also creating opportunities for large-scale adoption of digital holography in personal devices globally.
- For instance, Sony introduced its Spatial Reality Display (SR Display) in 2020, which uses real-time eye-tracking and high-speed vision sensors to project 3D holograms without VR headsets, and has since been adopted by creators in gaming and design.
Defense and Aerospace Applications
The defense and aerospace sectors actively drive the digital holography market through applications in simulation, training, mission planning, and situational awareness. The technology allows highly accurate 3D visualization of complex environments, enhancing decision-making and operational efficiency. Governments and defense agencies are increasing investments in advanced visualization systems to support security and military modernization. The aerospace industry leverages holography for design validation and navigation systems. These strategic applications ensure steady growth, positioning defense and aerospace as vital end-user segments.
Key Trends & Opportunities
Expansion of Holographic Telepresence
Holographic telepresence is emerging as a major trend, offering lifelike 3D communication in corporate, education, and healthcare settings. The technology enhances remote collaboration by creating a realistic presence, reducing the limitations of conventional video conferencing. Tech companies are actively piloting holographic communication platforms to redefine digital interaction. Growing demand for hybrid work models, virtual classrooms, and telemedicine solutions creates vast opportunities for holographic telepresence, paving the way for its commercial adoption across industries over the coming years.
- For instance, Proto (formerly PORTL) offers full-body, interactive holographic avatars for lifelike remote presence, used in corporate and educational settings to enhance engagement.
Integration with Artificial Intelligence
Artificial intelligence is creating new opportunities by enhancing holographic imaging capabilities through automated analysis, real-time rendering, and adaptive visualization. AI-driven holography improves image clarity, reduces noise, and enables advanced diagnostic insights in healthcare applications. In industrial sectors, AI integration optimizes product design and quality control using holographic data. This synergy between AI and digital holography accelerates innovation, enabling new use cases across research, consumer devices, and smart manufacturing. The trend is expected to significantly expand the technology’s market potential.
- For instance, Siemens has applied AI-enhanced holography in digital twin simulations to inspect micro-defects in manufacturing components for turbine blades.
Key Challenges
High Implementation Costs
One of the primary challenges for the digital holography market is its high implementation cost. Developing and deploying advanced holographic systems requires expensive hardware, including high-resolution sensors, lasers, and displays. These costs often restrict adoption to well-funded industries such as healthcare and defense. Small and medium enterprises face barriers in accessing the technology due to budget constraints. Unless production costs reduce through economies of scale, widespread commercialization of digital holography across mass consumer markets may remain limited.
Complexity of Technology
The complexity of holographic systems poses a major challenge, particularly in integration and operation. Accurate 3D holography requires precise alignment of optical components, specialized expertise, and advanced software algorithms. This complexity limits accessibility for end users without technical knowledge. Industries also face difficulties in scaling the technology for routine operations. Training requirements, lack of standardized platforms, and ongoing maintenance increase the burden for organizations, slowing down adoption rates across emerging application areas like education and industrial design.
Limited Standardization
The digital holography market faces hurdles due to the absence of standardization in hardware, software, and communication protocols. Different manufacturers use varying platforms, creating interoperability issues between systems. This lack of uniformity restricts widespread adoption, as organizations fear vendor lock-in and compatibility problems. Standardization is critical for scaling applications in healthcare, consumer electronics, and defense. Without unified frameworks, integration into existing infrastructures remains challenging, slowing down the pace of commercialization and creating uncertainty in long-term investment planning.
Regional Analysis
North America
North America leads the digital holography market with 34 percent share, reaching USD 8,978.1 million by 2032, up from USD 1,069.5 million in 2018. The region records a CAGR of 20.5 percent, supported by strong adoption in healthcare, consumer electronics, and defense. High investment in advanced imaging, robust research infrastructure, and presence of global technology players drive growth. The U.S. remains the largest contributor, owing to its early adoption of holographic telepresence and diagnostic imaging. Continuous government and private funding ensure the region maintains its leadership position in global digital holography adoption.
Europe
Europe holds 27 percent share of the global digital holography market, projected to reach USD 7,096.2 million by 2032 from USD 908.3 million in 2018, with a CAGR of 19.8 percent. The region benefits from strong demand in automotive, aerospace, and healthcare applications. Germany, the UK, and France are key markets due to industrial innovation and strong R&D in optics and imaging technologies. European defense modernization and rising use of holographic displays in consumer electronics further support growth. Regulations promoting advanced imaging solutions strengthen Europe’s role as a significant contributor to market expansion.
Asia Pacific
Asia Pacific accounts for 28 percent share, making it the fastest-growing region with a CAGR of 21.9 percent. The market expands from USD 753.3 million in 2018 to USD 7,378.1 million by 2032. Growth is fueled by rapid adoption in consumer electronics, particularly smartphones, AR/VR devices, and automotive displays. China, Japan, and South Korea lead technological investments, while India and Southeast Asia show rising demand in healthcare imaging and education. Strong electronics manufacturing bases, coupled with government support for digital technologies, position Asia Pacific as a central hub for digital holography growth.
Latin America
Latin America secures 6 percent market share, projected to grow from USD 213.6 million in 2018 to USD 1,684.1 million by 2032, at a CAGR of 19.5 percent. Brazil and Mexico dominate regional adoption, with applications in education, advertising, and medical imaging. Increasing investments in digital healthcare infrastructure and growing interest in immersive marketing support growth. However, limited access to advanced technology and higher implementation costs present challenges. Despite these constraints, expanding commercial sectors and growing integration of holography in industrial design are expected to gradually strengthen Latin America’s role in the global market.
Middle East
The Middle East represents 3 percent share, reaching USD 768.5 million by 2032, rising from USD 108.5 million in 2018, at a CAGR of 18.8 percent. Growth is concentrated in GCC countries and Israel, driven by defense modernization and smart city initiatives. The region’s aerospace industry is also adopting digital holography for simulation and planning. Healthcare applications are expanding as governments invest in advanced diagnostic systems. Despite relatively smaller size compared to major regions, increasing defense budgets and commercial innovation create consistent opportunities for holography adoption in the Middle East.
Africa
Africa holds 2 percent share, with steady growth from USD 46.8 million in 2018 to USD 499.1 million by 2032, achieving a CAGR of 17.8 percent. South Africa and Egypt are leading adopters, particularly in education, healthcare, and advertising applications. Expanding digital infrastructure, rising investments in medical technology, and increasing interest in immersive training solutions support growth. However, limited funding and lack of technical expertise remain barriers. As regional governments prioritize digital transformation, gradual adoption of holographic technologies is expected, establishing Africa as an emerging contributor to the global digital holography market.
Market Segmentations:
By Offering
- Hardware
- Software
By Dimension
- Two Dimensional (2D)
- Three Dimensional (3D)
By End Use Vertical
- Healthcare
- Automotive
- Aerospace and Defense
- Consumer Electronics
- Others
By Application
- Holographic Microscopy
- Holographic Imaging
- Holographic Telepresence
- Others
By Region
- North America
- U.S.
- Canada
- Mexico
- Europe
- Germany
- France
- U.K.
- Italy
- Spain
- Rest of Europe
- Asia Pacific
- China
- Japan
- India
- South Korea
- South-east Asia
- Rest of Asia Pacific
- Latin America
- Brazil
- Argentina
- Rest of Latin America
- Middle East & Africa
- GCC Countries
- South Africa
- Rest of the Middle East and Africa
Competitive Landscape
The competitive landscape of the Digital Holography Market is defined by a mix of established technology companies and specialized innovators focusing on holographic imaging and display solutions. Key players such as Lyncée Tec SA, RealView Imaging Ltd., EON Reality, Phase Holographic Imaging PHI AB, Holotech, Holmarc Opto-Mechatronics Ltd., Geola, Leia Inc., Ovizio, Himax Technologies, MetroLaser, HYPERVSN, Samsung, and Meta are central to shaping the market. These companies emphasize continuous innovation in holographic microscopy, telepresence, and advanced display technologies to expand applications across healthcare, consumer electronics, automotive, and aerospace. Strategic moves include product launches, collaborations, and investments in R&D to enhance visualization capabilities and strengthen market presence. Larger firms like Samsung and Meta leverage their scale and global reach to integrate holographic features into mainstream consumer devices, while niche players focus on precision healthcare and research applications. Intense competition encourages technological advancements, fueling rapid adoption and expanding commercialization opportunities worldwide.
Key Players
- Lyncée Tec SA
- RealView Imaging Ltd.
- EON Reality
- Phase Holographic Imaging PHI AB
- Holotech
- Holmarc Opto-Mechatronics Ltd.
- Geola
- Leia Inc.
- Ovizio
- Himax Technologies, Inc.
- MetroLaser
- HYPERVSN
- Samsung
- Meta
Recent Developments
- In August 2025, AKOOL launched its Holographic Avatar Display Series, featuring AI-powered avatars capable of lifelike interaction through voice, gestures, and expressions.
- In January 2025, PxE Holographic Imaging unveiled its Holographic RGB-IR-Depth Camera at CES 2025, offering advanced 3D imaging capabilities.
- in 2024, Leia Inc. launched Immersity AI, a platform that converts 2D images and videos into immersive 3D content.
- In December 2024, Eastman, Ceres Holographics, and Covestro signed a Memorandum of Understanding to co-develop holographic windshield displays.
Market Concentration & Characteristics
The Digital Holography Market shows a moderately concentrated structure, with a blend of global technology leaders and specialized niche players competing across diverse applications. It is characterized by continuous innovation in 3D imaging, holographic displays, and advanced optical systems. Large companies such as Samsung and Meta strengthen the competitive balance through scale and integration into consumer electronics, while firms like Lyncée Tec SA, RealView Imaging, and Phase Holographic Imaging PHI AB focus on precision healthcare and research solutions. The market exhibits high entry barriers due to significant capital investment, technical complexity, and strong intellectual property requirements. It also demonstrates a strong innovation-driven landscape, where players invest in research collaborations, partnerships, and product advancements to expand market reach. Healthcare, defense, and consumer electronics drive most demand, while cost and standardization challenges restrict widespread adoption. Overall, the market reflects a dynamic balance between established corporations and emerging innovators competing for technological leadership.
Report Coverage
The research report offers an in-depth analysis based on Offering, Dimension, End Use Vertical, Application and Region. It details leading market players, providing an overview of their business, product offerings, investments, revenue streams, and key applications. Additionally, the report includes insights into the competitive environment, SWOT analysis, current market trends, as well as the primary drivers and constraints. Furthermore, it discusses various factors that have driven market expansion in recent years. The report also explores market dynamics, regulatory scenarios, and technological advancements that are shaping the industry. It assesses the impact of external factors and global economic changes on market growth. Lastly, it provides strategic recommendations for new entrants and established companies to navigate the complexities of the market.
Future Outlook
- The market will grow through wider adoption in healthcare diagnostics, surgical imaging, and life sciences.
- Consumer electronics will expand demand with holographic displays integrated into smartphones, AR/VR devices, and tablets.
- Defense and aerospace will accelerate holography usage for mission planning, battlefield visualization, and simulation training.
- Education sectors will embrace holographic solutions for immersive teaching, interactive classrooms, and advanced virtual training.
- Retail and advertising industries will adopt holography to boost customer engagement and product visualization.
- Artificial intelligence integration will enhance holographic imaging precision, reduce noise, and improve real-time rendering.
- Industrial design and manufacturing will adopt holography for product validation, quality control, and prototyping.
- Healthcare providers will strengthen partnerships with technology companies to accelerate holographic diagnostic adoption.
- Standardization initiatives will ensure interoperability, reducing barriers and enabling wider holographic technology commercialization.
- Emerging economies will increase holography adoption with expanding digital infrastructure and rising technological investments.

Request a Free Sample
Fill in your details and we'll send you a free sample report.
- Sample data tables & charts
- Research methodology
Need a Custom Version of This Report?
Tailor the scope, geography, or segments to your exact requirements.
- Custom geography or segment scope
- Direct access to our analyst team
Frequently Asked Questions
What is the current size of the digital holography market?
What is driving the growth of the digital holography market?
How is digital holography used in healthcare?
Which region holds the largest share in the digital holography market?
Which region is expected to grow the fastest in this market?
Table of Content
Chapter 1. Report Introduction
- 1.1 Report Description & Purpose
- 1.1.1 Report Title & Market Definition
- 1.1.2 Unique Selling Propositions (USP) & Key Differentiators
- 1.1.3 Value Proposition for Stakeholders
- 1.2 Research Objectives
- 1.2.1 Market Sizing Objectives (Volume & Revenue) (Volume Where Applicable)
- 1.2.2 Segmentation Objectives
- 1.2.3 Competitive Intelligence Objectives
- 1.2.4 Forecast & Scenario Objectives
- 1.3 Report Scope
- 1.3.1 Digital Holography Scope – Segments & Subsegments Covered
- 1.3.2 Geographic Scope – Regions & Countries Covered
- 1.3.3 Historical Period, Base Year & Forecast Period (2024; forecast to 2032)
- 1.3.4 Inclusions & Exclusions
- 1.4 Industry Classification & Applicable Codes
- 1.5 Currency, Measurement Units & Valuation Basis
- 1.6 Target Stakeholders
- 1.7 Limitations & Assumptions
Chapter 2. Executive Summary
- 2.1 Global Digital Holography Market Snapshot
- 2.1.1 Market Size – Historical (2024) & Forecast (2024-2032) (2024: USD 10,133.4 million → 2032: USD 51,991.0 million)
- 2.1.2 Volume & Revenue – Global Totals (Volume Where Applicable)
- 2.1.3 Key Market Highlights – Top Five Facts
- 2.2 Digital Holography Market Segmentation Snapshot
- 2.2.1 Market Split by Region – 2024 vs. 2032
- 2.3 Competitive Snapshot
- 2.3.1 Top 10 Players by Revenue Share – 2024
- 2.3.2 Top 10 Players by Volume Share – 2024 (Volume Where Applicable)
- 2.3.3 Recent Strategic Developments (18-Month Summary)
- 2.4 Key Investment Highlights & Strategic Conclusions
Chapter 3. Digital Holography Market Dynamics & Industry Analysis
- 3.1 Market Overview & Context
- 3.1.1 Digital Holography Market Position in the Broader Industry Value Chain
- 3.1.2 Demand Structure & Purchasing Dynamics
- 3.1.3 Market Maturity & Development Stage by Region
- 3.2 Digital Holography Market Drivers
- 3.3 Digital Holography Market Restraints & Challenges
- 3.4 Digital Holography Market Opportunities
- 3.5 Porter's Five Forces Analysis
- 3.5.1 Threat of New Entrants
- 3.5.2 Bargaining Power of Suppliers
- 3.5.3 Bargaining Power of Buyers
- 3.5.4 Threat of Substitutes
- 3.5.5 Competitive Rivalry – Intensity Assessment
- 3.6 Digital Holography Value Chain Analysis
- 3.6.1 Upstream – Key Inputs, Resources & Suppliers
- 3.6.1.1 Key Input/Resource 1
- 3.6.1.2 Key Input/Resource 2
- 3.6.1.3 Key Input/Resource 3
- 3.6.2 Midstream – Core Operations & Value Creation
- 3.6.2.1 Operating Model & Process Overview
- 3.6.2.2 Key Operating Locations & Capabilities by Company
- 3.6.3 Downstream – Market Channels & End Users
- 3.6.3.1 Direct Sales & Customer Engagement Channels
- 3.6.3.2 Indirect Sales, Intermediaries & Partner Channels
- 3.6.4 Value Chain Profitability Analysis
- 3.6.1 Upstream – Key Inputs, Resources & Suppliers
- 3.7 PESTEL Analysis
- 3.7.1 Political Factors
- 3.7.2 Economic Factors
- 3.7.3 Social Factors
- 3.7.4 Technological Factors
- 3.7.5 Environmental Factors
- 3.7.6 Legal Factors
- 3.8 Digital Holography Supply Chain Analysis
- 3.8.1 Critical Input & Resource Availability Risk Assessment
- 3.8.2 Supplier & Operational Concentration Risk (Geographic Exposure)
- 3.8.3 Supply & Service Disruption Impact Analysis
- 3.9 Regulatory & Policy Landscape
Note: The regulatory and policy landscape section covers regulations based on their applicability to the market, Digital Holography category, geography, and scope of the study. Only regulatory frameworks with a material impact on operations, compliance, trade, sustainability, or market access are analyzed in detail.
Chapter 4. Key Investment Pockets & Opportunity Analysis
- 4.1 Digital Holography Market Attractiveness Analysis
- 4.1.1 By Region – Investment Attractiveness Matrix (Market Size × CAGR)
- 4.2 Absolute Revenue Growth Opportunity
- 4.2.1 By Region – Absolute Revenue Growth Through 2032
- 4.3 Incremental Demand Opportunity
- 4.3.1 By Region – Incremental Demand Through 2032
- 4.3.2 Segment – Incremental Demand
- 4.4 Emerging Submarket Opportunity Deep Dive (Subject to Applicability)
- 4.5 Priority Market Opportunity Scorecards
- 4.5.1 United States
- 4.5.2 Europe
- 4.5.3 Asia
- 4.5.4 Middle East & Africa
Note: Priority market opportunity scorecards reflect the geographic scope and strategic relevance of the study. Listed markets are indicative and may be adapted to the industry.
Chapter 5. Digital Holography Cross-Border Trade & Market Access Analysis
- 5.1 International Trade & Cross-Border Activity Overview
- 5.1.1 Global Export Value by Country (2024)
- 5.1.2 Global Export Volume by Country (2024) (Volume Where Applicable)
- 5.1.3 Global Import Value by Country (2024)
- 5.1.4 Global Import Volume by Country (2024) (Volume Where Applicable)
- 5.1.5 Net Trade Balance by Country (2024)
- 5.2 Export Analysis – Segment
- 5.2.1 Category 1 (Applicable Classification Code)
- 5.2.2 Category 2 (Applicable Classification Code)
- 5.2.3 Category 3 (Applicable Classification Code)
- 5.2.4 Category 4 (Applicable Classification Code)
- 5.2.5 Category 5 (Applicable Classification Code)
- 5.3 Import Analysis – Segment
- 5.3.1 Category 1 (Applicable Classification Code)
- 5.3.2 Category 2 (Applicable Classification Code)
- 5.3.3 Category 3 (Applicable Classification Code)
- 5.3.4 Category 4 (Applicable Classification Code)
- 5.3.5 Category 5 (Applicable Classification Code)
- 5.4 Cross-Border Pricing & Transaction Benchmarks
- 5.4.1 Export Pricing – Segment & Country
- 5.4.2 Import Pricing – Segment & Source Country
- 5.4.3 Price Trends (2024)
- 5.5 Key Cross-Border Trade & Delivery Routes
- 5.5.1 Cross-Border Trade/Delivery Route 1
- 5.5.2 Cross-Border Trade/Delivery Route 2
- 5.5.3 Cross-Border Trade/Delivery Route 3
- 5.5.4 Cross-Border Trade/Delivery Route 4
- 5.5.5 Cross-Border Trade/Delivery Route 5
- 5.6 Trade Policy & Market Access Impact Assessment
- 5.6.1 Tariff & Non-Tariff Barriers
- 5.6.2 Regional Trade & Economic Integration Frameworks
- 5.6.3 Bilateral & Multilateral Trade Agreements
- 5.6.4 Cross-Border Operating, Licensing & Localization Requirements
Note: This chapter applies where cross-border trade or delivery is relevant to Digital Holography. Goods, services, and digital offerings are assessed using applicable classifications and transaction measures. Import-export volumes, trade balances, and route analyses are included only where meaningful to the market.
Chapter 6. Competitive Landscape & Company Benchmarking
- 6.1 Digital Holography Market Concentration & Structure
- 6.1.1 Herfindahl-Hirschman Index (HHI) – vs. 2024
- 6.1.2 Leading, Mid-Sized & Emerging Player Structure
- 6.1.3 Global, Regional & Local Player Dynamics
- 6.2 Digital Holography Market Share Analysis – 2024
- 6.2.1 Global Revenue Share by Company
- 6.2.2 Global Volume Share by Company (Volume Where Applicable)
- 6.2.3 Regional Revenue Share
- 6.2.4 Market Share Evolution ( vs. 2024)
- 6.2.5 Company Market Share by Key Segment
- 6.2.6 Company Market Share by Customer Group
- 6.3 Operating Scale, Capacity & Infrastructure Analysis
- 6.3.1 Global Operating Scale & Supply Capacity
- 6.3.2 Resource Utilization & Operating Efficiency
- 6.3.3 Output, Service Delivery & Activity Metrics
- 6.3.4 Operating Footprint & Infrastructure Map
- 6.3.5 Planned Operational & Capacity Expansion
- 6.4 Digital Holography Competitive Benchmarking Matrix
- 6.4.1 Revenue, Growth, Profitability & Operating Metric Comparison
- 6.4.2 Channel Revenue Mix
- 6.4.3 Geographic Revenue Exposure
- 6.4.4 R&D Intensity
- 6.4.5 Sustainability Maturity
- 6.5 Strategic Developments in Digital Holography (Last 24 Months)
- 6.5.1 Mergers, Acquisitions & Divestments
- 6.5.2 New Products, Services & Solutions in Digital Holography
- 6.5.3 Operational & Infrastructure Expansions
- 6.5.4 Strategic Alliances, Joint Ventures & Partnerships
- 6.5.5 Distribution Expansion & Market Entry
- 6.5.6 Sustainability & ESG Initiatives
- 6.6 Competitive Strategy Mapping
- 6.6.1 Leader, Challenger, Follower & Niche Classification
- 6.6.2 Pricing Strategy Comparison
- 6.6.3 Channel Strategy Matrix
Note: Strategic developments are included based on their materiality and the availability of reliable information.
Chapter 7. Global Digital Holography Market – By Sales & Delivery Channel
- 7.1 Segment Overview
- 7.1.1 Volume & Revenue Split by Channel (2024 & 2032) (Volume Where Applicable)
- 7.1.2 Channel Mix Evolution (2024-2032)
Chapter 8. Regional Market Analysis – Global Overview
- 8.1 Global Regional Overview
- 8.1.1 Regional Volume Share (Volume Where Applicable)
- 8.1.2 Regional Revenue Share
- 8.1.3 Regional Volume by Region (Volume Where Applicable)
- 8.1.4 Regional Revenue by Region
- 8.1.5 Regional Forecast Through 2032
- 8.2 Cross-Regional Segment Analysis
- 8.2.1 By Sales & Delivery Channel
- 8.2.2 By Competitive Positioning & Price Tier
Chapter 9. North America Digital Holography Market
- 9.1 United States
- 9.2 Canada
- 9.3 Mexico
Chapter 10. Europe Digital Holography Market
- 10.1 Germany
- 10.2 France
- 10.3 Italy
- 10.4 United Kingdom
- 10.5 Spain
- 10.6 Poland
- 10.7 Russia
- 10.8 Netherlands
- 10.9 Belgium
- 10.10 Sweden
- 10.11 Denmark
- 10.12 Norway
- 10.13 Rest of Europe
Chapter 11. Asia Pacific Digital Holography Market
- 11.1 China
- 11.2 India
- 11.3 Japan
- 11.4 South Korea
- 11.5 Thailand
- 11.6 Indonesia
- 11.7 Vietnam
- 11.8 Malaysia
- 11.9 Australia
- 11.10 Rest of Asia Pacific
Chapter 12. Latin America Digital Holography Market
- 12.1 Brazil
- 12.2 Argentina
- 12.3 Colombia
- 12.4 Chile
- 12.5 Rest of Latin America
Chapter 13. Middle East Digital Holography Market
- 13.1 Saudi Arabia
- 13.2 United Arab Emirates
- 13.3 Turkey
- 13.4 Israel
- 13.5 Iran
- 13.6 Rest of the Middle East
Chapter 14. Africa Digital Holography Market
- 14.1 South Africa
- 14.2 Egypt
- 14.3 Nigeria
- 14.4 Morocco
- 14.5 Rest of Africa
Chapter 15. Digital Holography Company Profiles
- 15.1 [Company 01]
- 15.1.1 Company Overview
- 15.1.2 Key Management Personnel
- 15.1.3 Products & Services Portfolio
- 15.1.4 Financial Performance
- 15.1.5 Key Market Focus & Geographic Presence
- 15.1.6 Recent Developments & Strategic Initiatives
Note: The company profile list is preliminary and may change based on research findings, market developments, data availability, and client requirements.
Chapter 16. Appendices
- Appendix A – List of Abbreviations & Acronyms
- Appendix B – Industry Classification Code Reference – Full Series
- Appendix C – Supply, Output & Operating Capacity Data Tables
- Appendix D – End-Use & Demand Base Tables
- Appendix E – Demand, Adoption & Usage Assumptions
- Appendix F – Pricing & Revenue Metric Reference Tables
- Appendix G – Company Operations & Infrastructure Database
- Appendix H – Cross-Border Trade & Activity Data Tables (Where Applicable)
- Appendix I – Regulatory Summary Tables
- Appendix J – Primary Research Participant List (Anonymized)
- Appendix K – Primary Research Questionnaire Framework
- Appendix L – Data Sources & Bibliography
- Appendix M – Market Size Divergence & Source Comparison
Chapter 17. Research Methodology
- 17.1 Research Framework & Philosophy
- 17.2 Secondary Research – Sources, Hierarchy & Data Extraction
- 17.3 Data Modeling – Bottom-Up & Top-Down Market Sizing
- 17.4 Primary Research – Stakeholder Framework, LOI & Sample Sizes
- 17.5 Forecast Methodology – Regression, Scenario & Sensitivity Analysis
- 17.6 Quality Control – Four-Layer Validation Framework
- 17.7 Limitations & Standard Assumptions
- 17.8 Disclaimer