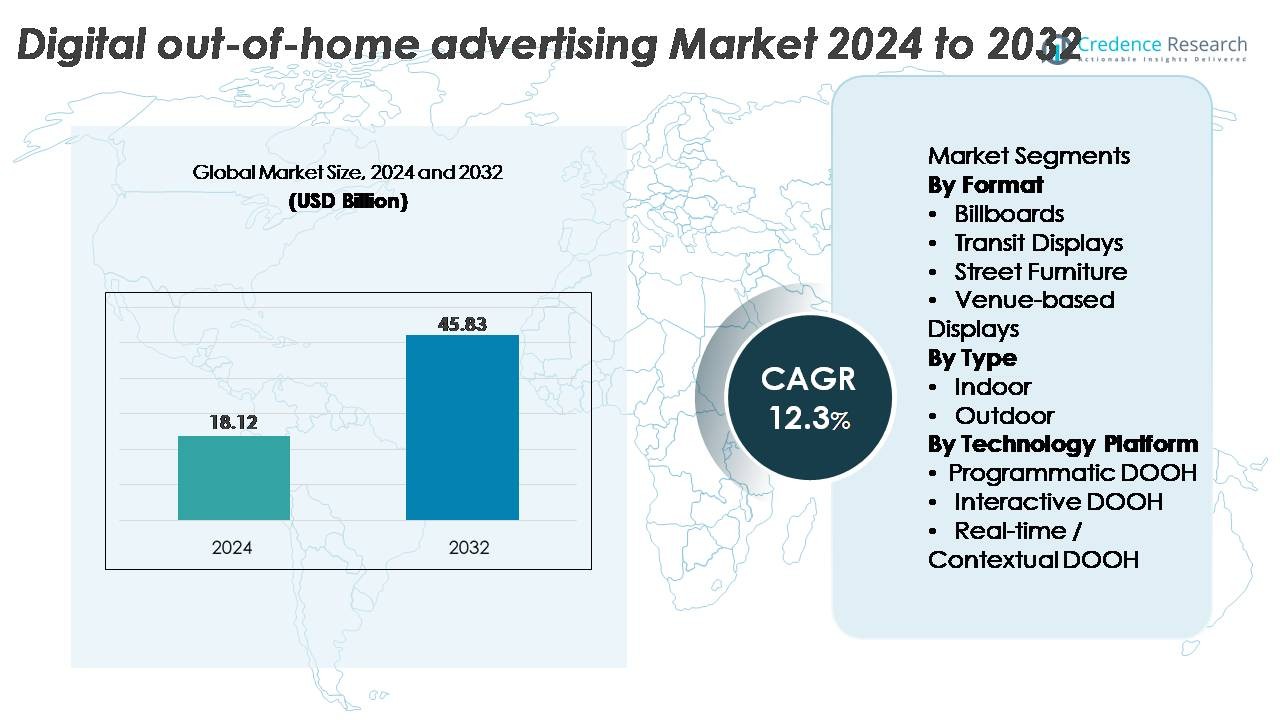
Digital Out-Of-Home Market By End-User (Automotive, Personal Care and Households ,Entertainment Retail Food and Beverages, Telecom, BFSI, Others) By Format Type, (Billboard, Transit Street Furniture Others) Growth, Future Prospects & Competitive Analysis, 2016 – 2030

Price: $4999

Published: | Report ID: 4845 | Report Format : PDF

Key Highlights of the Report

How are the major segments performing in the Digital Out-Of-Home market?

  • In 2022, the retail segment accounted for the largest market share as the industry underwent a fundamental upheaval. The retail sector’s use of technology-enabled some of the most obvious disruptions.
  • In 2022, the billboard segment was anticipated to hold a prominent share of the global digital-out-of-home market. In busy regions, large advertisements for passing automobiles and pedestrians are frequently shown on billboards. Due to the advertisements’ prominent visibility along express motorways and other sites with strong consumer exposure, this draws a lot of customers.
  • In 2022, the outdoor segment was anticipated to hold a prominent share in the global digital-out-of-home market as digital outdoor advertising is growing more and more common in the advertising industry since it increases brand awareness among consumers and complements other marketing strategies that are intended to spur market expansion.

What is the Market Size of Digital Out-Of-Home regarding value?

The global digital out-of-home market is anticipated to grow at a substantial CAGR of 11.50% in the upcoming years. The global digital out-of-home industry was estimated to be worth USD 21.9 billion in 2022 and was expected to be worth USD 46.92 billion by 2030.

Which region dominated the Digital Out-Of-Home market?

In 2022, the North American region was anticipated to hold a prominent share of the global digital out-of-home market because of expanding urbanization and consumer knowledge of a particular product’s branding. Digital outdoor advertising uses an engaging and interactive marketing approach that enables firms to go digital and display content that is easily accessible to the general public, which could spur market expansion. Additionally, rising investments in digital out-of-home advertising are anticipated to fuel regional market expansion.

Design Element 2

Access crucial information at unmatched prices!

Request your free sample report today & start making informed decisions powered by Credence Research!

Download Free Sample
CTA Design Element 3

Which are the key countries in the Digital Out-Of-Home market?

In 2022, the U.S. region was anticipated to hold a prominent share of the North American digital out-of-home market. The U.S. continues to play a big role in North America’s global digital out-of-home market. In addition, a number of big businesses and significant R&D projects have caused the region to utilize DOOH widely. In order to promote innovative technologies in the industry under consideration, several of the leading players in the region are working closely together through strategic alliances. It is predicted that this will raise demand for DOOH.

In 2022, the China region was anticipated to hold a prominent share of the Asia Pacific digital out-of-home market. Due to their large consumer bases, growing nations like China are investing more in digital out-of-home advertising, which is to blame. The increased acceptance and popularity of out-of-home advertising among various industry verticals is another factor contributing to the market’s growth over the projection period for digital out-of-home advertising. Furthermore, the recent industry expansion has been fueled by the accelerating infrastructure development in emerging nations like China.

How is the economy impacting global Digital Out-Of-Home growth?

The out-of-home digital advertising sector has suffered because of the COVID-19 outbreak. As a result of the pandemic, governments around the world implemented a multitude of controls to attempt and keep the virus in check, including work-from-home policies, closures, travel bans and restrictions, and quarantines. These actions have had an impact on raw material suppliers’ operations, consumer and advertiser behaviour, and people in the out-of-home advertising industry. Additionally, it is anticipated that the easing of a number of limitations and the development of infrastructure in emerging economies will fuel market expansion throughout the projection period.

What is the competitive environment of the Digital Out-Of-Home market?

The competitive environment of the digital out-of-home industry provides data on the total economic profit made by suppliers and businesses, the sales and revenues generated in this industry, the global market share of digital out-of-home, a summary of the business organisation, the launch of new products, and the opportunities for the industrial digital out-of-home market. For instance, in September 2022, the launch of the Data Portal solution heralds the start of an innovative digital partnership in data management between Pernod Ricard and JCDecaux, two major global companies with French roots. With this solution, a company can centralize the data from all its international divisions in one place, making it simpler for users to access and share. Data is at the heart of both Groups’ business and growth initiatives, and the Data Portal helps them achieve their objectives. Furthermore, in August 2022, for its famed City of Sydney street furniture network, leading digital outdoor media supplier QMS confirmed that campaign-based selling started on August 29. At last night’s wonderful carbon-positive event held by QMS at Sydney Town Hall, the announcement played a big role.

Executive Summary

What are the key trends in the Digital Out-Of-Home market?

A speedy adoption of public information displays is projected due to recent advancements in display technology and the widespread use of digital connection (PID). Increasing panel size is another factor encouraging the entry of new enterprises with innovative product implementations and leading to the inexpensive cost of digital displays, which further encourages the use of digital screens. Since digital signage comprised of LEDs has replaced billboards in a number of countries, the market for LED displays has expanded.

How are Manufacturers Teaming Up with Stakeholders in Digital Out-Of-Home Market?

Economic experts from all across the world have considered physical infrastructure as necessary for industrialization. Infrastructure spending is very important for promoting technological adoption. These investments have steadily addressed how to reconcile technology breakthroughs with sustainability principles. All government levels now promote transit to reduce urban congestion, improve mobility, and keep the economy competitive. The transit infrastructure of industrialized and developing countries has lately increased, assisting the countries in achieving their overall mobility objectives.

Which are the key investments by the Digital Out-Of-Home market players?

The growth of production capabilities for digital out-of-home is a top priority for major companies in the market. In addition, players are focusing on strategic mergers and acquisitions, collaborations, and raising vendor awareness through various organisations established to promote smart expansion practises to service more end users in the domestic market and acquire a competitive edge. For instance, in November 2020, to demonstrate the future of out-of-home (OOH) advertising, oOh! Media Limited partnered with Google, the National Gallery of Australia, and other organizations. The public now has the chance to engage and connect with the advertising by downloading the app and pointing their smartphone’s camera at the panel to learn more. This has aided the business’s market expansion and interactive experience delivery.

Some major players in the Digital Out-Of-Home market are Clear Channel Outdoor Holdings, Inc., Broadsign International, Inc, Daktronics, Inc, JCDecaux SA, Lamar Advertising Company, NEC Corporation, Ooh!mediaLtd, Outfront Media Inc, Samsung Electronics Co. Ltd, MvixInc.

What are the Major Driving Factors for the Digital Out-Of-Home Market?

Digital out-of-home media allows users to reach potential customers by fusing traditional advertising techniques with contemporary ones. Additionally, it is projected that the growing need for digital signage solutions across the automotive, retail, telecom, and healthcare sectors would present sizable potential prospects for developing the digital out of home market. Further, the market share for digital out-of-home entertainment is anticipated to expand significantly over the projection period due to falling prices for digital screens everywhere. The industry is expanding due to quick digitization and a drop in demand for conventional billboards. Hence, during the forecast period, the expansion of the digital out-of-home market is anticipated to be aided by the simplicity of data integration.

What are the Major Risks for the Digital Out-Of-Home Market?

Most purchasers pay attention to the acquisition cost component while ignoring other costs. They are ultimately let down because installation and maintenance are equally important. One of the new types of upcoming maintenance services is drones, which can often and remotely carry out DOOH repair services. Even though they require a substantial investment, they also result in faster lead times and fewer maintenance requirements. Video walls are among the most expensive options for digital signage because they may be constructed using many digital screens and are available in various sizes, including 2×2, 3×3, 5×5, and 1×4. Customers also demand attributes like Mura-free, round-the-clock availability, robustness, high resolution, consistent contrast, and screens with narrow bezels.

Which is the key application in the Digital Out-Of-Home market?

The outdoor segment is expected to hold a prominent share of the global digital out-of-home market during the forecast period. Market growth is being accelerated by the building industries’ increased spending on outdoor advertising to market their properties and create brand awareness. Additionally, due to the high conversion rate of advertisements, the popularity of digital out-of-home advertising for real estate marketing is accelerating industry expansion. Additionally, digital outdoor advertising allows real estate brands to craft contextually relevant and timely messages, boosting market growth over the projection period.

How is the Digital Out-Of-Home market performing in regions?

Asia Pacific market is anticipated to witness the fastest growth in the global digital out-of-home market during the forecast period. Due to their large consumer bases, growing nations like China, India, and Japan have boosted their spending on digital out-of-home advertisingFurthermore, due to the increasing acceptance and popularity of out-of-home advertising among various business verticals, the market for digital out-of-home advertising is predicted to expand during the course of the forecast period. Recent business expansion has also been spurred by the advancing infrastructure in developing nations like China and India.What is the regulatory landscape for the Digital Out-Of-Home market?

The main obstacles to this industry include regional differences in DOOH advertising regulations, including those governing content and size, the unstable cost of advertising, and the absence of accurate and up-to-date consumption statistics. Since the internet has become more popular, DOOH has simplified raising awareness and achieving spectacular outcomes.

Shape Your Report to Specific Countries or Regions & Enjoy 30% Off!

What are the major players planning for the future of the Digital Out-Of-Home market?

Growing regional presence and investments in downstream applications are predicted to give a competitive edge in the market. For instance, in October 2022, through a partnership with Vistar Media, a top global provider of DOOH software, StackAdapt, a leading self-serve programmatic advertising platform, today announced the availability of a new digital out-of-home (DOOH) channel globally.

REPORT ATTRIBUTE DETAILS
Digital Out-Of-Home Market by Value Yes
Digital Out-Of-Home Market, Tornado Analysis Yes
Digital Out-Of-Home Market, STAR Analysis Yes
Digital Out-Of-Home Market, SRC Analysis Yes
Digital Out-Of-Home Market Pricing Analysis Yes (On Demand)
Digital Out-Of-Home Market Segment Analysis By End-User (Automotive, Personal Care and Households, Entertainment, Retail, Food and Beverages, Telecom, BFSI, and Others)

By Format Type (Billboard, Transit, Street Furniture, and Others)

By Application (Indoor and Outdoor)


Digital Out-Of-Home Market, Regional Analysis North America (US, Canada, Mexico)

Europe (Germany, UK, France, Italy, Spain, and Rest of Europe)

Asia Pacific (China, India, Japan, South Korea, South East Asia, and Rest of Asia Pacific)

Latin America (Brazil, Argentina, and Rest of Latin America)

Middle East and Africa (GCC Countries, South Africa, and Rest of the Middle East and Africa)

Digital Out-Of-Home Market Key Companies Clear Channel Outdoor Holdings, Inc., Broadsign International, Inc, Daktronics, Inc, JCDecaux SA, Lamar Advertising Company, NEC Corporation, Ooh!mediaLtd, Outfront Media Inc, Samsung Electronics Co. Ltd, MvixInc
Digital Out-Of-Home Market Competitive Landscape Market Share Analysis

Competitive Benchmarking

Key Players Market Positioning

Geographical Presence Analysis

Major Strategies Adopted

Segmentation of Global Digital Out-Of-Home Market-

Global Digital Out-Of-Home Market – By End-User

  • Automotive
  • Personal Care and Households
  • Entertainment
  • Retail
  • Food and Beverages
  • Telecom
  • BFSI
  • Others

Global Digital Out-Of-Home Market – By Format Type

  • Billboard
  • Transit
  • Street Furniture
  • Others

Global Digital Out-Of-Home Market – By Application

  • Indoor
  • Outdoor

Global Digital Out-Of-Home Market – By Region

  • North America
    • U.S.
    • Canada
    • Mexico
  • Europe
    • Germany
    • France
    • U.K.
    • Italy
    • Spain
    • Rest of Europe
  • Asia Pacific
    • China
    • Japan
    • India
    • South Korea
    • South-east Asia
    • Rest of Asia Pacific
  • Latin America
    • Brazil
    • Argentina
    • Rest of Latin America
  • Middle East & Africa
    • GCC Countries
    • South Africa
    • Rest of the Middle East and Africa

1. Preface
1.1. Report Description
1.1.1. Purpose of the Report
1.1.2. Target Audience
1.1.3. USP and Key Offerings
1.2. Research Scope
1.3. Research Methodology
1.3.1. Phase I – Secondary Research
1.3.2. Phase II – Data Modelling
1.3.2.1. Company Share Analysis Model
1.3.2.2. Revenue Based Modelling
1.3.3. Phase III – Primary Research
1.3.4. Research Limitations
1.3.5. Assumptions
1.4. Market Introduction
1.5. Market Research Scope

2. Executive Summary
2.1. Market Snapshot: Global Digital Out-Of-Home Market
2.2. Global Digital Out-Of-Home Market, By End-User
2.3. Global Digital Out-Of-Home Market, By Format Type
2.4. Global Digital Out-Of-Home Market, By Application
2.5. Global Digital Out-Of-Home Market, By Region

3. Market Dynamics & Factors Analysis
3.1. Introduction
3.1.1. Global Digital Out-Of-Home Market Value, 2017-2030, (US$ Mn)
3.1.2. Y-o-Y Growth Trend Analysis
3.2. Market Dynamics
3.2.1. Market Drivers
3.2.1.1. Driver 1
3.2.1.2. Driver 2
3.2.1.3. Driver 3
3.2.2. Market Restraints
3.2.2.1. Restraint 1
3.2.2.2. Restraint 2
3.2.3. Market Opportunities
3.2.3.1. Opportunity 1
3.2.3.2. Opportunity 2
3.2.4. Major Industry Challenges
3.2.4.1. Challenge 1
3.2.4.2. Challenge 2
3.3. Growth and Development Patterns
3.4. Investment Feasibility Analysis
3.5. Market Opportunity Analysis
3.5.1. End-User
3.5.2. Format Type
3.5.3. Application
3.5.4. Geography

4. Premium Insights
4.1. STAR (Situation, Task, Action, Results) Analysis
4.2. Porter’s Five Forces Analysis
4.2.1. Threat of New Entrants
4.2.2. Bargaining Power of Buyers/Consumers
4.2.3. Bargaining Power of Suppliers
4.2.4. Threat of Substitute Types
4.2.5. Intensity of Competitive Rivalry
4.3. Key Market Trends
4.3.1. Demand Side Trends
4.3.2. Supply Side Trends
4.4. Value Chain Analysis
4.5. End-User Analysis
4.6. Analysis and Recommendations
4.7. Marketing Strategy Analysis
4.7.1. Billboard Marketing
4.7.2. InBillboard Marketing
4.7.3. Marketing Channel Development Trend

5. Market Positioning of Key Players, 2022
5.1. Company market share of key players, 2022
5.2. Competitive Benchmarking
5.3. Market Positioning of Key Vendors
5.4. Geographical Presence Analysis
5.5. Major Strategies Adopted by Key Players
5.5.1. Key Strategies Analysis
5.5.2. Mergers and Acquisitions
5.5.3. Partnerships
5.5.4. Product Launch
5.5.5. Geographical Expansion
5.5.6. Others

6. Economic Impact Analysis
6.1. Recession Impact
6.1.1. North America
6.1.2. Europe
6.1.3. Asia Pacific
6.1.4. Latin America
6.1.5. Middle East and Africa
6.2. Ukraine-Russia War Impact
6.2.1. North America
6.2.2. Europe
6.2.3. Asia Pacific
6.2.4. Latin America
6.2.5. Middle East and Africa
6.3. COVID-19 Impact Analysis
6.3.1. North America
6.3.2. Europe
6.3.3. Asia Pacific
6.3.4. Latin America
6.3.5. Middle East and Africa

7. Global Digital Out-Of-Home Market, By End-User
7.1. Global Digital Out-Of-Home Market Overview, by End-User
7.1.1. Global Digital Out-Of-Home Market Revenue Share, By End-User, 2022 Vs 2030 (in %)
7.2. Automotive
7.2.1. Global Digital Out-Of-Home Market, By Region, 2017-2030 (US$ Mn)
7.3. Personal Care and Households
7.3.1. Global Digital Out-Of-Home Market, By Region, 2017-2030 (US$ Mn)
7.4. Entertainment
7.4.1. Global Digital Out-Of-Home Market, By Region, 2017-2030 (US$ Mn)
7.5. Retail
7.5.1. Global Digital Out-Of-Home Market, By Region, 2017-2030 (US$ Mn)
7.6. Food and Beverages
7.6.1. Global Digital Out-Of-Home Market, By Region, 2017-2030 (US$ Mn)
7.7. Telecom
7.7.1. Global Digital Out-Of-Home Market, By Region, 2017-2030 (US$ Mn)
7.8. BFSI
7.8.1. Global Digital Out-Of-Home Market, By Region, 2017-2030 (US$ Mn)
7.9. Others
7.9.1. Global Digital Out-Of-Home Market, By Region, 2017-2030 (US$ Mn)

8. Global Digital Out-Of-Home Market, By Format Type
8.1. Global Digital Out-Of-Home Market Overview, by Format Type
8.1.1. Global Digital Out-Of-Home Market, By Format Type, 2022 vs 2030 (in %)
8.2. Billboard
8.2.1. Global Digital Out-Of-Home Market, By Region, 2017-2030 (US$ Mn)
8.3. Transit
8.3.1. Global Digital Out-Of-Home Market, By Region, 2017-2030 (US$ Mn)
8.4. Street Furniture
8.4.1. Global Digital Out-Of-Home Market, By Region, 2017-2030 (US$ Mn)
8.5. Others
8.5.1. Global Digital Out-Of-Home Market, By Region, 2017-2030 (US$ Mn)

9. Global Digital Out-Of-Home Market, by Application, 2017-2030 (US$ Mn)
9.1. Global Digital Out-Of-Home Market Overview, by Application
9.1.1. Global Digital Out-Of-Home Market, By Application, 2022 vs 2030 (in%)
9.2. Indoor
9.2.1. Global Digital Out-Of-Home Market, By Region, 2017-2030 (US$ Mn)
9.3. Outdoor
9.3.1. Global Digital Out-Of-Home Market, By Region, 2017-2030 (US$ Mn)

10. Global Digital Out-Of-Home Market, By Region
10.1. Global Digital Out-Of-Home Market Overview, by Region
10.1.1. Global Digital Out-Of-Home Market, By Region, 2022 vs 2030 (in%)
10.2. End-User
10.2.1. Global Digital Out-Of-Home Market, By End-User, 2017-2030 (US$ Mn)
10.3. Format Type
10.3.1. Global Digital Out-Of-Home Market, By Format Type, 2017-2030 (US$ Mn)
10.4. Application
10.4.1. Global Digital Out-Of-Home Market, By Application, 2017-2030 (US$ Mn)

11. North America Digital Out-Of-Home Market Analysis
11.1. North America Digital Out-Of-Home Market, by End-User, 2017-2030(US$ Mn)
11.1.1. Overview
11.1.2. SRC Analysis
11.2. North America Digital Out-Of-Home Market, by Format Type, 2017-2030(US$ Mn)
11.2.1. Overview
11.2.2. SRC Analysis
11.3. North America Digital Out-Of-Home Market, by Application, 2017-2030(US$ Mn)
11.3.1. Overview
11.3.2. SRC Analysis
11.4. North America Digital Out-Of-Home Market, by Country, 2017-2030 (US$ Mn)
11.4.1. North America Digital Out-Of-Home Market, by Country, 2022 Vs 2030 (in%)
11.4.2. U.S.
11.4.2.1. U.S. Digital Out-Of-Home Market Estimates and Forecast, 2017-2030 (US$ Mn)
11.4.2.2. U.S. Digital Out-Of-Home, By End-User, 2017-2030 (US$ Mn)
11.4.2.3. U.S. Digital Out-Of-Home, By Format Type, 2017-2030 (US$ Mn)
11.4.2.4. U.S. Digital Out-Of-Home, By Application, 2017-2030 (US$ Mn)
11.4.3. Canada
11.4.3.1. Canada Digital Out-Of-Home Market Estimates and Forecast, 2017-2030 (US$ Mn)
11.4.3.2. Canada Digital Out-Of-Home, By End-User, 2017-2030 (US$ Mn)
11.4.3.3. Canada Digital Out-Of-Home, By Format Type, 2017-2030 (US$ Mn)
11.4.3.4. Canada Digital Out-Of-Home, By Application, 2017-2030 (US$ Mn)
11.4.4. Mexico
11.4.4.1. Mexico Digital Out-Of-Home Market Estimates and Forecast, 2017-2030 (US$ Mn)
11.4.4.2. Mexico Digital Out-Of-Home, By End-User, 2017-2030 (US$ Mn)
11.4.4.3. Mexico Digital Out-Of-Home, By Format Type, 2017-2030 (US$ Mn)
11.4.4.4. Mexico Digital Out-Of-Home, By Application, 2017-2030 (US$ Mn)

12. Europe Digital Out-Of-Home Market Analysis
12.1. Europe Digital Out-Of-Home Market, by End-User, 2017-2030(US$ Mn)
12.1.1. Overview
12.1.2. SRC Analysis
12.2. Europe Digital Out-Of-Home Market, by Format Type, 2017-2030(US$ Mn)
12.2.1. Overview
12.2.2. SRC Analysis
12.3. Europe Digital Out-Of-Home Market, by Application, 2017-2030(US$ Mn)
12.3.1. Overview
12.3.2. SRC Analysis
12.4. Europe Digital Out-Of-Home Market, by Country, 2017-2030 (US$ Mn)
12.4.1. Europe Digital Out-Of-Home Market, by Country, 2022 Vs 2030 (in%)
12.4.2. Germany
12.4.2.1. Germany Digital Out-Of-Home Market Estimates and Forecast, 2017-2030 (US$ Mn)
12.4.2.2. Germany Digital Out-Of-Home, By End-User, 2017-2030 (US$ Mn)
12.4.2.3. Germany Digital Out-Of-Home, By Format Type, 2017-2030 (US$ Mn)
12.4.2.4. Germany Digital Out-Of-Home, By Application, 2017-2030 (US$ Mn)
12.4.3. France
12.4.3.1. France Digital Out-Of-Home Market Estimates and Forecast, 2017-2030 (US$ Mn)
12.4.3.2. France Digital Out-Of-Home, By End-User, 2017-2030 (US$ Mn)
12.4.3.3. France Digital Out-Of-Home, By Format Type, 2017-2030 (US$ Mn)
12.4.3.4. France Digital Out-Of-Home, By Application, 2017-2030 (US$ Mn)
12.4.4. UK
12.4.4.1. UK Digital Out-Of-Home Market Estimates and Forecast, 2017-2030 (US$ Mn)
12.4.4.2. UK Digital Out-Of-Home, By End-User, 2017-2030 (US$ Mn)
12.4.4.3. UK Digital Out-Of-Home, By Format Type, 2017-2030 (US$ Mn)
12.4.4.4. UK Digital Out-Of-Home, By Application, 2017-2030 (US$ Mn)
12.4.5. Italy
12.4.5.1. Italy Digital Out-Of-Home Market Estimates and Forecast, 2017-2030 (US$ Mn)
12.4.5.2. Italy Digital Out-Of-Home, By End-User, 2017-2030 (US$ Mn)
12.4.5.3. Italy Digital Out-Of-Home, By Format Type, 2017-2030 (US$ Mn)
12.4.5.4. Italy Digital Out-Of-Home, By Application, 2017-2030 (US$ Mn)
12.4.6. Spain
12.4.6.1. Spain Digital Out-Of-Home Market Estimates and Forecast, 2017-2030 (US$ Mn)
12.4.6.2. Spain Digital Out-Of-Home, By End-User, 2017-2030 (US$ Mn)
12.4.6.3. Spain Digital Out-Of-Home, By Format Type, 2017-2030 (US$ Mn)
12.4.6.4. Spain Digital Out-Of-Home, By Application, 2017-2030 (US$ Mn)
12.4.7. Rest of Europe
12.4.7.1. Rest of Europe Digital Out-Of-Home Market Estimates and Forecast, 2017-2030 (US$ Mn)
12.4.7.2. Rest of Europe Digital Out-Of-Home, By End-User, 2017-2030 (US$ Mn)
12.4.7.3. Rest of Europe Digital Out-Of-Home, By Format Type, 2017-2030 (US$ Mn)
12.4.7.4. Rest of Europe Digital Out-Of-Home, By Application, 2017-2030 (US$ Mn)

13. Asia Pacific Digital Out-Of-Home Market Analysis
13.1. Asia Pacific Digital Out-Of-Home Market, by End-User, 2017-2030(US$ Mn)
13.1.1. Overview
13.1.2. SRC Analysis
13.2. Asia Pacific Digital Out-Of-Home Market, by Format Type, 2017-2030(US$ Mn)
13.2.1. Overview
13.2.2. SRC Analysis
13.3. Asia Pacific Digital Out-Of-Home Market, by Application, 2017-2030(US$ Mn)
13.3.1. Overview
13.3.2. SRC Analysis
13.4. Asia Pacific Digital Out-Of-Home Market, by Country, 2017-2030 (US$ Mn)
13.4.1. Asia Pacific Digital Out-Of-Home Market, by Country, 2022 Vs 2030 (in%)
13.4.2. China
13.4.2.1. China Digital Out-Of-Home Market Estimates and Forecast, 2017-2030 (US$ Mn)
13.4.2.2. China Digital Out-Of-Home, By End-User, 2017-2030 (US$ Mn)
13.4.2.3. China Digital Out-Of-Home, By Format Type, 2017-2030 (US$ Mn)
13.4.2.4. China Digital Out-Of-Home, By Application, 2017-2030 (US$ Mn)
13.4.3. Japan
13.4.3.1. Japan Digital Out-Of-Home Market Estimates and Forecast, 2017-2030 (US$ Mn)
13.4.3.2. Japan Digital Out-Of-Home, By End-User, 2017-2030 (US$ Mn)
13.4.3.3. Japan Digital Out-Of-Home, By Format Type, 2017-2030 (US$ Mn)
13.4.3.4. Japan Digital Out-Of-Home, By Application, 2017-2030 (US$ Mn)
13.4.4. India
13.4.4.1. India Digital Out-Of-Home Market Estimates and Forecast, 2017-2030 (US$ Mn)
13.4.4.2. India Digital Out-Of-Home, By End-User, 2017-2030 (US$ Mn)
13.4.4.3. India Digital Out-Of-Home, By Format Type, 2017-2030 (US$ Mn)
13.4.4.4. India Digital Out-Of-Home, By Application, 2017-2030 (US$ Mn)
13.4.5. South Korea
13.4.5.1. South Korea Digital Out-Of-Home Market Estimates and Forecast, 2017-2030 (US$ Mn)
13.4.5.2. South Korea Digital Out-Of-Home, By End-User, 2017-2030 (US$ Mn)
13.4.5.3. South Korea Digital Out-Of-Home, By Format Type, 2017-2030 (US$ Mn)
13.4.5.4. South Korea Digital Out-Of-Home, By Application, 2017-2030 (US$ Mn)
13.4.6. South-East Asia
13.4.6.1. South-East Asia Digital Out-Of-Home Market Estimates and Forecast, 2017-2030 (US$ Mn)
13.4.6.2. South-East Asia Digital Out-Of-Home, By End-User, 2017-2030 (US$ Mn)
13.4.6.3. South-East Asia Digital Out-Of-Home, By Format Type, 2017-2030 (US$ Mn)
13.4.6.4. South-East Asia Digital Out-Of-Home, By Application, 2017-2030 (US$ Mn)
13.4.7. Rest of Asia Pacific
13.4.7.1. Rest of Asia Pacific Digital Out-Of-Home Market Estimates and Forecast, 2017-2030 (US$ Mn)
13.4.7.2. Rest of Asia Pacific Digital Out-Of-Home, By End-User, 2017-2030 (US$ Mn)
13.4.7.3. Rest of Asia Pacific Digital Out-Of-Home, By Format Type, 2017-2030 (US$ Mn)
13.4.7.4. Rest of Asia Pacific Digital Out-Of-Home, By Application, 2017-2030 (US$ Mn)

14. Latin America Digital Out-Of-Home Market Analysis
14.1. Latin America Digital Out-Of-Home Market, by End-User, 2017-2030(US$ Mn)
14.1.1. Overview
14.1.2. SRC Analysis
14.2. Latin America Digital Out-Of-Home Market, by Format Type, 2017-2030(US$ Mn)
14.2.1. Overview
14.2.2. SRC Analysis
14.3. Latin America Digital Out-Of-Home Market, by Application, 2017-2030(US$ Mn)
14.3.1. Overview
14.3.2. SRC Analysis
14.4. Latin America Digital Out-Of-Home Market, by Country, 2017-2030 (US$ Mn)
14.4.1. Latin America Digital Out-Of-Home Market, by Country, 2022 Vs 2030 (in%)
14.4.2. Brazil
14.4.2.1. Brazil Digital Out-Of-Home Market Estimates and Forecast, 2017-2030 (US$ Mn)
14.4.2.2. Brazil Digital Out-Of-Home, By End-User, 2017-2030 (US$ Mn)
14.4.2.3. Brazil Digital Out-Of-Home, By Format Type, 2017-2030 (US$ Mn)
14.4.2.4. Brazil Digital Out-Of-Home, By Application, 2017-2030 (US$ Mn)
14.4.3. Argentina
14.4.3.1. Argentina Digital Out-Of-Home Market Estimates and Forecast, 2017-2030 (US$ Mn)
14.4.3.2. Argentina Digital Out-Of-Home, By End-User, 2017-2030 (US$ Mn)
14.4.3.3. Argentina Digital Out-Of-Home, By Format Type, 2017-2030 (US$ Mn)
14.4.3.4. Argentina Digital Out-Of-Home, By Application, 2017-2030 (US$ Mn)
14.4.4. Rest of Latin America
14.4.4.1. Rest of Latin America Digital Out-Of-Home Market Estimates and Forecast, 2017-2030 (US$ Mn)
14.4.4.2. Rest of Latin America Digital Out-Of-Home, By End-User, 2017-2030 (US$ Mn)
14.4.4.3. Rest of Latin America Digital Out-Of-Home, By Format Type, 2017-2030 (US$ Mn)
14.4.4.4. Rest of Latin America Digital Out-Of-Home, By Application, 2017-2030 (US$ Mn)

15. Middle East and Africa Digital Out-Of-Home Market Analysis
15.1. Middle East and Africa Digital Out-Of-Home Market, by End-User, 2017-2030(US$ Mn)
15.1.1. Overview
15.1.2. SRC Analysis
15.2. Middle East and Africa Digital Out-Of-Home Market, by Format Type, 2017-2030(US$ Mn)
15.2.1. Overview
15.2.2. SRC Analysis
15.3. Middle East and Africa Digital Out-Of-Home Market, by Application, 2017-2030(US$ Mn)
15.3.1. Overview
15.3.2. SRC Analysis
15.4. Middle East and Africa Digital Out-Of-Home Market, by Country, 2017-2030 (US$ Mn)
15.4.1. Middle East and Africa Digital Out-Of-Home Market, by Country, 2022 Vs 2030 (in%)
15.4.2. GCC Countries
15.4.2.1. GCC Countries Digital Out-Of-Home Market Estimates and Forecast, 2017-2030 (US$ Mn)
15.4.2.2. GCC Countries Digital Out-Of-Home, By End-User, 2017-2030 (US$ Mn)
15.4.2.3. GCC Countries Digital Out-Of-Home, By Format Type, 2017-2030 (US$ Mn)
15.4.2.4. GCC Countries Digital Out-Of-Home, By Application, 2017-2030 (US$ Mn)
15.4.3. South Africa
15.4.3.1. South Africa Digital Out-Of-Home Market Estimates and Forecast, 2017-2030 (US$ Mn)
15.4.3.2. South Africa Digital Out-Of-Home, By End-User, 2017-2030 (US$ Mn)
15.4.3.3. South Africa Digital Out-Of-Home, By Format Type, 2017-2030 (US$ Mn)
15.4.3.4. South Africa Digital Out-Of-Home, By Application, 2017-2030 (US$ Mn)
15.4.4. Rest of Middle East and Africa
15.4.4.1. Rest of Middle East and Africa Digital Out-Of-Home Market Estimates and Forecast, 2017-2030 (US$ Mn)
15.4.4.2. Rest of Middle East and Africa Digital Out-Of-Home, By End-User, 2017-2030 (US$ Mn)
15.4.4.3. Rest of Middle East and Africa Digital Out-Of-Home, By Format Type, 2017-2030 (US$ Mn)
15.4.4.4. Rest of Middle East and Africa Digital Out-Of-Home, By Application, 2017-2030 (US$ Mn)

16. Company Profiles
16.1. Clear Channel Outdoor Holdings, Inc.
16.1.1. Company Overview
16.1.2. Products/Services Portfolio
16.1.3. Geographical Presence
16.1.4. Financial Summary
16.1.4.1. Market Revenue and Net Profit (2019-2022)
16.1.4.2. Business Segment Revenue Analysis
16.1.4.3. Geographical Revenue Analysis
16.2. Broadsign International, Inc
16.3. Daktronics, Inc
16.4. JCDecaux SA
16.5. Lamar Advertising Company
16.6. NEC Corporation
16.7. Ooh!mediaLtd
16.8. Outfront Media Inc
16.9. Samsung Electronics Co. Ltd
16.10. MvixInc

List of Figures
FIG. 1 Global Digital Out-Of-Home Market: Research Methodology
FIG. 2 Market Size Estimation – Top Down & Bottom up Approach
FIG. 3 Global Digital Out-Of-Home Market Segmentation
FIG. 4 Global Digital Out-Of-Home Market, by End-User, 2022 (US$ Mn)
FIG. 5 Global Digital Out-Of-Home Market, by Format Type, 2022 (US$ Mn)
FIG. 6 Global Digital Out-Of-Home Market, by Application, 2022 (US$ Mn)
FIG. 7 Global Digital Out-Of-Home Market, by Geography, 2022 (US$ Mn)
FIG. 8 Attractive Investment Proposition, by End-User, 2022
FIG. 9 Attractive Investment Proposition, by Format Type, 2022
FIG. 10 Attractive Investment Proposition, by Application, 2022
FIG. 11 Attractive Investment Proposition, by Geography, 2022
FIG. 12 Global Market Share Analysis of Key Digital Out-Of-Home Market Manufacturers, 2022
FIG. 13 Global Market Positioning of Key Digital Out-Of-Home Market Manufacturers, 2022
FIG. 14 Global Digital Out-Of-Home Market Value Contribution, By End-User, 2022 & 2030 (Value %)
FIG. 15 Global Digital Out-Of-Home Market, by Automotive, Value, 2017-2030 (US$ Mn)
FIG. 16 Global Digital Out-Of-Home Market, by Personal Care and Households, Value, 2017-2030 (US$ Mn)
FIG. 17 Global Digital Out-Of-Home Market, by Entertainment, Value, 2017-2030 (US$ Mn)
FIG. 18 Global Digital Out-Of-Home Market, by Retail, Value, 2017-2030 (US$ Mn)
FIG. 19 Global Digital Out-Of-Home Market, by Food and Beverages, Value, 2017-2030 (US$ Mn)
FIG. 20 Global Digital Out-Of-Home Market, by Telecom, Value, 2017-2030 (US$ Mn)
FIG. 21 Global Digital Out-Of-Home Market, by BFSI, Value, 2017-2030 (US$ Mn)
FIG. 22 Global Digital Out-Of-Home Market, by Others, Value, 2017-2030 (US$ Mn)
FIG. 23 Global Digital Out-Of-Home Market Value Contribution, By Format Type, 2022 & 2030 (Value %)
FIG. 24 Global Digital Out-Of-Home Market, by Billboard, Value, 2017-2030 (US$ Mn)
FIG. 25 Global Digital Out-Of-Home Market, by Transit, 2017-2030 (US$ Mn)
FIG. 26 Global Digital Out-Of-Home Market, by Street Furniture, 2017-2030 (US$ Mn)
FIG. 27 Global Digital Out-Of-Home Market, by Others, 2017-2030 (US$ Mn)
FIG. 28 Global Digital Out-Of-Home Market Value Contribution, By Application, 2022 & 2030 (Value %)
FIG. 29 Global Digital Out-Of-Home Market, by Indoor, Value, 2017-2030 (US$ Mn)
FIG. 30 Global Digital Out-Of-Home Market, by Outdoor, 2017-2030 (US$ Mn)
FIG. 31 North America Digital Out-Of-Home Market, 2017-2030 (US$ Mn)
FIG. 32 U.S. Digital Out-Of-Home Market, 2017-2030 (US$ Mn)
FIG. 33 Canada Digital Out-Of-Home Market, 2017-2030 (US$ Mn)
FIG. 34 Europe Digital Out-Of-Home Market, 2017-2030 (US$ Mn)
FIG. 35 Germany Digital Out-Of-Home Market, 2017-2030 (US$ Mn)
FIG. 36 France Digital Out-Of-Home Market, 2017-2030 (US$ Mn)
FIG. 37 U.K. Digital Out-Of-Home Market, 2017-2030 (US$ Mn)
FIG. 38 Italy Digital Out-Of-Home Market, 2017-2030 (US$ Mn)
FIG. 39 Spain Digital Out-Of-Home Market, 2017-2030 (US$ Mn)
FIG. 40 Rest of Europe Digital Out-Of-Home Market, 2017-2030 (US$ Mn)
FIG. 41 Asia Pacific Digital Out-Of-Home Market, 2017-2030 (US$ Mn)
FIG. 42 China Digital Out-Of-Home Market, 2017-2030 (US$ Mn)
FIG. 43 Japan Digital Out-Of-Home Market, 2017-2030 (US$ Mn)
FIG. 44 India Digital Out-Of-Home Market, 2017-2030 (US$ Mn)
FIG. 45 South Korea Digital Out-Of-Home Market, 2017-2030 (US$ Mn)
FIG. 46 South-East Asia Digital Out-Of-Home Market, 2017-2030 (US$ Mn)
FIG. 47 Rest of Asia Pacific Digital Out-Of-Home Market, 2017-2030 (US$ Mn)
FIG. 48 Latin America Digital Out-Of-Home Market, 2017-2030 (US$ Mn)
FIG. 49 Brazil Digital Out-Of-Home Market, 2017-2030 (US$ Mn)
FIG. 50 Mexico Digital Out-Of-Home Market, 2017-2030 (US$ Mn)
FIG. 51 Rest of Latin America Digital Out-Of-Home Market, 2017-2030 (US$ Mn)
FIG. 52 Middle East & Africa Digital Out-Of-Home Market, 2017-2030 (US$ Mn)
FIG. 53 GCC Countries Digital Out-Of-Home Market, 2017-2030 (US$ Mn)
FIG. 54 South Africa Digital Out-Of-Home Market, 2017-2030 (US$ Mn)
FIG. 55 Rest of Middle East and Africa Digital Out-Of-Home Market, 2017-2030 (US$ Mn)

List of Tables
TABLE 1 Market Snapshot: Global Digital Out-Of-Home Market
TABLE 2 Global Digital Out-Of-Home Market: Market Drivers Impact Analysis
TABLE 3 Global Digital Out-Of-Home Market: Market Restraints Impact Analysis
TABLE 4 Global Digital Out-Of-Home Market, by Competitive Benchmarking, 2022
TABLE 5 Global Digital Out-Of-Home Market, by Geographical Presence Analysis, 2022
TABLE 6 Global Digital Out-Of-Home Market, by Key Strategies Analysis, 2022
TABLE 7 Global Digital Out-Of-Home Market, by Automotive, By Region, 2017-2022 (US$ Mn)
TABLE 8 Global Digital Out-Of-Home Market, by Automotive, By Region, 2023-2030 (US$ Mn)
TABLE 9 Global Digital Out-Of-Home Market, by Personal Care and Households, By Region, 2017-2022 (US$ Mn)
TABLE 10 Global Digital Out-Of-Home Market, by Personal Care and Households, By Region, 2023-2030 (US$ Mn)
TABLE 11 Global Digital Out-Of-Home Market, by Entertainment, By Region, 2017-2022 (US$ Mn)
TABLE 12 Global Digital Out-Of-Home Market, by Entertainment, By Region, 2023-2030 (US$ Mn)
TABLE 13 Global Digital Out-Of-Home Market, by Retail, By Region, 2017-2022 (US$ Mn)
TABLE 14 Global Digital Out-Of-Home Market, by Retail, By Region, 2023-2030 (US$ Mn)
TABLE 15 Global Digital Out-Of-Home Market, by Food and Beverages, By Region, 2017-2022 (US$ Mn)
TABLE 16 Global Digital Out-Of-Home Market, by Food and Beverages, By Region, 2023-2030 (US$ Mn)
TABLE 17 Global Digital Out-Of-Home Market, by Telecom, By Region, 2017-2022 (US$ Mn)
TABLE 18 Global Digital Out-Of-Home Market, by Telecom, By Region, 2023-2030 (US$ Mn)
TABLE 19 Global Digital Out-Of-Home Market, by BFSI, By Region, 2017-2022 (US$ Mn)
TABLE 20 Global Digital Out-Of-Home Market, by BFSI, By Region, 2023-2030 (US$ Mn)
TABLE 21 Global Digital Out-Of-Home Market, by Others, By Region, 2017-2022 (US$ Mn)
TABLE 22 Global Digital Out-Of-Home Market, by Others, By Region, 2023-2030 (US$ Mn)
TABLE 23 Global Digital Out-Of-Home Market, by Billboard, By Region, 2017-2022 (US$ Mn)
TABLE 24 Global Digital Out-Of-Home Market, by Billboard, By Region, 2023-2030 (US$ Mn)
TABLE 25 Global Digital Out-Of-Home Market, by Transit, By Region, 2017-2022 (US$ Mn)
TABLE 26 Global Digital Out-Of-Home Market, by Transit, By Region, 2023-2030 (US$ Mn)
TABLE 27 Global Digital Out-Of-Home Market, by Street Furniture, By Region, 2017-2022 (US$ Mn)
TABLE 28 Global Digital Out-Of-Home Market, by Street Furniture, By Region, 2023-2030 (US$ Mn)
TABLE 29 Global Digital Out-Of-Home Market, by Others, By Region, 2017-2022 (US$ Mn)
TABLE 30 Global Digital Out-Of-Home Market, by Others, By Region, 2023-2030 (US$ Mn)
TABLE 31 Global Digital Out-Of-Home Market, by Indoor, By Region, 2017-2022 (US$ Mn)
TABLE 32 Global Digital Out-Of-Home Market, by Indoor, By Region, 2023-2030 (US$ Mn)
TABLE 33 Global Digital Out-Of-Home Market, by Outdoors, By Region, 2017-2022 (US$ Mn)
TABLE 34 Global Digital Out-Of-Home Market, by Outdoors, By Region, 2023-2030 (US$ Mn)
TABLE 35 Global Digital Out-Of-Home Market, by End-User, 2017-2022 (US$ Mn)
TABLE 36 Global Digital Out-Of-Home Market, by End-User, 2023-2030 (US$ Mn)
TABLE 37 Global Digital Out-Of-Home Market, by Modes of Sales, 2017-2022 (US$ Mn)
TABLE 38 Global Digital Out-Of-Home Market, by Modes of Sales, 2023-2030 (US$ Mn)
TABLE 39 Global Digital Out-Of-Home Market, by Application, 2017-2022 (US$ Mn)
TABLE 40 Global Digital Out-Of-Home Market, by Application, 2023-2030 (US$ Mn)
TABLE 41 Global Digital Out-Of-Home Market, by Region, 2017-2022 (US$ Mn)
TABLE 42 Global Digital Out-Of-Home Market, by Region, 2023-2030 (US$ Mn)
TABLE 43 North America Digital Out-Of-Home Market, by End-User, 2017-2022 (US$ Mn)
TABLE 44 North America Digital Out-Of-Home Market, by End-User, 2023-2030 (US$ Mn)
TABLE 45 North America Digital Out-Of-Home Market, by Modes of Sales, 2017-2022 (US$ Mn)
TABLE 46 North America Digital Out-Of-Home Market, by Modes of Sales, 2023-2030 (US$ Mn)
TABLE 47 North America Digital Out-Of-Home Market, by Application, 2017-2022 (US$ Mn)
TABLE 48 North America Digital Out-Of-Home Market, by Application, 2023-2030 (US$ Mn)
TABLE 49 North America Digital Out-Of-Home Market, by Country, 2017-2022 (US$ Mn)
TABLE 50 North America Digital Out-Of-Home Market, by Country, 2023-2030 (US$ Mn)
TABLE 51 United States Digital Out-Of-Home Market, by End-User, 2017-2022 (US$ Mn)
TABLE 52 United States Digital Out-Of-Home Market, by End-User, 2023-2030 (US$ Mn)
TABLE 53 United States Digital Out-Of-Home Market, by Modes of Sales, 2017-2022 (US$ Mn)
TABLE 54 United States Digital Out-Of-Home Market, by Modes of Sales, 2023-2030 (US$ Mn)
TABLE 55 United States Digital Out-Of-Home Market, by Application, 2017-2022 (US$ Mn)
TABLE 56 United States Digital Out-Of-Home Market, by Application, 2023-2030 (US$ Mn)
TABLE 57 Canada Digital Out-Of-Home Market, by End-User, 2017-2022 (US$ Mn)
TABLE 58 Canada Digital Out-Of-Home Market, by End-User, 2023-2030 (US$ Mn)
TABLE 59 Canada Digital Out-Of-Home Market, by Modes of Sales, 2017-2022 (US$ Mn)
TABLE 60 Canada Digital Out-Of-Home Market, by Modes of Sales, 2023-2030 (US$ Mn)
TABLE 61 Canada Digital Out-Of-Home Market, by Application, 2017-2022 (US$ Mn)
TABLE 62 Canada Digital Out-Of-Home Market, by Application, 2023-2030 (US$ Mn)
TABLE 63 Mexico Digital Out-Of-Home Market, by End-User, 2017-2022 (US$ Mn)
TABLE 64 Mexico Digital Out-Of-Home Market, by End-User, 2023-2030 (US$ Mn)
TABLE 65 Mexico Digital Out-Of-Home Market, by Modes of Sales, 2017-2022 (US$ Mn)
TABLE 66 Mexico Digital Out-Of-Home Market, by Modes of Sales, 2023-2030 (US$ Mn)
TABLE 67 Mexico Digital Out-Of-Home Market, by Application, 2017-2022 (US$ Mn)
TABLE 68 Mexico Digital Out-Of-Home Market, by Application, 2023-2030 (US$ Mn)
TABLE 69 Europe Digital Out-Of-Home Market, by End-User, 2017-2022 (US$ Mn)
TABLE 70 Europe Digital Out-Of-Home Market, by End-User, 2023-2030 (US$ Mn)
TABLE 71 Europe Digital Out-Of-Home Market, by Format Type, 2017-2022 (US$ Mn)
TABLE 72 Europe Digital Out-Of-Home Market, by Format Type, 2023-2030 (US$ Mn)
TABLE 73 Europe Digital Out-Of-Home Market, by Application, 2017-2022 (US$ Mn)
TABLE 74 Europe Digital Out-Of-Home Market, by Application, 2023-2030 (US$ Mn)
TABLE 75 Europe Digital Out-Of-Home Market, by Country, 2017-2022 (US$ Mn)
TABLE 76 Europe Digital Out-Of-Home Market, by Country, 2023-2030 (US$ Mn)
TABLE 77 Germany Digital Out-Of-Home Market, by End-User, 2017-2022 (US$ Mn)
TABLE 78 Germany Digital Out-Of-Home Market, by End-User, 2023-2030 (US$ Mn)
TABLE 79 Germany Digital Out-Of-Home Market, by Format Type, 2017-2022 (US$ Mn)
TABLE 80 Germany Digital Out-Of-Home Market, by Format Type, 2023-2030 (US$ Mn)
TABLE 81 Germany Digital Out-Of-Home Market, by Application, 2017-2022 (US$ Mn)
TABLE 82 Germany Digital Out-Of-Home Market, by Application, 2023-2030 (US$ Mn)
TABLE 83 France Digital Out-Of-Home Market, by End-User, 2017-2022 (US$ Mn)
TABLE 84 France Digital Out-Of-Home Market, by End-User, 2023-2030 (US$ Mn)
TABLE 85 France Digital Out-Of-Home Market, by Format Type, 2017-2022 (US$ Mn)
TABLE 86 France Digital Out-Of-Home Market, by Format Type, 2023-2030 (US$ Mn)
TABLE 87 France Digital Out-Of-Home Market, by Application, 2017-2022 (US$ Mn)
TABLE 88 France Digital Out-Of-Home Market, by Application, 2023-2030 (US$ Mn)
TABLE 89 United Kingdom Digital Out-Of-Home Market, by End-User, 2017-2022 (US$ Mn)
TABLE 90 United Kingdom Digital Out-Of-Home Market, by End-User, 2023-2030 (US$ Mn)
TABLE 91 United Kingdom Digital Out-Of-Home Market, by Format Type, 2017-2022 (US$ Mn)
TABLE 92 United Kingdom Digital Out-Of-Home Market, by Format Type, 2023-2030 (US$ Mn)
TABLE 93 United Kingdom Digital Out-Of-Home Market, by Application, 2017-2022 (US$ Mn)
TABLE 94 United Kingdom Digital Out-Of-Home Market, by Application, 2023-2030 (US$ Mn)
TABLE 95 Italy Digital Out-Of-Home Market, by End-User, 2017-2022 (US$ Mn)
TABLE 96 Italy Digital Out-Of-Home Market, by End-User, 2023-2030 (US$ Mn)
TABLE 97 Italy Digital Out-Of-Home Market, by Format Type, 2017-2022 (US$ Mn)
TABLE 98 Italy Digital Out-Of-Home Market, by Format Type, 2023-2030 (US$ Mn)
TABLE 99 Italy Digital Out-Of-Home Market, by Application, 2017-2022 (US$ Mn)
TABLE 100 Italy Digital Out-Of-Home Market, by Application, 2023-2030 (US$ Mn)
TABLE 101 Spain Digital Out-Of-Home Market, by End-User, 2017-2022 (US$ Mn)
TABLE 102 Spain Digital Out-Of-Home Market, by End-User, 2023-2030 (US$ Mn)
TABLE 103 Spain Digital Out-Of-Home Market, by Format Type, 2017-2022 (US$ Mn)
TABLE 104 Spain Digital Out-Of-Home Market, by Format Type, 2023-2030 (US$ Mn)
TABLE 105 Spain Digital Out-Of-Home Market, by Application, 2017-2022 (US$ Mn)
TABLE 106 Spain Digital Out-Of-Home Market, by Application, 2023-2030 (US$ Mn)
TABLE 107 Rest of Europe Digital Out-Of-Home Market, by End-User, 2017-2022 (US$ Mn)
TABLE 108 Rest of Europe Digital Out-Of-Home Market, by End-User, 2023-2030 (US$ Mn)
TABLE 109 Rest of Europe Digital Out-Of-Home Market, by Format Type, 2017-2022 (US$ Mn)
TABLE 110 Rest of Europe Digital Out-Of-Home Market, by Format Type, 2023-2030 (US$ Mn)
TABLE 111 Rest of Europe Digital Out-Of-Home Market, by Application, 2017-2022 (US$ Mn)
TABLE 112 Rest of Europe Digital Out-Of-Home Market, by Application, 2023-2030 (US$ Mn)
TABLE 113 Asia Pacific Digital Out-Of-Home Market, by End-User, 2017-2022 (US$ Mn)
TABLE 114 Asia Pacific Digital Out-Of-Home Market, by End-User, 2023-2030 (US$ Mn)
TABLE 115 Asia Pacific Digital Out-Of-Home Market, by Format Type, 2017-2022 (US$ Mn)
TABLE 116 Asia Pacific Digital Out-Of-Home Market, by Format Type, 2023-2030 (US$ Mn)
TABLE 117 Asia Pacific Digital Out-Of-Home Market, by Application, 2017-2022 (US$ Mn)
TABLE 118 Asia Pacific Digital Out-Of-Home Market, by Application, 2023-2030 (US$ Mn)
TABLE 119 China Digital Out-Of-Home Market, by End-User, 2017-2022 (US$ Mn)
TABLE 120 China Digital Out-Of-Home Market, by End-User, 2023-2030 (US$ Mn)
TABLE 121 China Digital Out-Of-Home Market, by Format Type, 2017-2022 (US$ Mn)
TABLE 122 China Digital Out-Of-Home Market, by Format Type, 2023-2030 (US$ Mn)
TABLE 123 China Digital Out-Of-Home Market, by Application, 2017-2022 (US$ Mn)
TABLE 124 China Digital Out-Of-Home Market, by Application, 2023-2030 (US$ Mn)
TABLE 125 Japan Digital Out-Of-Home Market, by End-User, 2017-2022 (US$ Mn)
TABLE 126 Japan Digital Out-Of-Home Market, by End-User, 2023-2030 (US$ Mn)
TABLE 127 Japan Digital Out-Of-Home Market, by Format Type, 2017-2022 (US$ Mn)
TABLE 128 Japan Digital Out-Of-Home Market, by Format Type, 2023-2030 (US$ Mn)
TABLE 129 Japan Digital Out-Of-Home Market, by Application, 2017-2022 (US$ Mn)
TABLE 130 Japan Digital Out-Of-Home Market, by Application, 2023-2030 (US$ Mn)
TABLE 131 India Digital Out-Of-Home Market, by End-User, 2017-2022 (US$ Mn)
TABLE 132 India Digital Out-Of-Home Market, by End-User, 2023-2030 (US$ Mn)
TABLE 133 India Digital Out-Of-Home Market, by Format Type, 2017-2022 (US$ Mn)
TABLE 134 India Digital Out-Of-Home Market, by Format Type, 2023-2030 (US$ Mn)
TABLE 135 India Digital Out-Of-Home Market, by Application, 2017-2022 (US$ Mn)
TABLE 136 India Digital Out-Of-Home Market, by Application, 2023-2030 (US$ Mn)
TABLE 137 South Korea Digital Out-Of-Home Market, by End-User, 2017-2022 (US$ Mn)
TABLE 138 South Korea Digital Out-Of-Home Market, by End-User, 2023-2030 (US$ Mn)
TABLE 139 South Korea Digital Out-Of-Home Market, by Format Type, 2017-2022 (US$ Mn)
TABLE 140 South Korea Digital Out-Of-Home Market, by Format Type, 2023-2030 (US$ Mn)
TABLE 141 South Korea Digital Out-Of-Home Market, by Application, 2017-2022 (US$ Mn)
TABLE 142 South Korea Digital Out-Of-Home Market, by Application, 2023-2030 (US$ Mn)
TABLE 143 South-East Asia Digital Out-Of-Home Market, by End-User, 2017-2022 (US$ Mn)
TABLE 144 South-East Asia Digital Out-Of-Home Market, by End-User, 2023-2030 (US$ Mn)
TABLE 145 South-East Asia Digital Out-Of-Home Market, by Format Type, 2017-2022 (US$ Mn)
TABLE 146 South-East Asia Digital Out-Of-Home Market, by Format Type, 2023-2030 (US$ Mn)
TABLE 147 South-East Asia Digital Out-Of-Home Market, by Application, 2017-2022 (US$ Mn)
TABLE 148 South-East Asia Digital Out-Of-Home Market, by Application, 2023-2030 (US$ Mn)
TABLE 149 Rest of Asia Pacific Digital Out-Of-Home Market, by End-User, 2017-2022 (US$ Mn)
TABLE 150 Rest of Asia Pacific Digital Out-Of-Home Market, by End-User, 2023-2030 (US$ Mn)
TABLE 151 Rest of Asia Pacific Digital Out-Of-Home Market, by Format Type, 2017-2022 (US$ Mn)
TABLE 152 Rest of Asia Pacific Digital Out-Of-Home Market, by Format Type, 2023-2030 (US$ Mn)
TABLE 153 Rest of Asia Pacific Digital Out-Of-Home Market, by Application, 2017-2022 (US$ Mn)
TABLE 154 Rest of Asia Pacific Digital Out-Of-Home Market, by Application, 2023-2030 (US$ Mn)
TABLE 155 Latin America Digital Out-Of-Home Market, by End-User, 2017-2022 (US$ Mn)
TABLE 156 Latin America Digital Out-Of-Home Market, by End-User, 2023-2030 (US$ Mn)
TABLE 157 Latin America Digital Out-Of-Home Market, by Format Type, 2017-2022 (US$ Mn)
TABLE 158 Latin America Digital Out-Of-Home Market, by Format Type, 2023-2030 (US$ Mn)
TABLE 159 Latin America Digital Out-Of-Home Market, by Application, 2017-2022 (US$ Mn)
TABLE 160 Latin America Digital Out-Of-Home Market, by Application, 2023-2030 (US$ Mn)
TABLE 161 Brazil Digital Out-Of-Home Market, by End-User, 2017-2022 (US$ Mn)
TABLE 162 Brazil Digital Out-Of-Home Market, by End-User, 2023-2030 (US$ Mn)
TABLE 163 Brazil Digital Out-Of-Home Market, by Format Type, 2017-2022 (US$ Mn)
TABLE 164 Brazil Digital Out-Of-Home Market, by Format Type, 2023-2030 (US$ Mn)
TABLE 165 Brazil Digital Out-Of-Home Market, by Application, 2017-2022 (US$ Mn)
TABLE 166 Brazil Digital Out-Of-Home Market, by Application, 2023-2030 (US$ Mn)
TABLE 167 Argentina Digital Out-Of-Home Market, by End-User, 2017-2022 (US$ Mn)
TABLE 168 Argentina Digital Out-Of-Home Market, by End-User, 2023-2030 (US$ Mn)
TABLE 169 Argentina Digital Out-Of-Home Market, by Format Type, 2017-2022 (US$ Mn)
TABLE 170 Argentina Digital Out-Of-Home Market, by Format Type, 2023-2030 (US$ Mn)
TABLE 171 Argentina Digital Out-Of-Home Market, by Application, 2017-2022 (US$ Mn)
TABLE 172 Argentina Digital Out-Of-Home Market, by Application, 2023-2030 (US$ Mn)
TABLE 173 Rest of Latin America Digital Out-Of-Home Market, by End-User, 2017-2022 (US$ Mn)
TABLE 174 Rest of Latin America Digital Out-Of-Home Market, by End-User, 2023-2030 (US$ Mn)
TABLE 175 Rest of Latin America Digital Out-Of-Home Market, by Format Type, 2017-2022 (US$ Mn)
TABLE 176 Rest of Latin America Digital Out-Of-Home Market, by Format Type, 2023-2030 (US$ Mn)
TABLE 177 Rest of Latin America Digital Out-Of-Home Market, by Application, 2017-2022 (US$ Mn)
TABLE 178 Rest of Latin America Digital Out-Of-Home Market, by Application, 2023-2030 (US$ Mn)
TABLE 179 Middle East and Africa Digital Out-Of-Home Market, by End-User, 2017-2022 (US$ Mn)
TABLE 180 Middle East and Africa Digital Out-Of-Home Market, by End-User, 2023-2030 (US$ Mn)
TABLE 181 Middle East and Africa Digital Out-Of-Home Market, by Format Type, 2017-2022 (US$ Mn)
TABLE 182 Middle East and Africa Digital Out-Of-Home Market, by Format Type, 2023-2030 (US$ Mn)
TABLE 183 Middle East and Africa Digital Out-Of-Home Market, by Application, 2017-2022 (US$ Mn)
TABLE 184 Middle East and Africa Digital Out-Of-Home Market, by Application, 2023-2030 (US$ Mn)
TABLE 185 GCC Countries Digital Out-Of-Home Market, by End-User, 2017-2022 (US$ Mn)
TABLE 186 GCC Countries Digital Out-Of-Home Market, by End-User, 2023-2030 (US$ Mn)
TABLE 187 GCC Countries Digital Out-Of-Home Market, by Format Type, 2017-2022 (US$ Mn)
TABLE 188 GCC Countries Digital Out-Of-Home Market, by Format Type, 2023-2030 (US$ Mn)
TABLE 189 GCC Countries Digital Out-Of-Home Market, by Application, 2017-2022 (US$ Mn)
TABLE 190 GCC Countries Digital Out-Of-Home Market, by Application, 2023-2030 (US$ Mn)
TABLE 191 South Africa Digital Out-Of-Home Market, by End-User, 2017-2022 (US$ Mn)
TABLE 192 South Africa Digital Out-Of-Home Market, by End-User, 2023-2030 (US$ Mn)
TABLE 193 South Africa Digital Out-Of-Home Market, by Format Type, 2017-2022 (US$ Mn)
TABLE 194 South Africa Digital Out-Of-Home Market, by Format Type, 2023-2030 (US$ Mn)
TABLE 195 South Africa Digital Out-Of-Home Market, by Application, 2017-2022 (US$ Mn)
TABLE 196 South Africa Digital Out-Of-Home Market, by Application, 2023-2030 (US$ Mn)
TABLE 197 Rest of Middle East and Africa Digital Out-Of-Home Market, by End-User, 2017-2022 (US$ Mn)
TABLE 198 Rest of Middle East and Africa Digital Out-Of-Home Market, by End-User, 2023-2030 (US$ Mn)
TABLE 199 Rest of Middle East and Africa Digital Out-Of-Home Market, by Format Type, 2017-2022 (US$ Mn)
TABLE 200 Rest of Middle East and Africa Digital Out-Of-Home Market, by Format Type, 2023-2030 (US$ Mn)
TABLE 201 Rest of Middle East and Africa Digital Out-Of-Home Market, by Application, 2017-2022 (US$ Mn)
TABLE 202 Rest of Middle East and Africa Digital Out-Of-Home Market, by Application, 2023-2030 (US$ Mn)

Frequently Asked Questions

How does COVID-19 Impact the global digital out-of-home market?

COVID-19 has had a substantial impact on the market due to the outbreak of the COVID-19 pandemic; the COVID-19 pandemic, however, brought about a number of challenges, including a shortage of skilled workers and project delays or cancellations due to a partial or total lockdown around the world.

Which is the leading region of the market for digital out-of-home?

North America accounted for the most heightened share in the global digital out-of-home market.

What are the key drivers for the growth of the digital out-of-home market?

Increased programmatic advertising spending, with a greater emphasis on business intelligence and rising market competitiveness, can be credited with the expansion of the DOOH market.

Which is the major segment in the digital out-of-home market by end-user?

The retail segment had a major share of the global market in 2022.

Which is the major segment in the digital out-of-home market by format type?

The billboard segment had a major share of the global market.

Saudi Arabia Managed Security Services Market

Published:
Report ID: 36393

Microwave Oven Market

Published:
Report ID: 36314

Inkjet Coders Market

Published:
Report ID: 6669

Rich Communication Services Market

Published:
Report ID: 35774

Middle East and Africa Real-Time Payments Market

Published:
Report ID: 35770

Vietnam Managed Security Services (MSS) Market

Published:
Report ID: 35766

Middle East and Africa EdTech and Smart Classroom Market

Published:
Report ID: 35756

Digital Business Support System (DBSS) Market

Published:
Report ID: 35732

China Artificial Intelligence (AI) Market

Published:
Report ID: 35729

Asia-Pacific Workforce Management Software Market

Published:
Report ID: 35719

Mobile Wallet Market

Published:
Report ID: 8977

Recirculating Chillers Market

Published:
Report ID: 8862

Purchase Options

$2999
Delivery Format: Excel.
$4999
Designed for the individual purchaser.
$6999
Users located at a single corporate site or regional office.
$7999
Allowed for unlimited sharing globally within one company.
Smallform of Sample request

Have a question?

User Profile

Don’t settle for less – trust Mitul to help you find the best solution.

Report delivery within 24 to 48 hours

– Other Info –

What people say?-

User Review

I am very impressed with the information in this report. The author clearly did their research when they came up with this product and it has already given me a lot of ideas.

Jana Schmidt
CEDAR CX Technologies

– Connect with us –

Phone

+91 6232 49 3207


support

24/7 Research Support


sales@credenceresearch.com

– Research Methodology –

Going beyond the basics: advanced techniques in research methodology

– Trusted By –

Pepshi, LG, Nestle
Motorola, Honeywell, Johnson and johnson
LG Chem, SIEMENS, Pfizer
Unilever, Samsonite, QIAGEN