Home » Automation & Process Control » Egg Processing Equipment Market

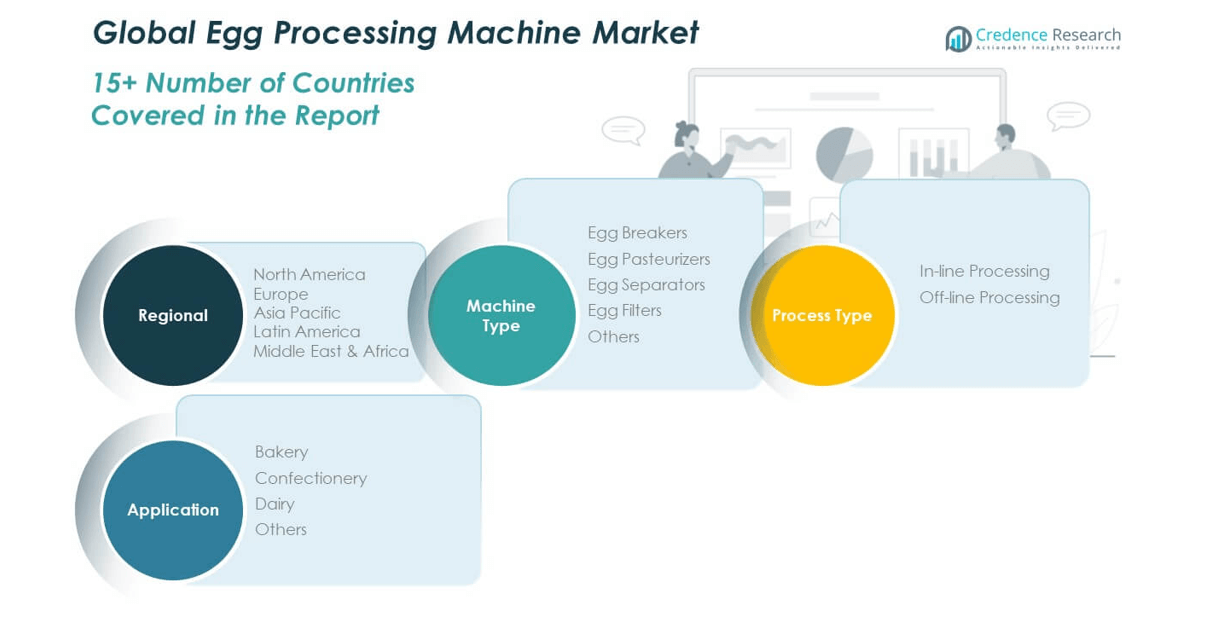
Egg Processing Equipment Market By Equipment Type (Standalone, Assembly), By End-user (Food Processing Industry, Baking & Confectionary Industry, Food Manufacturing & Services Industry, Others) – Growth, Share, Opportunities & Competitive Analysis, 2018 – 2026

Price: $4999

Published: | Report ID: 5047 | Report Format : PDF

Industry Outlook

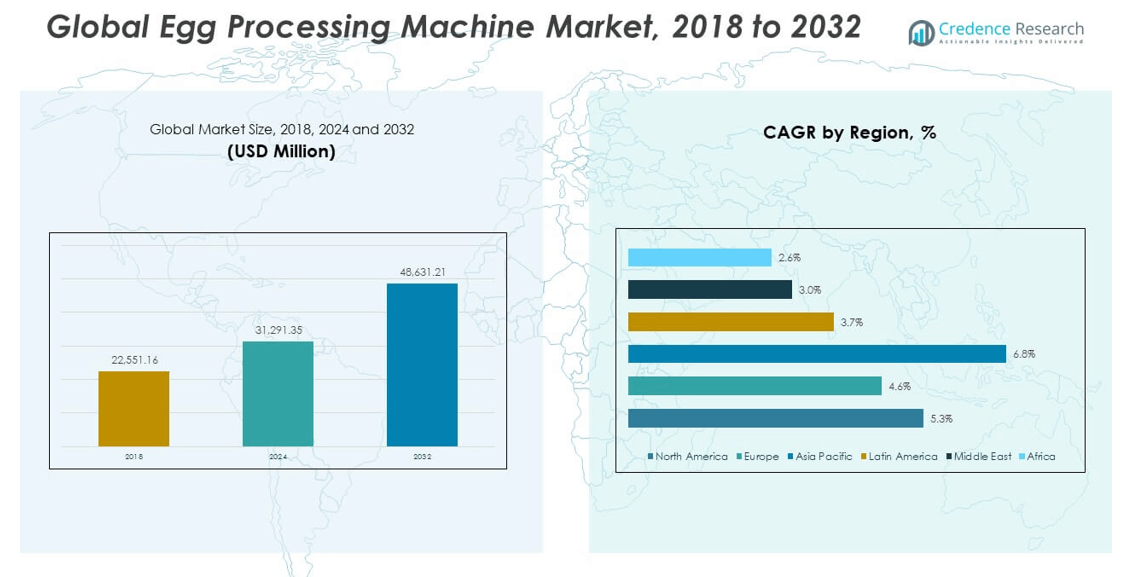
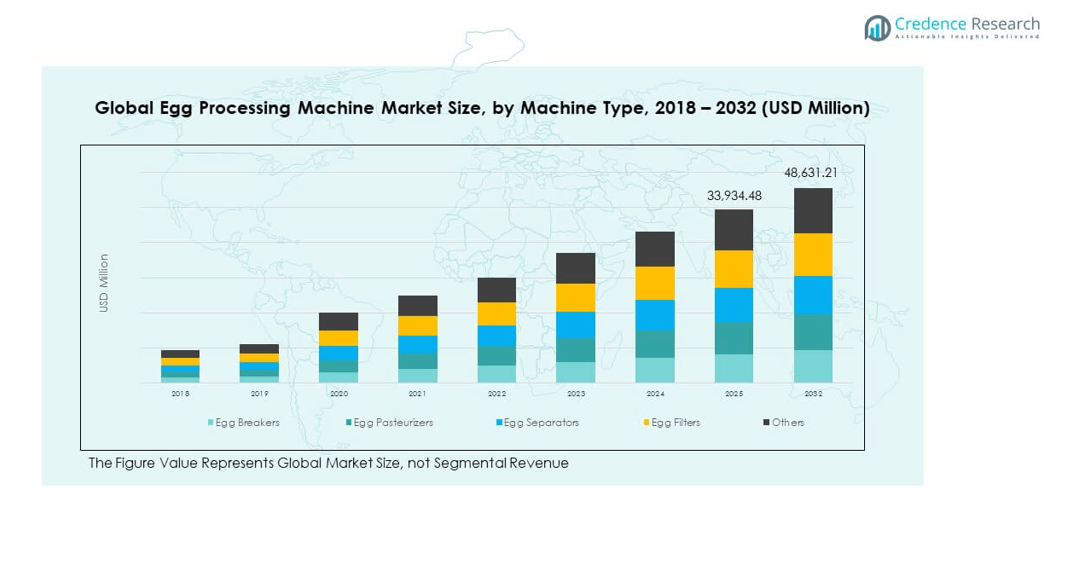
Eggs are regarded as a complete food that contains a variety of essential macro- and micronutrients, making them one of the most gifted food items after milk. Eggs have been a part of the human diet for hundreds of years, and the demand for eggs continues to grow perpetually with the growth in the global population. Eggs are used as the main ingredient in several food preparations, both on residential and commercial platforms. Commercial food industries need to process millions of eggs per day, and the task cannot be performed efficiently without using machines and equipment. The growing food processing industry and the continuously rising demand for eggs certainly encouraged the demand for egg processing equipment. As a result, the egg processing equipment market had a market value of US$ 507 million in 2017 and is expected to reach US$ 699.9 million by 2026, growing at a rate of 3.6% from 2018 to 2026.

Market Synopsis

Standalone Equipment Outperforms Egg Processing Equipment Assembly

A number of egg processing machines, both standalone and assembled, are available, depending on the capacity and nature of the end product required. End-use industries can easily procure a single piece of equipment or customize the assembly required with a turnkey alternative always at their disposal. Loaders, washers, accumulators, breakers, pasteurizers, spray dryers, boilers, and other pieces of equipment are all classified as standalone egg processing equipment. These items are procured individually according to the need and capacity, ensuring a lower procurement cost instead of incorporating complete assembly. According to assembly, the equipment is classified on the basis of egg processing capacity. The assemblies are classified as up to 70,000 eggs/hr, from 70,001 to 200,000 eggs/hr, and above 200,000 eggs/hr. In 2017, standalone egg processing equipment led the equipment type segment in terms of market value. Standalone equipment is projected to retain its dominance over the market throughout the forecast period from 2018 to 2026.

Design Element 2

Access crucial information at unmatched prices!

Request your free sample report today & start making informed decisions powered by Credence Research!

Download Free Sample
CTA Design Element 3

The Food Processing Industry is thriving. Stimulating Egg Processing Equipment Growth

The food processing industry has seen some dramatic changes in recent years, and this trend is expected to continue for a long time. The egg is a vital element in the food group; it is used extensively across several delicacies and is an important component of processed food. Millions of eggs are processed by the food processing industry each day, and hence the industry claims the majority of market share in the egg processing equipment market. The bakery and confectionery industries are closely followed by the segment in terms of market value. Bakery products are relished worldwide on a considerable scale, and egg processing is an essential part of the bakery and confectionary industries. In order to produce large batches of eggs, the industry extensively depends upon egg processing equipment. As a result, the bakery and confectionery industries, along with the food processing industry, account for a sizable portion of the overall market for egg processing equipment.

Asia Pacific Holds the Key to Becoming a Market Leader in the Coming Years Owing to its Vast Population

North America currently holds the title of the most dominant region in the global egg processing equipment market in terms of market value. In 2016, the U.S. produced more than 101.95 billion eggs, and citizens here love to start their days with eggs in some form. This helped the region capture the lion’s share of the market for egg processing equipment. However, the presence of a number of agricultural countries and a vast population is expected to help Asia-Pacific emerge as the new egg-processing equipment market leader in the coming years. Countries such as China, India, Japan, and Indonesia together contribute more than 65% of global egg production, and the continuous proliferation in population stimulates the demand for more eggs and egg products. Consequently, the demand for egg processing equipment has been on a continuous rise for the past few years and is projected to grow in multiples throughout and beyond the forecast period.

Market Segmentation

The big players face tough competition from local manufacturers for market share.

The egg processing equipment market is quite fragmented, characterized by a number of local as well as international manufacturers. The company faces significant obstacles in establishing a presence in mature markets in North America and Europe. Manufacturers’ attention is shifting to the developing regions of the Asia Pacific and Latin America. In addition, the companies are concentrating on product development by adding new features to their existing product lines. The research study includes the business strategies and current progress of a few of the most prominent players in the egg processing equipment market, including Sanovo Technology Group, Actinic Group, OVO Tech, OVOBEL, PELBO S.p.A., Moba Group, Bouwhuis Enthoven BV, Dion Engineering, Midwest BRD, Inc., Ovoconcept, and ZenYer Egg Machinery Co., Ltd., among others.

Shape Your Report to Specific Countries or Regions & Enjoy 30% Off!

Key questions are answered in this report.

  • How have changing food habits and the evolution of food processing equipment helped the egg processing equipment market flourish?
  • Which are the most prominent end users, and how is their growth helping the egg processing equipment market grow?
  • How do standalone equipment and egg equipment assemblies standoff each other in terms of market value?
  • How do geography, demography, and consumers’ choices affect the sales of egg processing equipment?
  • What role do governments worldwide play in promoting egg consumption, and, ultimately, what is their effect on the sales of egg processing equipment?
  • In what ways will agricultural regions like the Asia Pacific and Latin America become game changers in the coming years?

1. Preface
1.1. Report Description
1.1.1. Purpose of the Report
1.1.2. Target Audience
1.1.3. USP and Key Offerings
1.2. Research Scope
1.3. Research Methodology
1.3.1. Phase I-Secondary Research
1.3.2. Phase II-Primary Research
1.3.3. Approach Adopted
1.3.4. Top-Down Approach
1.3.5. Bottom-Up Approach
1.3.6. Phase III-Expert Panel Review
1.3.7. Assumptions
1.4. Market Segmentation

2. Executive Summary
2.1. Global EPE Market Snapshot
2.2. Global EPE Market, by Equipment Type
2.3. Global EPE Market, by End-user
2.4. Global EPE Market, by Geography

3. Global Egg Processing Equipment (EPE) Market Analysis
3.1. Global EPE Market Overview
3.2. Market Inclination Insights
3.3. Market Dynamics
3.3.1. Market Drivers
3.3.2. Market Challenges
3.4. See-Saw Analysis
3.4.1. Impact Analysis
3.5. Attractive Investment Proposition
3.6. Competitive Landscape
3.6.1. Market Positioning of Key Industry Participants
3.6.2. Major Strategies Adopted by Key Industry Participants

4. Global Egg Processing Equipment (EPE) Market Value, by Equipment Type, 2016 – 2026 (US$ Mn)
4.1. Overview
4.1.1. Global EPE Market Value Share, Equipment Type, 2017 & 2026 (Value %)
4.1.2. Global EPE Market Value, Equipment Type, 2016 – 2026 (US$ Mn)
4.2. Standalone
4.2.1. Loader
4.2.1.1. Global Egg Loader Equipment Market, 2016 – 2026 (US$ Mn)
4.2.2. Washer
4.2.2.1. Global Egg Washer Equipment Market, 2016 – 2026 (US$ Mn)
4.2.3. Accumulator
4.2.3.1. Global Egg Accumulator Equipment Market, 2016 – 2026 (US$ Mn)
4.2.4. Breaker
4.2.4.1. Global Egg Breaker Equipment Market, 2016 – 2026 (US$ Mn)
4.2.5. Pasteurizer
4.2.6. Global Egg Pasteurizer Equipment Market, 2016 – 2026 (US$ Mn)
4.2.7. Spray Dryer
4.2.7.1. Global Egg Spray Dryer Equipment Market, 2016 – 2026 (US$ Mn)
4.2.8. Boiler
4.2.8.1. Global Egg Boiler Equipment Market, 2016 – 2026 (US$ Mn)
4.2.9. Other
4.2.9.1. Global Other Egg Equipment Market, 2016 – 2026 (US$ Mn)
4.3. Assembly
4.3.1. Up to 70,000 Eggs/Hr
4.3.1.1. Global Egg Processing Equipment Assembly Market for Capacity Up to 70,000 Eggs/Hr, 2016 – 2026 (US$ Mn)
4.3.2. From 70,001 to 200,000 Eggs/Hr
4.3.2.1. Global Egg Processing Equipment Assembly Market for Capacity From 70,001 to 200,000 Eggs/Hr, 2016 – 2026 (US$ Mn)
4.3.3. Above 200,000 Eggs/Hr
4.3.3.1. Global Egg Processing Equipment Assembly Market for Capacity Above 200,000 Eggs/Hr, 2016 – 2026 (US$ Mn)

5. Global Egg Processing Equipment (EPE) Market Value, by End-user, 2016 – 2026 (US$ Mn)
5.1. Overview
5.1.1. Global EPE Market Value Share, End-user, 2017 & 2026 (Value %)
5.1.2. Global EPE Market Value, End-user, 2016 – 2026 (US$ Mn)
5.2. Food Processing Industry
5.2.1. Global EPE Market for Food Processing Industry, 2016 – 2026 (US$ Mn)
5.3. Baking & Confectionary Industry
5.3.1. Global EPE Market for Baking & Confectionary Industry, 2016 – 2026 (US$ Mn)
5.4. Food Manufacturing & Services Industry
5.4.1. Global EPE Market for Food Manufacturing & Services Industry, 2016 – 2026 (US$ Mn)
5.5. Others
5.5.1. Global EPE Market for Others, 2016 – 2026 (US$ Mn)

6. North America Egg Processing Equipment (EPE) Market Analysis, 2016 – 2026 (US$ Mn)
6.1. Overview
6.1.1. North America EPE Market Value, 2016 – 2026, (US$ Mn)
6.2. North America EPE Market, by Equipment Type, 2016 – 2026 (US$ Mn)
6.2.1. Comparative Analysis
6.3. North America EPE Market, by End-user, 2016 – 2026 (US$ Mn)
6.3.1. Comparative Analysis
6.4. North America EPE Market Value, by Country, 2016 – 2026 (US$ Mn)
6.4.1. U.S.
6.4.1.1. U.S. EPE Market, by Equipment Type, 2016 – 2026 (US$ Mn)
6.4.1.2. U.S. EPE Market, by End-user, 2016 – 2026 (US$ Mn)
6.4.2. Rest of North America
6.4.2.1. Rest of North America EPE Market, by Equipment Type, 2016 – 2026 (US$ Mn)
6.4.2.2. Rest of North America EPE Market, by End-user, 2016 – 2026 (US$ Mn)

7. Europe Egg Processing Equipment (EPE) Market Analysis, 2016 – 2026 (US$ Mn)
7.1. Overview
7.1.1. Europe EPE Market Value, 2016 – 2026, (US$ Mn)
7.2. Europe EPE Market, by Equipment Type, 2016 – 2026 (US$ Mn)
7.2.1. Comparative Analysis
7.3. Europe EPE Market, by End-user, 2016 – 2026 (US$ Mn)
7.3.1. Comparative Analysis
7.4. Europe EPE Market Value, by Country, 2016 – 2026 (US$ Mn)
7.4.1. U.K.
7.4.1.1. U.K. EPE Market, by Equipment Type, 2016 – 2026 (US$ Mn)
7.4.1.2. U.K. EPE Market, by End-user, 2016 – 2026 (US$ Mn)
7.4.2. Germany
7.4.2.1. Germany EPE Market, by Equipment Type, 2016 – 2026 (US$ Mn)
7.4.2.2. Germany EPE Market, by End-user, 2016 – 2026 (US$ Mn)
7.4.3. France
7.4.3.1. France EPE Market, by Equipment Type, 2016 – 2026 (US$ Mn)
7.4.3.2. France EPE Market, by End-user, 2016 – 2026 (US$ Mn)
7.4.4. Rest of Europe
7.4.4.1. Rest of Europe EPE Market, by Equipment Type, 2016 – 2026 (US$ Mn)
7.4.4.2. Rest of Europe EPE Market, by End-user, 2016 – 2026 (US$ Mn)

8. Asia Pacific Egg Processing Equipment (EPE) Market Analysis, 2016 – 2026 (US$ Mn)
8.1. Overview
8.1.1. Asia Pacific EPE Market Value, 2016 – 2026, (US$ Mn)
8.2. Asia Pacific EPE Market, by Equipment Type, 2016 – 2026 (US$ Mn)
8.2.1. Comparative Analysis
8.3. Asia Pacific EPE Market, by End-user, 2016 – 2026 (US$ Mn)
8.3.1. Comparative Analysis
8.4. Asia Pacific EPE Market Value, by Country, 2016 – 2026 (US$ Mn)
8.4.1. China
8.4.1.1. China EPE Market, by Equipment Type, 2016 – 2026 (US$ Mn)
8.4.1.2. China EPE Market, by End-user, 2016 – 2026 (US$ Mn)
8.4.2. Japan
8.4.2.1. Japan EPE Market, by Equipment Type, 2016 – 2026 (US$ Mn)
8.4.2.2. Japan EPE Market, by End-user, 2016 – 2026 (US$ Mn)
8.4.3. India
8.4.3.1. India EPE Market, by Equipment Type, 2016 – 2026 (US$ Mn)
8.4.3.2. India EPE Market, by End-user, 2016 – 2026 (US$ Mn)
8.4.4. Rest of Asia Pacific
8.4.4.1. Rest of Asia Pacific EPE Market, by Equipment Type, 2016 – 2026 (US$ Mn)
8.4.4.2. Rest of Asia Pacific EPE Market, by End-user, 2016 – 2026 (US$ Mn)

9. Rest of World (RoW) Egg Processing Equipment (EPE) Market Analysis, 2016 – 2026 (US$ Mn)
9.1. Overview
9.1.1. RoW EPE Market Value, 2016 – 2026, (US$ Mn)
9.2. RoW EPE Market, by Equipment Type, 2016 – 2026 (US$ Mn)
9.2.1. Comparative Analysis
9.3. RoW EPE Market, by End-user, 2016 – 2026 (US$ Mn)
9.3.1. Comparative Analysis
9.4. RoW EPE Market Value, by Country, 2016 – 2026 (US$ Mn)
9.4.1. Middle East & Africa
9.4.1.1. Middle East & Africa EPE Market, by Equipment Type, 2016 – 2026 (US$ Mn)
9.4.1.2. Middle East & Africa EPE Market, by End-user, 2016 – 2026 (US$ Mn)
9.4.2. Latin America
9.4.2.1. Latin America EPE Market, by Equipment Type, 2016 – 2026 (US$ Mn)
9.4.2.2. Latin America EPE Market, by End-user, 2016 – 2026 (US$ Mn)

10. Company Profiles
10.1. Sanovo Technology Group
10.2. Actinit Group
10.3. OVO Tech
10.4. OVOBEL
10.5. PELBO S.p.A.
10.6. Moba Group
10.7. Bouwhuis Enthoven BV
10.8. Dion Engineering
10.9. Midwest BRD, Inc.
10.10. Ovoconcept
10.11. ZenYer Egg Machinery Co. Ltd.

List of Figures

FIG. 1 Global Egg Processing Equipment (EPE) Market Segmentation
FIG. 2 Global EPE Market: Research Methodology
FIG. 3 Top-Down and Bottom Up Approach
FIG. 4 Global EPE Market Segmentation
FIG. 5 Global EPE Market, by Equipment Type, 2017 (US$ Mn)
FIG. 6 Global EPE Market, by End-user, 2017 (US$ Mn)
FIG. 7 Global EPE Market, by Geography, 2017 (US$ Mn)
FIG. 8 Global EPE Market Value, 2016 – 2026, (US$ Mn)
FIG. 9 See-Saw Analysis : Global EPE Market
FIG. 10 Market Positioning of Key Industry Participants, 2017
FIG. 11 Global EPE Market Value Contribution, by Equipment Type, 2017 & 2026 (Value %)
FIG. 12 Global Egg Loader Equipment Market Value, 2016 – 2026, (US$ Mn)
FIG. 13 Global Egg Washer Equipment Market Value, 2016 – 2026, (US$ Mn)
FIG. 14 Global Egg Accumulator Equipment Market Value, 2016 – 2026, (US$ Mn)
FIG. 15 Global Egg Breaker Equipment Market Value, 2016 – 2026, (US$ Mn)
FIG. 16 Global Egg Pasteurizer Equipment Market Value, 2016 – 2026, (US$ Mn)
FIG. 17 Global Egg Spray Dryer Equipment Market Value, 2016 – 2026, (US$ Mn)
FIG. 18 Global Egg Boiler Equipment Market Value, 2016 – 2026, (US$ Mn)
FIG. 19 Global Other Egg Equipment Market Value, 2016 – 2026, (US$ Mn)
FIG. 20 Global Egg Processing Equipment Assembly Market Value for Capacity Up to 70,000 Eggs/Hr, 2016 – 2026, (US$ Mn)
FIG. 21 Global Egg Processing Equipment Assembly Market Value for Capacity From 70,001 Eggs/Hr to 200,000 Eggs/Hr, 2016 – 2026, (US$ Mn)
FIG. 22 Global Egg Processing Equipment Assembly Market Value for Capcity Above 200,000 Eggs/Hr, 2016 – 2026, (US$ Mn)
FIG. 23 Global EPE Market Value Contribution, by End-user, 2017 & 2026 (Value %)
FIG. 24 Global EPE Market Value for Food Processing Industry, 2016 – 2026, (US$ Mn)
FIG. 25 Global EPE Market Value for Baking & Confectionary Industry, 2016 – 2026, (US$ Mn)
FIG. 26 Global EPE Market Value for Food Manufacturing & Services Industry, 2016 – 2026, (US$ Mn)
FIG. 27 Global EPE Market Value for Other End-user, 2016 – 2026, (US$ Mn)
FIG. 28 North America EPE Market Value, 2016 – 2026, (US$ Mn)
FIG. 29 U.S. EPE Market Value, 2016 – 2026, (US$ Mn)
FIG. 30 Rest of North America EPE Market Value, 2016 – 2026, (US$ Mn)
FIG. 31 Europe EPE Market Value, 2016 – 2026, (US$ Mn)
FIG. 32 U.K. EPE Market Value, 2016 – 2026, (US$ Mn)
FIG. 33 Germany EPE Market Value, 2016 – 2026, (US$ Mn)
FIG. 34 France EPE Market Value, 2016 – 2026, (US$ Mn)
FIG. 35 Rest of Europe EPE Market Value, 2016 – 2026, (US$ Mn)
FIG. 36 Asia Pacific EPE Market Value, 2016 – 2026, (US$ Mn)
FIG. 37 China EPE Market Value, 2016 – 2026, (US$ Mn)
FIG. 38 Japan EPE Market Value, 2016 – 2026, (US$ Mn)
FIG. 39 India EPE Market Value, 2016 – 2026, (US$ Mn)
FIG. 40 Rest of Asia Pacific EPE Market Value, 2016 – 2026, (US$ Mn)
FIG. 41 RoW EPE Market Value, 2017– 2026, (US$ Mn)
FIG. 42 Middle East & Africa EPE Market Value, 2017– 2026, (US$ Mn)
FIG. 43 Latin America EPE Market Value, 2017– 2026, (US$ Mn)

List of Tables

TABLE 1 Market Snapshot: Global Egg Processing Equipment (EPE) Market
TABLE 2 Impact Indicators
TABLE 3 Impact Analysis of Drivers and Restraints
TABLE 4 North America EPE Market Value, by Equipment Type, 2016 – 2026 (US$ Mn)
TABLE 5 North America EPE Market Value, by End-user, 2016 – 2026 (US$ Mn)
TABLE 6 North America EPE Market Value, by Country, 2016 – 2026 (US$ Mn)
TABLE 7 U.S. EPE Market Value, by Equipment Type, 2016 – 2026 (US$ Mn)
TABLE 8 U.S. EPE Market Value, by End-user, 2016 – 2026 (US$ Mn)
TABLE 9 Rest of North America EPE Market Value, by Equipment Typ, 2016 – 2026 (US$ Mn)
TABLE 10 Rest of North America EPE Market Value, by End-user, 2016 – 2026 (US$ Mn)
TABLE 11 Europe EPE Market Value, by Equipment Type, 2016 – 2026 (US$ Mn)
TABLE 12 Europe EPE Market Value, by End-user, 2016 – 2026 (US$ Mn)
TABLE 13 Europe EPE Market Value, by Country, 2016 – 2026 (US$ Mn)
TABLE 14 U.K. EPE Market Value, by Equipment Type, 2016 – 2026 (US$ Mn)
TABLE 15 U.K. EPE Market Value, by End-user, 2016 – 2026 (US$ Mn)
TABLE 16 Germany EPE Market Value, by Equipment Type, 2016 – 2026 (US$ Mn)
TABLE 17 Germany EPE Market Value, by End-user, 2016 – 2026 (US$ Mn)
TABLE 18 France EPE Market Value, by Equipment Type, 2016 – 2026 (US$ Mn)
TABLE 19 France EPE Market Value, by End-user, 2016 – 2026 (US$ Mn)
TABLE 20 Rest of Europe EPE Market Value, by Equipment Type, 2016 – 2026 (US$ Mn)
TABLE 21 Rest of Europe EPE Market Value, by End-user, 2016 – 2026 (US$ Mn)
TABLE 22 Asia Pacific EPE Market Value, by Equipment Type, 2016 – 2026 (US$ Mn)
TABLE 23 Asia Pacific EPE Market Value, by End-user, 2016 – 2026 (US$ Mn)
TABLE 24 Asia Pacific EPE Market Value, by Country, 2016 – 2026 (US$ Mn)
TABLE 25 China EPE Market Value, by Equipment Type, 2016 – 2026 (US$ Mn)
TABLE 26 China EPE Market Value, by End-user, 2016 – 2026 (US$ Mn)
TABLE 27 Japan EPE Market Value, by Equipment Type, 2016 – 2026 (US$ Mn)
TABLE 28 Japan EPE Market Value, by End-user, 2016 – 2026 (US$ Mn)
TABLE 29 India EPE Market Value, by Equipment Type, 2016 – 2026 (US$ Mn)
TABLE 30 India EPE Market Value, by End-user, 2016 – 2026 (US$ Mn)
TABLE 31 Rest of Asia Pacific EPE Market Value, by Equipment Type, 2016 – 2026 (US$ Mn)
TABLE 32 Rest of Asia Pacific EPE Market Value, by End-user, 2016 – 2026 (US$ Mn)
TABLE 33 Rest of World EPE Market Value, by Equipment Type, 2016 – 2026 (US$ Mn)
TABLE 34 Rest of World EPE Market Value, by End-user, 2016 – 2026 (US$ Mn)
TABLE 35 Rest of World EPE Market Value, by Region, 2016 – 2026 (US$ Mn)
TABLE 36 Middle East & Africa EPE Market Value, by Equipment Type, 2016 – 2026 (US$ Mn)
TABLE 37 Middle East & Africa EPE Market Value, by End-user, 2016 – 2026 (US$ Mn)
TABLE 38 Latin America EPE Market Value, by Equipment Type, 2016 – 2026 (US$ Mn)
TABLE 39 Latin America EPE Market Value, by End-user, 2016 – 2026 (US$ Mn)
TABLE 40 Sanovo Technology Group: Company Snapshot (Company Details, Geographical Presence, Product Portfolio, Key Industries Served, Recent Developments)
TABLE 41 Actinit Group: Company Snapshot (Company Details, Geographical Presence, Product Portfolio, Key Industries Served, Recent Developments)
TABLE 42 OVO Tech: Company Snapshot (Company Details, Geographical Presence, Product Portfolio, Key Industries Served, Recent Developments)
TABLE 43 OVOBEL: Company Snapshot (Company Details, Geographical Presence, Product Portfolio, Key Industries Served, Recent Developments)
TABLE 44 PELBO S.p.A.: Company Snapshot (Company Details, Geographical Presence, Product Portfolio, Key Industries Served, Recent Developments)
TABLE 45 Moba Group: Company Snapshot (Company Details, Geographical Presence, Product Portfolio, Key Industries Served, Recent Developments)
TABLE 46 Bouwhuis Enthoven BV: Company Snapshot (Company Details, Geographical Presence, Product Portfolio, Key Industries Served, Recent Developments)
TABLE 47 Dion Engineering: Company Snapshot (Company Details, Geographical Presence, Product Portfolio, Key Industries Served, Recent Developments)
TABLE 48 Midwest BRD, Inc.: Company Snapshot (Company Details, Geographical Presence, Product Portfolio, Key Industries Served, Recent Developments)
TABLE 49 Ovoconcept: Company Snapshot (Company Details, Geographical Presence, Product Portfolio, Key Industries Served, Recent Developments)
TABLE 50 ZenYer Egg Machinery Co. Ltd.: Company Snapshot (Company Details, Geographical Presence, Product Portfolio, Key Industries Served, Recent Developments)

Frequently Asked Questions

What is the size of Egg Processing Equipment Market?

The market for Egg Processing Equipment is expected to reach XX Bn in 2026.

What is the Egg Processing Equipment Market CAGR?

The Egg Processing Equipment market is expected to see significant CAGR growth over the coming years,at XX%.

What is the Forecast period considered for Egg Processing Equipment Market?

The report is forecasted from 2018-2026.

What is the base year considered for Egg Processing Equipment Market?

The base year of this report is 2017.

Who are the major players in this Market?

Sanovo Technology Group,Actinit Group,OVO Tech,OVOBEL,PELBO S.p.A. are some of the major players in the global market

Hydraulic Pumps Market

Published:
Report ID: 7796

Mobile Robotics Market

Published:
Report ID: 8913

Lab Automation in Drug Discovery Market

Published:
Report ID: 32470

Europe Rotary Kiln Market

Published:
Report ID: 30782

Motorized Drive Rollers (MDR) Market

Published:
Report ID: 23506

Cryogenic Valves Market

Published:
Report ID: 22219

Smart Wine Cellar Market

Published:
Report ID: 22795

Rotary Kiln Market

Published:
Report ID: 10095

Raised Access Floor Market

Published:
Report ID: 21868

Carbonitriding Vacuum Furnace Market

Published:
Report ID: 21867

Headless Compression Screws Market

Published:
Report ID: 7126

U.S. Navi Lens Technology Market

Published:
Report ID: 19434

Purchase Options

$2999
Delivery Format: Excel.
$4999
Designed for the individual purchaser.
$6999
Users located at a single corporate site or regional office.
$7999
Allowed for unlimited sharing globally within one company.
Smallform of Sample request

Have a question?

User Profile

Don’t settle for less – trust Mitul to help you find the best solution.

Report delivery within 24 to 48 hours

– Other Info –

What people say?-

User Review

I am very impressed with the information in this report. The author clearly did their research when they came up with this product and it has already given me a lot of ideas.

Jana Schmidt
CEDAR CX Technologies

– Connect with us –

Phone

+91 6232 49 3207


support

24/7 Research Support


sales@credenceresearch.com

– Research Methodology –

Going beyond the basics: advanced techniques in research methodology

– Trusted By –

Pepshi, LG, Nestle
Motorola, Honeywell, Johnson and johnson
LG Chem, SIEMENS, Pfizer
Unilever, Samsonite, QIAGEN