Home » Food & Beverage » Plant Extracts Market

Plant Extracts Market By Type of Extract (Herbal Extracts, Spice and Seasoning Extracts, Fruit Extracts, Vegetable Extracts, Others) By Form of Extract (Liquid Extracts, Powdered Extracts, Capsules and Tablets, Granules and Pellets) By Application (Pharmaceuticals, Food and Beverage, Cosmetics and Personal Care, Others) By Plant Source (Medicinal Plants, Culinary Herbs and Spices, Fruits and Berries, Vegetables, Tea and Coffee Plants, Others) By End Users (Manufacturers, Retailers, Wholesale and Distributors) – Global Growth, Future Prospects & Competitive Analysis, 2022 – 2030

Price: $3699

Published: | Report ID: 26996 | Report Format : PDF

Market Insights

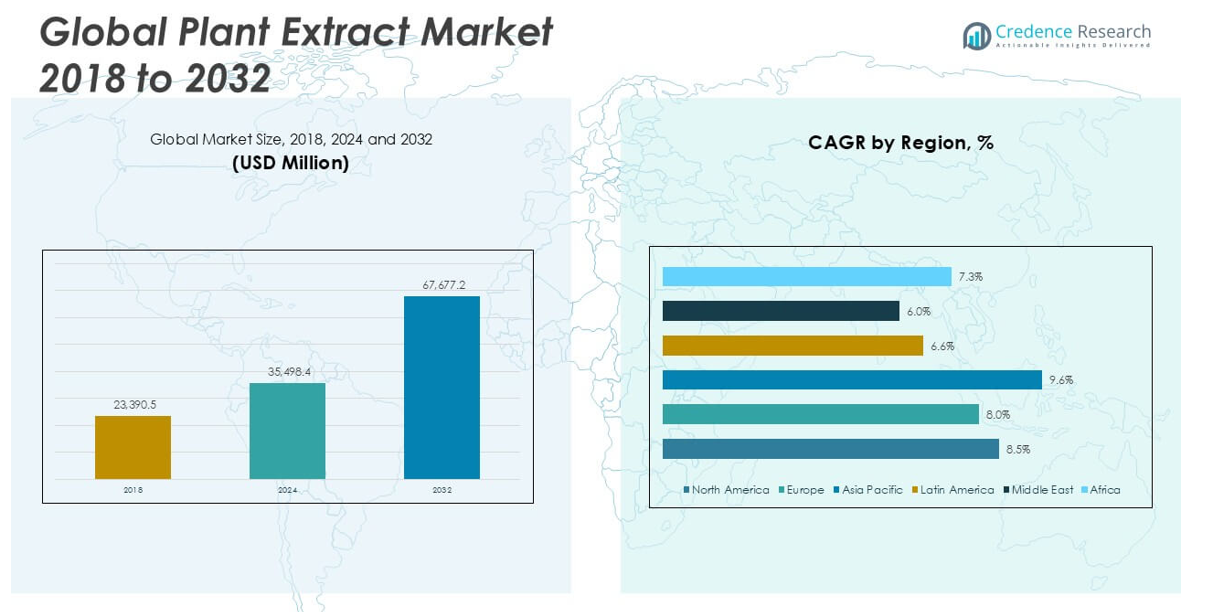
  • The global demand for plant extracts was valued at USD 34154.8 million in 2022 and is expected to reach USD 89520.92 million in 2030, growing at a CAGR of 12.80% between 2023 and 2030.
  • Herbal extracts are the leading segment by type of extract. Oil extracts, on the other hand, are expected to grow at a robust CAGR.
  • The leading form of extract segment is liquid extracts.
  • The CAGR for pharmaceuticals is expected to be the highest during the projection period.
  • During the forecast time frame, the medicinal plants category will likely have the highest CAGR.
  • Retailers are estimated to have the greatest CAGR during the forecast period.
  • Asia Pacific dominated the plant extracts market.
  • Europe is predicted to be the second-largest region in the plant extracts market.
  • In the plant extracts market, North America is anticipated to grow fastest.
  • Rising demand for plant extracts in the nutraceuticals industry and the increasing need for plant extracts in the biofuels and biomaterials industry are the key factors boosting the plant extracts market.
  • Rising demand for sustainable agriculture and ethical sourcing, expansion into new markets, and bioactive compounds for research and development that lower the cost of plant extracts for consumers are the main market potential.

Plant Extracts Market

Design Element 2

Access crucial information at unmatched prices!

Request your free sample report today & start making informed decisions powered by Credence Research!

Download Free Sample

CTA Design Element 3

Executive Summary

Market Definition

The plant extracts market is a global market that is concentrated on obtaining useful molecules and substances from different plants for various uses, such as food and drink, cosmetics, and pharmaceuticals. Natural plant-derived substances, such as essential oils, phytochemicals, and herbal extracts, are extracted, processed, and commercialized in this industry to satisfy the expanding demand for sustainable and natural products across multiple industries. To satisfy consumer demands for organic and environmentally friendly products, it is essential.

Market Overview

The plant extracts market has been expanding steadily in recent years, and between 2023 and 2030, it is anticipated to rise at a CAGR of 12.80%. The market was estimated to be worth USD 34154.8 million in 2022 and is anticipated to be worth USD 89520.92 million in 2030.

Plant extracts are incorporated into functional foods and beverages to provide health benefits, such as antioxidants, vitamins, and other bioactive compounds, thereby driving demand. The demand for plant-based and vegan products has driven the use of plant extracts in these categories, including meat alternatives, dairy-free products, and plant-based protein beverages.

Customers are looking at plant extract-based supplements and products to strengthen their immune systems and general health as they become more aware of the importance of preventive healthcare. Dietary preferences, such as vegetarianism and veganism, have led consumers to seek plant-based alternatives for various products, including protein sources and dietary supplements.

Plant extracts with anti-inflammatory properties are used in functional ingredients and supplements to support bone and joint health, which is particularly appealing to an aging population. Plant extracts are used in sports nutrition products to enhance physical performance, reduce recovery time, and support muscle health.

Segmentation by Type of Extract

  • Herbal extracts are the market leader by type of extract. Because herbal extracts are used in skincare and personal care products for their potential benefits to the skin and hair, they can be found in creams, lotions, shampoos, conditioners, and other beauty products.
  • During the projected period, the oil extracts category is anticipated to exhibit a sizable CAGR. Essential oils, an oil extract, are commonly used in aromatherapy for their therapeutic benefits. They are inhaled or applied topically to promote relaxation, reduce stress, improve mood, and address various emotional and mental well-being concerns.
  • Other types of extract, such as spice and seasoning, fruit extracts, vegetable extracts, tea and coffee extracts, floral extracts, and algal extracts, also contribute to the demand for plant extracts.

Segmentation by Form of Extract

  • The main form of extract category is liquid extracts. Liquid extracts are used in nutraceutical products aimed at improving health and well-being. They may contain antioxidants, vitamins, minerals, and other bioactive compounds.
  • The granules and pellets category will likely register a significant CAGR during forecasting. Plant extract granules and pellets are used in herbal teas and infusions, making it easy to create aromatic and health-promoting beverages.
  • Other forms of extract, such as powdered extracts, capsules, and tablets, also contribute to the demand for plant extracts.

Segmentation by Application

  • The pharmaceutical category is anticipated to experience the highest CAGR during the projection period. Plant extracts serve as APIs in the development of pharmaceutical drugs. For example, extracts from the bark of the willow tree were the basis for the synthesis of aspirin, a widely used pain reliever and anti-inflammatory medication.
  • Other applications, such as food and beverage, cosmetics and personal care, nutraceuticals and dietary supplements, aromatherapy, animal feed, and industrial applications, also contribute to the demand for plant extracts.

Segmentation by Plant Source

  • The medicinal plants category will likely have the highest CAGR during the projection period. Bilberry extracts are used for their potential to support eye health and vision. They are found in eye health supplements.
  • Other plant sources, such as culinary herbs and spices, fruits and berries, vegetables, tea and coffee plants, flowers and floral plants, and algae species, also contribute to the demand for plant extracts.

Segmentation by End Users

  • Retailers will be expected to have the foremost CAGR during the prediction period. Some retailers, especially those specializing in health and wellness products, may purchase plant extracts directly for sale to consumers.
  • Other end users, such as manufacturers, wholesale, and distributors, also contribute to the demand for plant extracts.

Segmentation by Region

  • Asia Pacific led the plant extracts market. The rising middle-class population in many Asia Pacific countries is driving increased consumer demand for natural and herbal products, including those containing plant extracts.
  • Europe is estimated to rank second in market size for plant extracts.
  • North America will witness the most rapid growth in the plant extracts market.
  • The rest of the world, including Latin America, the Middle East, and Africa, meets the rest of the plant extract demand.

Plant Extracts Market Research

The demand for healthy and natural goods is expanding, consumer knowledge of the advantages of plant extracts is rising, complementary and alternative medicine is becoming increasingly popular, and plant extraction technology is improving. These are the factors supporting the growth of the global market.

Asia Pacific will rule the plant extracts market during forecasting. Plant extracts are in high demand both domestically and internationally, which is driving growth in the market. The area is home to several small and medium-sized extract manufacturers, including Alchemy Chemicals, Vital Herbs, Sydler, and Plantnat, who know extract processing and its advantages. Thailand, Indian, and Indonesian manufacturers are constantly putting money into the market and emphasizing innovation to increase the variety of products they offer.

The North American area is projected to grow fastest throughout the forecast. Plant extracts find use across various industries in North America, including food and beverages, pharmaceuticals, cosmetics, and dietary supplements, contributing to the market’s growth and diversity.

North America has a robust pharmaceutical and healthcare sector, where plant extracts are increasingly used to develop herbal medicines, supplements, and natural remedies. The region has a growing market for nutraceuticals and functional foods, and plant extracts are incorporated into products that offer health and wellness benefits, meeting consumer demand for functional ingredients.

T&CM practices, such as Ayurveda, traditional Chinese medicine (TCM), and traditional herbal medicine, are gaining recognition and acceptance worldwide. As T&CM becomes more mainstream, the use of plant extracts in these practices expands. The preservation of cultural traditions and heritage is driving the use of plant extracts in T&CM, contributing to the market growth of both traditional and indigenous remedies.

Key Highlights of the Report

The global plant extracts market is segmented by type of extract, form of extract, application, plant source, end users, and region. As far as the type of extract is concerned, herbal extracts are the market spearhead. Liquid extracts are the best form of extract segment. During the forecast period, the pharmaceuticals category is expected to grow at the highest CAGR. Medicinal plants are anticipated to experience the highest CAGR during the forecast period. Asia Pacific is driving the plant extracts market growth.

Plant extracts, particularly oils and lipids derived from crops like soybean, canola, and algae, are used as feedstocks for producing biodiesel and other biofuels. This helps reduce the reliance on fossil fuels and lowers greenhouse gas emissions. Using plant extracts as feedstock aligns with the global push for sustainable and renewable resources, making them a key component of the biofuels industry. The development of biomaterials and biofuels using plant extracts is in line with the principles of green chemistry, which emphasizes the use of renewable resources and the reduction of environmental impact. Plant extracts contribute to lower carbon emissions, reduced waste, and decreased environmental harm compared to conventional fossil fuels and non-renewable materials.

However, according to forecasts, Asia Pacific will hold the largest market share for plant extracts globally. Asia Pacific boasts a vast and diverse range of plant species, many used for medicinal, nutritional, and flavoring purposes. This biodiversity provides a wide array of raw materials for plant extract production. Traditional cultural practices and herbal remedies continue to play a significant role in the daily lives of people in many Asia Pacific countries, further driving the demand for plant extracts. Additionally, the North American region is assumed to have the sharpest growth in the market. Regulatory bodies in North America have established guidelines and regulations that support the safe and responsible use of plant extracts in various industries, which fosters market growth.

Which Key Factors Are Driving the Global Plant Extracts Market?

The fundamental drivers propelling the plant extracts market’s continuous rise include increasing demand for natural and organic products, increasing consumer awareness of the benefits of plant extracts, growing popularity of traditional and complementary medicine (T&CM), and technological advancements in plant extraction processes.

What Are the Key Challenges in The Global Market for Plant Extracts?

Quality control challenges, regulatory compliance, supply chain vulnerabilities, and price volatility hinder the market’s growth for plant extracts.

What Market Opportunities Exist for Plant Extracts Globally?

Plant extracts have a lot of opportunities to grow because of the rising health and wellness products, increasing clean beauty and personal care products, growing pharmaceuticals and herbal medicines, and rising nutraceuticals and functional ingredients.

Market Drivers

Several factors influence the plant extracts market globally. The main factors influencing the plant extracts market globally are as follows:

Growing Demand for Natural and Organic Products

Buyers are progressively seeking products that are perceived as healthier and safer. Natural and organic products, often enriched with plant extracts, are seen as a way to promote overall health and well-being. Many plant extracts are rich in bioactive compounds with known health benefits, such as antioxidants, vitamins, and minerals. This makes them desirable ingredients for functional foods, supplements, and beverages. Consumers are concerned about exposure to synthetic chemicals and additives. Plant extracts are considered a safer and more natural alternative to synthetic ingredients. Plant-based extracts can provide allergen-free alternatives in various product categories, catering to individuals with specific dietary restrictions. The organic and natural product segments have been experiencing robust growth, creating opportunities for plant extracts to find applications in a wide range of consumer goods.

Market Restraints

Several challenges could prevent the expansion of the global market for plant extracts. Among them are the following:

Price Volatility

The raw materials prices used in plant extract production vary significantly due to climate conditions, crop yields, and supply and demand dynamics. This can impact the cost of production for plant extract manufacturers. Many plant species used for extraction have specific growing seasons. The limited availability of certain plants during particular times of the year can lead to seasonal price fluctuations, affecting supply and prices. Crop diseases, pests, and natural disasters like droughts or floods can impact plant yields, leading to shortages and increased costs. Some plants used for extraction are native to specific regions, making them susceptible to supply disruptions caused by local events, such as adverse weather conditions or environmental changes.

Opportunities

The global market for plant extracts presents significant potential opportunities. The following is an example of these:

Expanding Pharmaceuticals and Herbal Medicines

Consumers are increasingly seeking natural and plant-based alternatives to synthetic drugs for various health issues. This trend aligns with using plant extracts in herbal medicines and pharmaceuticals. Plant extracts have been used in traditional medicine systems for centuries, and many have well-documented safety profiles and therapeutic effects. Pharmaceutical companies are exploring these natural compounds for drug development, benefiting from their established use. Pharmaceutical companies are researching extensively to identify and develop new drugs or drug candidates from plant extracts. These compounds may have various therapeutic properties, including anti-inflammatory, antimicrobial, and antioxidant effects. The rising prevalence of chronic health conditions, such as diabetes, cardiovascular diseases, and obesity, has led to the development of plant extract-based pharmaceuticals and supplements designed to manage these conditions.

Competitive Landscape

Plant Extracts Market Report

Shape Your Report to Specific Countries or Regions & Enjoy 30% Off!

Key Players

The global plant extracts market is very competitive, with many influential players. Some of the leading market participants and their corresponding market shares are listed below:

  • Symrise AG
  • Sensient Technologies Corporation
  • International Flavors & Fragrance Inc.
  • Givaudan
  • Synergy Flavors
  • Synthite Industries Private LTD
  • PT Indesso Aroma
  • Vidya Herbs Private Ltd.
  • Nutra Green Biotechnology Co. Ltd
  • Kalsec Inc.
  • Indena S.p.A.
  • Naturex Inc.
  • V. Mane Fils SA
  • Kalsec, Inc.
  • Döhler GmbH
  • Others

These companies prioritize mergers and acquisitions, expanding their distribution network, and developing new products to remain competitive.

The leading competitors in the global market for plant extracts are constantly looking for ways to get an advantage by releasing new items and advancements.

In July 2022, Symrise launched its first three product lines and the natural brand Maison Lautier 1795 (fragrance). Handcrafted, environmentally friendly Mediterranean flowers and plants are the main focus. This broadens the company’s selection of scented products.

In November 2021, Sensient’s flavors and extracts division introduced the Boundless range, a collection of extracts based on chilies. A range of chili profiles is available from Boundless, including Green Jalapeno, Habanero, Red Jalapeno, Ancho, and Chipotle. This will assist the business in satisfying the rising need for novel tastes.

Summary of Key Findings

  • The plant extracts sector continues to grow due to the escalating demand for natural and organic products.
  • The market is segmented by type of extract, form of extract, application, plant source, end users, and region.
  • Herbal extracts are a popular kind of plant extracts in the market.
  • Liquid extracts are the most common form of extract category.
  • Regarding CAGR, pharmaceuticals are expected to grow fastest during the forecast period.
  • The category for medicinal plants will likely see the highest CAGR during the anticipated time frame.
  • Asia Pacific is leading market development; the market is highly competitive with key players including Symrise AG, Sensient Technologies Corporation, International Flavors & Fragrance Inc., Givaudan, Synergy Flavors, Synthite Industries Private LTD, PT Indesso Aroma, Vidya Herbs Private Ltd., Nutra Green Biotechnology Co. Ltd, Kalsec Inc., Indena S.p.A., Naturex Inc., V. Mane Fils SA, Kalsec, Inc., Döhler GmbH, and others.

Future Outlook

  • Optimistic viewpoint for the global plant extracts market with noteworthy growth potential in the Asia Pacific region.
  • One of the main factors driving the plant extracts market is the escalating demand for technological advancements in plant extraction processes.
  • During the projected period, the price volatility for plant extracts might be a significant challenge to the market’s expansion.
  • Foremost companies must concentrate on product innovation, expanding their market reach, and maintaining competitive pricing to stay ahead.

Segmentation

  • By Type of Extract
    • Herbal Extracts
    • Spice and Seasoning Extracts
    • Fruit Extracts
    • Vegetable Extracts
    • Tea and Coffee Extracts
    • Floral Extracts
    • Algal Extracts
    • Oil Extracts
  • By Form of Extract
    • Liquid Extracts
    • Powdered Extracts
    • Capsules and Tablets
    • Granules and Pellets
  • By Application
    • Pharmaceuticals
    • Food and Beverage
    • Cosmetics and Personal Care
    • Nutraceuticals and Dietary Supplements
    • Aromatherapy
    • Animal Feed
    • Industrial Applications
  • By Plant Source
    • Medicinal Plants
    • Culinary Herbs and Spices
    • Fruits and Berries
    • Vegetables
    • Tea and Coffee Plants
    • Flowers and Floral Plants
    • Algae Species
  • By End Users
    • Manufacturers
    • Retailers
    • Wholesale and Distributors
  • By Region
    • North America
      • The US.
      • Canada
      • Mexico
    • Europe
      • Germany
      • France
      • The U.K.
      • Italy
      • Spain
      • Rest of Europe
    • Asia Pacific
      • China
      • Japan
      • India
      • South Korea
      • South-east Asia
      • Rest of Asia Pacific
    • Latin America
      • Brazil
      • Argentina
      • Rest of Latin America
    • Middle East & Africa
      • GCC Countries
      • South Africa
        • Rest of the Middle East and Africa

Table of Content
1. Preface
1.1. Report Description
1.1.1. Purpose of the Report
1.1.2. Target Audience
1.1.3. USP and Key Offerings
1.2. Research Scope
1.3. Market Introduction
2. Executive Summary
2.1. Market Snapshot: Global Plant Extracts Market
2.1.1. Global Plant Extracts Market, By Type of Extract
2.1.2. Global Plant Extracts Market, By Form of Extract
2.1.3. Global Plant Extracts Market, By Application
2.1.4. Global Plant Extracts Market, By Plant Source
2.1.5. Global Plant Extracts Market, By End Users
2.1.6. Global Plant Extracts Market, By Region
2.2. Insights from Primary Respondents
3. Market Dynamics & Factors Analysis
3.1. Introduction
3.1.1. Global Plant Extracts Market Value, 2022-2030, (US$ Mn)
3.1.2. Y-o-Y Growth Trend Analysis
3.2. Market Dynamics
3.2.1. Plant Extracts Market Drivers
3.2.2. Plant Extracts Market Restraints
3.2.3. Plant Extracts Market Opportunities
3.2.4. Major Plant Extracts Industry Challenges
3.3. Growth and Development Patterns
3.4. Investment Feasibility Analysis
3.5. Market Opportunity Analysis
3.5.1. Type of Extract
3.5.2. Form of Extract
3.5.3. Application
3.5.4. Plant Source
3.5.5. End Users
3.5.6. Geography
4. Market Competitive Landscape Analysis
4.1. Company Market Share Analysis, 2022
4.1.1. Global Plant Extracts Market: Company Market Share, Value 2022
4.1.2. Global Plant Extracts Market: Top 6 Company Market Share, Value 2022
4.1.3. Global Plant Extracts Market: Top 3 Company Market Share, Value 2022
4.2. Global Plant Extracts Market: Company Revenue Share Analysis, 2022
4.3. Company Assessment Metrics, 2022
4.3.1. Stars
4.3.2. Emerging Leaders
4.3.3. Pervasive Players
4.3.4. Participants
4.4. Startups/ SMEs Assessment Metrics, 2022
4.4.1. Progressive Companies
4.4.2. Responsive Companies
4.4.3. Dynamic Companies
4.4.4. Starting Blocks
4.5. Strategic Development
4.5.1. Acquisition and Mergers
4.5.2. New Product Launch
4.5.3. Regional Expansion
4.5.4. Partnerships
4.6. Key Player Product Matrix
4.7. Potential for New Players in the Global Plant Extracts Market
5. Premium Insights
5.1. STAR (Situation, Task, Action, Results) Analysis
5.2. Porter’s Five Forces Analysis
5.2.1. Threat of New Entrants
5.2.2. Bargaining Power of Buyers/Consumers
5.2.3. Bargaining Power of Suppliers
5.2.4. Threat of Substitute Types
5.2.5. Intensity of Competitive Rivalry
5.3. PESTEL Analysis
5.3.1. Political Factors
5.3.2. Economic Factors
5.3.3. Social Factors
5.3.4. Technological Factors
5.3.5. Environmental Factors
5.3.6. Legal Factors
5.4. Key Market Trends
5.4.1. Demand Side Trends
5.4.2. Supply Side Trends
5.5. Value Chain Analysis
5.6. Technology Analysis
5.6.1. Research and development in the global market
5.6.2. Patent Analysis
5.6.3. Emerging technologies and their potential disruption to the market
5.7. Consumer Behaviour Analysis
5.7.1. Consumer Preferences and Expectations
5.7.2. Factors Influencing Consumer Buying Decisions
5.7.2.1. North America
5.7.2.2. Europe
5.7.2.3. Asia Pacific
5.7.2.4. Latin America
5.7.2.5. Middle East and Africa
5.7.3. Consumer Pain Points
5.8. Analysis and Recommendations
5.9. Adjacent Market Analysis
6. Market Positioning of Key Players, 2022
6.1. Company market share of key players, 2022
6.2. Competitive Benchmarking
6.3. Market Positioning of Key Vendors
6.4. Geographical Presence Analysis
6.5. Major Strategies Adopted by Key Players
6.5.1. Key Strategies Analysis
6.5.2. Mergers and Acquisitions
6.5.3. Partnerships
6.5.4. Product Launch
6.5.5. Geographical Expansion
6.5.6. Others
7. Impact Analysis of COVID 19 and Russia – Ukraine War on Plant Extracts Market
7.1. Ukraine-Russia War Impact
7.1.1. Uncertainty and Economic Instability
7.1.2. Supply chain disruptions
7.1.3. Regional market shifts
7.1.4. Shift in government priorities
7.2. COVID-19 Impact Analysis
7.2.1. Supply Chain Disruptions
7.2.2. Demand Fluctuations
7.2.3. Shift in Product Mix
7.2.4. Reduced Industrial Activity
7.2.5. Regional Impact Analysis
7.2.5.1. North America
7.2.5.2. Europe
7.2.5.3. Asia Pacific
7.2.5.4. Latin America
7.2.5.5. Middle East and Africa
8. Global Plant Extracts Market, By Type of Extract
8.1. Global Plant Extracts Market Overview, by Type of Extract
8.1.1. Global Plant Extracts Market Revenue Share, By Type of Extract, 2022 Vs 2030 (in %)
8.2. Herbal Extracts
8.2.1. Global Plant Extracts Market, By Herbal Extracts, By Region, 2022-2030 (US$ Mn)
8.2.2. Market Dynamics for Herbal Extracts
8.2.2.1. Drivers
8.2.2.2. Restraints
8.2.2.3. Opportunities
8.2.2.4. Trends
8.3. Spice and Seasoning Extracts
8.3.1. Global Plant Extracts Market, By Spice and Seasoning Extracts, By Region, 2022-2030 (US$ Mn)
8.3.2. Market Dynamics for Spice and Seasoning Extracts
8.3.2.1. Drivers
8.3.2.2. Restraints
8.3.2.3. Opportunities
8.3.2.4. Trends
8.4. Fruit Extracts
8.4.1. Global Plant Extracts Market, By Fruit Extracts, By Region, 2022-2030 (US$ Mn)
8.4.2. Market Dynamics for Fruit Extracts
8.4.2.1. Drivers
8.4.2.2. Restraints
8.4.2.3. Opportunities
8.4.2.4. Trends
8.5. Vegetable Extracts
8.5.1. Global Plant Extracts Market, By Vegetable Extracts, By Region, 2022-2030 (US$ Mn)
8.5.2. Market Dynamics for Vegetable Extracts
8.5.2.1. Drivers
8.5.2.2. Restraints
8.5.2.3. Opportunities
8.5.2.4. Trends
8.6. Tea and Coffee Extracts
8.6.1. Global Plant Extracts Market, By Tea and Coffee Extracts, By Region, 2022-2030 (US$ Mn)
8.6.2. Market Dynamics for Tea and Coffee Extracts
8.6.2.1. Drivers
8.6.2.2. Restraints
8.6.2.3. Opportunities
8.6.2.4. Trends
8.7. Floral Extracts
8.7.1. Global Plant Extracts Market, By Floral Extracts, By Region, 2022-2030 (US$ Mn)
8.7.2. Market Dynamics for Floral Extracts
8.7.2.1. Drivers
8.7.2.2. Restraints
8.7.2.3. Opportunities
8.7.2.4. Trends
8.8. Algal Extracts
8.8.1. Global Plant Extracts Market, By Algal Extracts, By Region, 2022-2030 (US$ Mn)
8.8.2. Market Dynamics for Algal Extracts
8.8.2.1. Drivers
8.8.2.2. Restraints
8.8.2.3. Opportunities
8.8.2.4. Trends
8.9. Oil Extracts
8.9.1. Global Plant Extracts Market, By Oil Extracts, By Region, 2022-2030 (US$ Mn)
8.9.2. Market Dynamics for Oil Extracts
8.9.2.1. Drivers
8.9.2.2. Restraints
8.9.2.3. Opportunities
8.9.2.4. Trends
9. Global Plant Extracts Market, By Form of Extract
9.1. Global Plant Extracts Market Overview, by Form of Extract
9.1.1. Global Plant Extracts Market Revenue Share, By Form of Extract, 2022 Vs 2030 (in %)
9.2. Liquid Extracts
9.2.1. Global Plant Extracts Market, By Liquid Extracts, By Region, 2022-2030 (US$ Mn)
9.2.2. Market Dynamics for Liquid Extracts
9.2.2.1. Drivers
9.2.2.2. Restraints
9.2.2.3. Opportunities
9.2.2.4. Trends
9.3. Powdered Extracts
9.3.1. Global Plant Extracts Market, By Powdered Extracts, By Region, 2022-2030 (US$ Mn)
9.3.2. Market Dynamics for Powdered Extracts
9.3.2.1. Drivers
9.3.2.2. Restraints
9.3.2.3. Opportunities
9.3.2.4. Trends
9.4. Capsules and Tablets
9.4.1. Global Plant Extracts Market, By Capsules and Tablets, By Region, 2022-2030 (US$ Mn)
9.4.2. Market Dynamics for Capsules and Tablets
9.4.2.1. Drivers
9.4.2.2. Restraints
9.4.2.3. Opportunities
9.4.2.4. Trends
9.5. Granules and Pellets
9.5.1. Global Plant Extracts Market, By Granules and Pellets, By Region, 2022-2030 (US$ Mn)
9.5.2. Market Dynamics for Granules and Pellets
9.5.2.1. Drivers
9.5.2.2. Restraints
9.5.2.3. Opportunities
9.5.2.4. Trends
10. Global Plant Extracts Market, By Application
10.1. Global Plant Extracts Market Overview, by Application
10.1.1. Global Plant Extracts Market Revenue Share, By Application, 2022 Vs 2030 (in %)
10.2. Pharmaceuticals
10.2.1. Global Plant Extracts Market, By Pharmaceuticals, By Region, 2022-2030 (US$ Mn)
10.2.2. Market Dynamics for Pharmaceuticals
10.2.2.1. Drivers
10.2.2.2. Restraints
10.2.2.3. Opportunities
10.2.2.4. Trends
10.3. Food and Beverage
10.3.1. Global Plant Extracts Market, By Food and Beverage, By Region, 2022-2030 (US$ Mn)
10.3.2. Market Dynamics for Food and Beverage
10.3.2.1. Drivers
10.3.2.2. Restraints
10.3.2.3. Opportunities
10.3.2.4. Trends
10.4. Cosmetics and Personal Care
10.4.1. Global Plant Extracts Market, By Cosmetics and Personal Care, By Region, 2022-2030 (US$ Mn)
10.4.2. Market Dynamics for Cosmetics and Personal Care
10.4.2.1. Drivers
10.4.2.2. Restraints
10.4.2.3. Opportunities
10.4.2.4. Trends
10.5. Nutraceuticals and Dietary Supplements
10.5.1. Global Plant Extracts Market, By Nutraceuticals and Dietary Supplements, By Region, 2022-2030 (US$ Mn)
10.5.2. Market Dynamics for Nutraceuticals and Dietary Supplements
10.5.2.1. Drivers
10.5.2.2. Restraints
10.5.2.3. Opportunities
10.5.2.4. Trends
10.6. Aromatherapy
10.6.1. Global Plant Extracts Market, By Aromatherapy, By Region, 2022-2030 (US$ Mn)
10.6.2. Market Dynamics for Aromatherapy
10.6.2.1. Drivers
10.6.2.2. Restraints
10.6.2.3. Opportunities
10.6.2.4. Trends
10.7. Animal Feed
10.7.1. Global Plant Extracts Market, By Animal Feed, By Region, 2022-2030 (US$ Mn)
10.7.2. Market Dynamics for Animal Feed
10.7.2.1. Drivers
10.7.2.2. Restraints
10.7.2.3. Opportunities
10.7.2.4. Trends
10.8. Industrial Applications
10.8.1. Global Plant Extracts Market, By Industrial Applications, By Region, 2022-2030 (US$ Mn)
10.8.2. Market Dynamics for Industrial Applications
10.8.2.1. Drivers
10.8.2.2. Restraints
10.8.2.3. Opportunities
10.8.2.4. Trends
11. Global Plant Extracts Market, By Plant Source
11.1. Global Plant Extracts Market Overview, by Plant Source
11.1.1. Global Plant Extracts Market Revenue Share, By Plant Source, 2022 Vs 2030 (in %)
11.2. Medicinal Plants
11.2.1. Global Plant Extracts Market, By Medicinal Plants, By Region, 2022-2030 (US$ Mn)
11.2.2. Market Dynamics for Medicinal Plants
11.2.2.1. Drivers
11.2.2.2. Restraints
11.2.2.3. Opportunities
11.2.2.4. Trends
11.3. Culinary Herbs and Spices
11.3.1. Global Plant Extracts Market, By Culinary Herbs and Spices, By Region, 2022-2030 (US$ Mn)
11.3.2. Market Dynamics for Culinary Herbs and Spices
11.3.2.1. Drivers
11.3.2.2. Restraints
11.3.2.3. Opportunities
11.3.2.4. Trends
11.4. Fruits and Berries
11.4.1. Global Plant Extracts Market, By Fruits and Berries, By Region, 2022-2030 (US$ Mn)
11.4.2. Market Dynamics for Fruits and Berries
11.4.2.1. Drivers
11.4.2.2. Restraints
11.4.2.3. Opportunities
11.4.2.4. Trends
11.5. Vegetables
11.5.1. Global Plant Extracts Market, By Vegetables, By Region, 2022-2030 (US$ Mn)
11.5.2. Market Dynamics for Vegetables
11.5.2.1. Drivers
11.5.2.2. Restraints
11.5.2.3. Opportunities
11.5.2.4. Trends
11.6. Tea and Coffee Plants
11.6.1. Global Plant Extracts Market, By Tea and Coffee Plants, By Region, 2022-2030 (US$ Mn)
11.6.2. Market Dynamics for Tea and Coffee Plants
11.6.2.1. Drivers
11.6.2.2. Restraints
11.6.2.3. Opportunities
11.6.2.4. Trends
11.7. Flowers and Floral Plants
11.7.1. Global Plant Extracts Market, By Flowers and Floral Plants, By Region, 2022-2030 (US$ Mn)
11.7.2. Market Dynamics for Flowers and Floral Plants
11.7.2.1. Drivers
11.7.2.2. Restraints
11.7.2.3. Opportunities
11.7.2.4. Trends
11.8. Algae Species
11.8.1. Global Plant Extracts Market, By Algae Species, By Region, 2022-2030 (US$ Mn)
11.8.2. Market Dynamics for Algae Species
11.8.2.1. Drivers
11.8.2.2. Restraints
11.8.2.3. Opportunities
11.8.2.4. Trends
12. Global Plant Extracts Market, By End Users
12.1. Global Plant Extracts Market Overview, by End Users
12.1.1. Global Plant Extracts Market Revenue Share, By End Users, 2022 Vs 2030 (in %)
12.2. Manufacturers
12.2.1. Global Plant Extracts Market, By Manufacturers, By Region, 2022-2030 (US$ Mn)
12.2.2. Market Dynamics for Manufacturers
12.2.2.1. Drivers
12.2.2.2. Restraints
12.2.2.3. Opportunities
12.2.2.4. Trends
12.3. Retailers
12.3.1. Global Plant Extracts Market, By Retailers, By Region, 2022-2030 (US$ Mn)
12.3.2. Market Dynamics for Retailers
12.3.2.1. Drivers
12.3.2.2. Restraints
12.3.2.3. Opportunities
12.3.2.4. Trends
12.4. Wholesale and Distributors
12.4.1. Global Plant Extracts Market, By Wholesale and Distributors, By Region, 2022-2030 (US$ Mn)
12.4.2. Market Dynamics for Wholesale and Distributors
12.4.2.1. Drivers
12.4.2.2. Restraints
12.4.2.3. Opportunities
12.4.2.4. Trends
13. Global Plant Extracts Market, By Region
13.1. Global Plant Extracts Market Overview, by Region
13.1.1. Global Plant Extracts Market, By Region, 2022 vs 2030 (in%)
13.2. Type of Extract
13.2.1. Global Plant Extracts Market, By Type of Extract, 2022-2030 (US$ Mn)
13.3. Form of Extract
13.3.1. Global Plant Extracts Market, By Form of Extract, 2022-2030 (US$ Mn)
13.4. Application
13.4.1. Global Plant Extracts Market, By Application, 2022-2030 (US$ Mn)
13.5. Plant Source
13.5.1. Global Plant Extracts Market, By Plant Source, 2022-2030 (US$ Mn)
13.6. End Users
13.6.1. Global Plant Extracts Market, By End Users, 2022-2030 (US$ Mn)
14. North America Plant Extracts Market Analysis
14.1. Overview
14.1.1. Market Dynamics for North America
14.1.1.1. Drivers
14.1.1.2. Restraints
14.1.1.3. Opportunities
14.1.1.4. Trends
14.2. North America Plant Extracts Market, by Type of Extract, 2017-2030(US$ Mn)
14.2.1. Overview
14.2.2. SRC Analysis
14.3. North America Plant Extracts Market, by Form of Extract, 2017-2030(US$ Mn)
14.3.1. Overview
14.3.2. SRC Analysis
14.4. North America Plant Extracts Market, by Application, 2017-2030(US$ Mn)
14.4.1. Overview
14.4.2. SRC Analysis
14.5. North America Plant Extracts Market, by Plant Source, 2017-2030(US$ Mn)
14.5.1. Overview
14.5.2. SRC Analysis
14.6. North America Plant Extracts Market, by End Users, 2017-2030(US$ Mn)
14.6.1. Overview
14.6.2. SRC Analysis
14.7. North America Plant Extracts Market, by Country, 2022-2030 (US$ Mn)
14.7.1. North America Plant Extracts Market, by Country, 2022 Vs 2030 (in%)
14.7.2. U.S.
14.7.3. Canada
14.7.4. Mexico
15. Europe Plant Extracts Market Analysis
15.1. Overview
15.1.1. Market Dynamics for Europe
15.1.1.1. Drivers
15.1.1.2. Restraints
15.1.1.3. Opportunities
15.1.1.4. Trends
15.2. Europe Plant Extracts Market, by Type of Extract, 2017-2030(US$ Mn)
15.2.1. Overview
15.2.2. SRC Analysis
15.3. Europe Plant Extracts Market, by Form of Extract, 2017-2030(US$ Mn)
15.3.1. Overview
15.3.2. SRC Analysis
15.4. Europe Plant Extracts Market, by Application, 2017-2030(US$ Mn)
15.4.1. Overview
15.4.2. SRC Analysis
15.5. Europe Plant Extracts Market, by Plant Source, 2017-2030(US$ Mn)
15.5.1. Overview
15.5.2. SRC Analysis
15.6. Europe Plant Extracts Market, by End Users, 2017-2030(US$ Mn)
15.6.1. Overview
15.6.2. SRC Analysis
15.7. Europe Plant Extracts Market, by Country, 2022-2030 (US$ Mn)
15.7.1. Europe Plant Extracts Market, by Country, 2022 Vs 2030 (in%)
15.7.2. UK
15.7.3. France
15.7.4. Germany
15.7.5. Italy
15.7.6. Spain
15.7.7. Benelux
15.7.8. Russia
15.7.9. Rest of Europe
16. Asia Pacific Plant Extracts Market Analysis
16.1. Overview
16.1.1. Market Dynamics for Asia Pacific
16.1.1.1. Drivers
16.1.1.2. Restraints
16.1.1.3. Opportunities
16.1.1.4. Trends
16.2. Asia Pacific Plant Extracts Market, by Type of Extract, 2017-2030(US$ Mn)
16.2.1. Overview
16.2.2. SRC Analysis
16.3. Asia Pacific Plant Extracts Market, by Form of Extract, 2017-2030(US$ Mn)
16.3.1. Overview
16.3.2. SRC Analysis
16.4. Asia Pacific Plant Extracts Market, by Application, 2017-2030(US$ Mn)
16.4.1. Overview
16.4.2. SRC Analysis
16.5. Asia Pacific Plant Extracts Market, by Plant Source, 2017-2030(US$ Mn)
16.5.1. Overview
16.5.2. SRC Analysis
16.6. Asia Pacific Plant Extracts Market, by End Users, 2017-2030(US$ Mn)
16.6.1. Overview
16.6.2. SRC Analysis
16.7. Asia Pacific Plant Extracts Market, by Country, 2022-2030 (US$ Mn)
16.7.1. Asia Pacific Plant Extracts Market, by Country, 2022 Vs 2030 (in%)
16.7.2. China
16.7.3. Japan
16.7.4. India
16.7.5. South Korea
16.7.6. South East Asia
16.7.7. Rest of Asia Pacific
17. Latin America Plant Extracts Market Analysis
17.1. Overview
17.1.1. Market Dynamics for Latin America
17.1.1.1. Drivers
17.1.1.2. Restraints
17.1.1.3. Opportunities
17.1.1.4. Trends
17.2. Latin America Plant Extracts Market, by Type of Extract, 2017-2030(US$ Mn)
17.2.1. Overview
17.2.2. SRC Analysis
17.3. Latin America Plant Extracts Market, by Form of Extract, 2017-2030(US$ Mn)
17.3.1. Overview
17.3.2. SRC Analysis
17.4. Latin America Plant Extracts Market, by Application, 2017-2030(US$ Mn)
17.4.1. Overview
17.4.2. SRC Analysis
17.5. Latin America Plant Extracts Market, by Plant Source, 2017-2030(US$ Mn)
17.5.1. Overview
17.5.2. SRC Analysis
17.6. Latin America Plant Extracts Market, by End Users, 2017-2030(US$ Mn)
17.6.1. Overview
17.6.2. SRC Analysis
17.7. Latin America Plant Extracts Market, by Country, 2022-2030 (US$ Mn)
17.7.1. Latin America Plant Extracts Market, by Country, 2022 Vs 2030 (in%)
17.7.2. Brazil
17.7.3. Argentina
17.7.4. Rest of Latin America
18. Middle East Plant Extracts Market Analysis
18.1. Overview
18.1.1. Market Dynamics for Middle East
18.1.1.1. Drivers
18.1.1.2. Restraints
18.1.1.3. Opportunities
18.1.1.4. Trends
18.2. Middle East Plant Extracts Market, by Type of Extract, 2017-2030(US$ Mn)
18.2.1. Overview
18.2.2. SRC Analysis
18.3. Middle East Plant Extracts Market, by Form of Extract, 2017-2030(US$ Mn)
18.3.1. Overview
18.3.2. SRC Analysis
18.4. Middle East Plant Extracts Market, by Application, 2017-2030(US$ Mn)
18.4.1. Overview
18.4.2. SRC Analysis
18.5. Middle East Plant Extracts Market, by Plant Source, 2017-2030(US$ Mn)
18.5.1. Overview
18.5.2. SRC Analysis
18.6. Middle East Plant Extracts Market, by End Users, 2017-2030(US$ Mn)
18.6.1. Overview
18.6.2. SRC Analysis
18.7. Middle East Plant Extracts Market, by Country, 2022-2030 (US$ Mn)
18.7.1. Middle East Plant Extracts Market, by Country, 2022 Vs 2030 (in%)
18.7.2. UAE
18.7.3. Saudi Arabia
18.7.4. Rest of Middle East
19. Africa Plant Extracts Market Analysis
19.1. Overview
19.1.1. Market Dynamics for Africa
19.1.1.1. Drivers
19.1.1.2. Restraints
19.1.1.3. Opportunities
19.1.1.4. Trends
19.2. Africa Plant Extracts Market, by Type of Extract, 2017-2030(US$ Mn)
19.2.1. Overview
19.2.2. SRC Analysis
19.3. Africa Plant Extracts Market, by Form of Extract, 2017-2030(US$ Mn)
19.3.1. Overview
19.3.2. SRC Analysis
19.4. Africa Plant Extracts Market, by Application, 2017-2030(US$ Mn)
19.4.1. Overview
19.4.2. SRC Analysis
19.5. Africa Plant Extracts Market, by Plant Source, 2017-2030(US$ Mn)
19.5.1. Overview
19.5.2. SRC Analysis
19.6. Africa Plant Extracts Market, by End Users, 2017-2030(US$ Mn)
19.6.1. Overview
19.6.2. SRC Analysis
19.7. Africa Plant Extracts Market, by Country, 2022-2030 (US$ Mn)
19.7.1. Africa Plant Extracts Market, by Country, 2022 Vs 2030 (in%)
19.7.2. South Africa
19.7.3. Egypt
19.7.4. Rest of Africa
20. Company profiles
20.1. Symrise AG
20.1.1. Company Overview
20.1.2. Products/Services Portfolio
20.1.3. Geographical Presence
20.1.4. SWOT Analysis
20.1.5. Financial Summary
20.1.5.1. Market Revenue and Net Profit (2019-2022)
20.1.5.2. Business Segment Revenue Analysis
20.1.5.3. Geographical Revenue Analysis
20.2. Sensient Technologies Corporation
20.3. International Flavors & Fragrance Inc.
20.4. Givaudan
20.5. Synergy Flavors
20.6. Synthite Industries Private LTD
20.7. PT Indesso Aroma
20.8. Vidya Herbs Private Ltd.
20.9. Nutra Green Biotechnology Co. Ltd
20.10. Kalsec Inc.
20.11. Indena S.p.A.
20.12. Naturex Inc.
20.13. V. Mane Fils SA
20.14. Kalsec, Inc.
20.15. Döhler GmbH
20.16. Others
21. Research Methodology
21.1. Research Methodology
21.2. Phase I – Secondary Research
21.3. Phase II – Data Modelling
21.3.1. Company Share Analysis Model
21.3.2. Revenue Based Modelling
21.4. Phase III – Primary Research
21.5. Research Limitations
21.5.1. Assumptions

List of Figures
FIG. 1 Global Plant Extracts Market: Research Methodology
FIG. 2 Market Form of Extract Estimation – Top Down & Bottom up Approach
FIG. 3 Global Plant Extracts Market Segmentation
FIG. 4 Global Plant Extracts Market, by Type of Extract, 2022 (US$ Mn)
FIG. 5 Global Plant Extracts Market, by Form of Extract, 2022 (US$ Mn)
FIG. 6 Global Plant Extracts Market, by Application, 2022 (US$ Mn)
FIG. 7 Global Plant Extracts Market, by Plant Source, 2022 (US$ Mn)
FIG. 8 Global Plant Extracts Market, by End Users, 2022 (US$ Mn)
FIG. 9 Global Plant Extracts Market, by Geography, 2022 (US$ Mn)
FIG. 10 Attractive Investment Proposition, by Type of Extract, 2022
FIG. 11 Attractive Investment Proposition, by Form of Extract, 2022
FIG. 12 Attractive Investment Proposition, by Application, 2022
FIG. 13 Attractive Investment Proposition, by Plant Source, 2022
FIG. 14 Attractive Investment Proposition, by End Users, 2022
FIG. 15 Attractive Investment Proposition, by Geography, 2022
FIG. 16 Global Market Share Analysis of Key Plant Extracts Market Manufacturers, 2022
FIG. 17 Global Market Positioning of Key Plant Extracts Market Manufacturers, 2022
FIG. 18 Global Plant Extracts Market Value Contribution, By Type of Extract, 2022 & 2030 (Value %)
FIG. 19 Global Plant Extracts Market, by Herbal Extracts, Value, 2022-2030 (US$ Mn)
FIG. 20 Global Plant Extracts Market, by Spice and Seasoning Extracts, Value, 2022-2030 (US$ Mn)
FIG. 21 Global Plant Extracts Market, by Fruit Extracts, Value, 2022-2030 (US$ Mn)
FIG. 22 Global Plant Extracts Market, by Vegetable Extracts, Value, 2022-2030 (US$ Mn)
FIG. 23 Global Plant Extracts Market, by Tea and Coffee Extracts, Value, 2022-2030 (US$ Mn)
FIG. 24 Global Plant Extracts Market, by Floral Extracts, Value, 2022-2030 (US$ Mn)
FIG. 25 Global Plant Extracts Market, by Algal Extracts, Value, 2022-2030 (US$ Mn)
FIG. 26 Global Plant Extracts Market, by Oil Extracts, Value, 2022-2030 (US$ Mn)
FIG. 27 Global Plant Extracts Market Value Contribution, By Form of Extract, 2022 & 2030 (Value %)
FIG. 28 Global Plant Extracts Market, by Liquid Extracts, Value, 2022-2030 (US$ Mn)
FIG. 29 Global Plant Extracts Market, by Powdered Extracts, Value, 2022-2030 (US$ Mn)
FIG. 30 Global Plant Extracts Market, by Capsules and Tablets, Value, 2022-2030 (US$ Mn)
FIG. 31 Global Plant Extracts Market, by Granules and Pellets, Value, 2022-2030 (US$ Mn)
FIG. 32 Global Plant Extracts Market Value Contribution, By Application, 2022 & 2030 (Value %)
FIG. 33 Global Plant Extracts Market, by Pharmaceuticals, Value, 2022-2030 (US$ Mn)
FIG. 34 Global Plant Extracts Market, by Food and Beverage, Value, 2022-2030 (US$ Mn)
FIG. 35 Global Plant Extracts Market, by Cosmetics and Personal Care, Value, 2022-2030 (US$ Mn)
FIG. 36 Global Plant Extracts Market, by Nutraceuticals and Dietary Supplements, Value, 2022-2030 (US$ Mn)
FIG. 37 Global Plant Extracts Market, by Aromatherapy, Value, 2022-2030 (US$ Mn)
FIG. 38 Global Plant Extracts Market, by Animal Feed, Value, 2022-2030 (US$ Mn)
FIG. 39 Global Plant Extracts Market, by Industrial Applications, Value, 2022-2030 (US$ Mn)
FIG. 40 Global Plant Extracts Market Value Contribution, By Plant Source, 2022 & 2030 (Value %)
FIG. 41 Global Plant Extracts Market, by Medicinal Plants, Value, 2022-2030 (US$ Mn)
FIG. 42 Global Plant Extracts Market, by Culinary Herbs and Spices, Value, 2022-2030 (US$ Mn)
FIG. 43 Global Plant Extracts Market, by Fruits and Berries, Value, 2022-2030 (US$ Mn)
FIG. 44 Global Plant Extracts Market, by Vegetables, Value, 2022-2030 (US$ Mn)
FIG. 45 Global Plant Extracts Market, by Tea and Coffee Plants, Value, 2022-2030 (US$ Mn)
FIG. 46 Global Plant Extracts Market, by Flowers and Floral Plants, Value, 2022-2030 (US$ Mn)
FIG. 47 Global Plant Extracts Market, by Algae Species, Value, 2022-2030 (US$ Mn)
FIG. 48 Global Plant Extracts Market Value Contribution, By End Users, 2022 & 2030 (Value %)
FIG. 49 Global Plant Extracts Market, by Manufacturers, Value, 2022-2030 (US$ Mn)
FIG. 50 Global Plant Extracts Market, by Retailers, Value, 2022-2030 (US$ Mn)
FIG. 51 Global Plant Extracts Market, by Wholesale and Distributors, Value, 2022-2030 (US$ Mn)
FIG. 52 North America Plant Extracts Market, 2022-2030 (US$ Mn)
FIG. 53 U.S. Plant Extracts Market, 2022-2030 (US$ Mn)
FIG. 54 Canada Plant Extracts Market, 2022-2030 (US$ Mn)
FIG. 55 Mexico Plant Extracts Market, 2022-2030 (US$ Mn)
FIG. 56 Europe Plant Extracts Market, 2022-2030 (US$ Mn)
FIG. 57 Germany Plant Extracts Market, 2022-2030 (US$ Mn)
FIG. 58 France Plant Extracts Market, 2022-2030 (US$ Mn)
FIG. 59 U.K. Plant Extracts Market, 2022-2030 (US$ Mn)
FIG. 60 Italy Plant Extracts Market, 2022-2030 (US$ Mn)
FIG. 61 Spain Plant Extracts Market, 2022-2030 (US$ Mn)
FIG. 62 Benelux Plant Extracts Market, 2022-2030 (US$ Mn)
FIG. 63 Russia Plant Extracts Market, 2022-2030 (US$ Mn)
FIG. 64 Rest of Europe Plant Extracts Market, 2022-2030 (US$ Mn)
FIG. 65 Asia Pacific Plant Extracts Market, 2022-2030 (US$ Mn)
FIG. 66 China Plant Extracts Market, 2022-2030 (US$ Mn)
FIG. 67 Japan Plant Extracts Market, 2022-2030 (US$ Mn)
FIG. 68 India Plant Extracts Market, 2022-2030 (US$ Mn)
FIG. 69 South Korea Plant Extracts Market, 2022-2030 (US$ Mn)
FIG. 70 South-East Asia Plant Extracts Market, 2022-2030 (US$ Mn)
FIG. 71 Rest of Asia Pacific Plant Extracts Market, 2022-2030 (US$ Mn)
FIG. 72 Latin America Plant Extracts Market, 2022-2030 (US$ Mn)
FIG. 73 Brazil Plant Extracts Market, 2022-2030 (US$ Mn)
FIG. 74 Argentina Plant Extracts Market, 2022-2030 (US$ Mn)
FIG. 75 Rest of Latin America Plant Extracts Market, 2022-2030 (US$ Mn)
FIG. 76 Middle East Plant Extracts Market, 2022-2030 (US$ Mn)
FIG. 77 UAE Plant Extracts Market, 2022-2030 (US$ Mn)
FIG. 78 Saudi Arabia Plant Extracts Market, 2022-2030 (US$ Mn)
FIG. 79 Rest of Middle East Plant Extracts Market, 2022-2030 (US$ Mn)
FIG. 80 Africa Plant Extracts Market, 2022-2030 (US$ Mn)
FIG. 81 South Africa Plant Extracts Market, 2022-2030 (US$ Mn)
FIG. 82 Egypt Plant Extracts Market, 2022-2030 (US$ Mn)
FIG. 83 Rest of Africa Plant Extracts Market, 2022-2030 (US$ Mn)

List of Tables
TABLE 1 Market Snapshot: Global Plant Extracts Market
TABLE 2 Global Plant Extracts Market: Market Drivers Impact Analysis
TABLE 3 Global Plant Extracts Market: Market Restraints Impact Analysis
TABLE 4 Global Plant Extracts Market, by Competitive Benchmarking, 2022
TABLE 5 Global Plant Extracts Market, by Geographical Presence Analysis, 2022
TABLE 6 Global Plant Extracts Market, by Key Strategies Analysis, 2022
TABLE 7 Global Plant Extracts Market, by Herbal Extracts, By Region, 2017-2022 (US$ Mn)
TABLE 8 Global Plant Extracts Market, by Herbal Extracts, By Region, 2023-2030 (US$ Mn)
TABLE 9 Global Plant Extracts Market, by Spice and Seasoning Extracts, By Region, 2017-2022 (US$ Mn)
TABLE 10 Global Plant Extracts Market, by Spice and Seasoning Extracts, By Region, 2023-2030 (US$ Mn)
TABLE 11 Global Plant Extracts Market, by Fruit Extracts, By Region, 2017-2022 (US$ Mn)
TABLE 12 Global Plant Extracts Market, by Fruit Extracts, By Region, 2023-2030 (US$ Mn)
TABLE 13 Global Plant Extracts Market, by Vegetable Extracts, By Region, 2017-2022 (US$ Mn)
TABLE 14 Global Plant Extracts Market, by Vegetable Extracts, By Region, 2023-2030 (US$ Mn)
TABLE 15 Global Plant Extracts Market, by Tea and Coffee Extracts, By Region, 2017-2022 (US$ Mn)
TABLE 16 Global Plant Extracts Market, by Tea and Coffee Extracts, By Region, 2023-2030 (US$ Mn)
TABLE 17 Global Plant Extracts Market, by Floral Extracts, By Region, 2017-2022 (US$ Mn)
TABLE 18 Global Plant Extracts Market, by Floral Extracts, By Region, 2023-2030 (US$ Mn)
TABLE 19 Global Plant Extracts Market, by Algal Extracts, By Region, 2017-2022 (US$ Mn)
TABLE 20 Global Plant Extracts Market, by Algal Extracts, By Region, 2023-2030 (US$ Mn)
TABLE 21 Global Plant Extracts Market, by Oil Extracts, By Region, 2017-2022 (US$ Mn)
TABLE 22 Global Plant Extracts Market, by Oil Extracts, By Region, 2023-2030 (US$ Mn)
TABLE 23 Global Plant Extracts Market, by Liquid Extracts, By Region, 2017-2022 (US$ Mn)
TABLE 24 Global Plant Extracts Market, by Liquid Extracts, By Region, 2023-2030 (US$ Mn)
TABLE 25 Global Plant Extracts Market, by Powdered Extracts, By Region, 2017-2022 (US$ Mn)
TABLE 26 Global Plant Extracts Market, by Powdered Extracts, By Region, 2023-2030 (US$ Mn)
TABLE 27 Global Plant Extracts Market, by Capsules and Tablets, By Region, 2017-2022 (US$ Mn)
TABLE 28 Global Plant Extracts Market, by Capsules and Tablets, By Region, 2023-2030 (US$ Mn)
TABLE 29 Global Plant Extracts Market, by Granules and Pellets, By Region, 2017-2022 (US$ Mn)
TABLE 30 Global Plant Extracts Market, by Granules and Pellets, By Region, 2023-2030 (US$ Mn)
TABLE 31 Global Plant Extracts Market, by Pharmaceuticals, By Region, 2017-2022 (US$ Mn)
TABLE 32 Global Plant Extracts Market, by Pharmaceuticals, By Region, 2023-2030 (US$ Mn)
TABLE 33 Global Plant Extracts Market, by Food and Beverage, By Region, 2017-2022 (US$ Mn)
TABLE 34 Global Plant Extracts Market, by Food and Beverage, By Region, 2023-2030 (US$ Mn)
TABLE 35 Global Plant Extracts Market, by Cosmetics and Personal Care, By Region, 2017-2022 (US$ Mn)
TABLE 36 Global Plant Extracts Market, by Cosmetics and Personal Care, By Region, 2023-2030 (US$ Mn)
TABLE 37 Global Plant Extracts Market, by Nutraceuticals and Dietary Supplements, By Region, 2017-2022 (US$ Mn)
TABLE 38 Global Plant Extracts Market, by Nutraceuticals and Dietary Supplements, By Region, 2023-2030 (US$ Mn)
TABLE 39 Global Plant Extracts Market, by Aromatherapy, By Region, 2017-2022 (US$ Mn)
TABLE 40 Global Plant Extracts Market, by Aromatherapy, By Region, 2023-2030 (US$ Mn)
TABLE 41 Global Plant Extracts Market, by Animal Feed, By Region, 2017-2022 (US$ Mn)
TABLE 42 Global Plant Extracts Market, by Animal Feed, By Region, 2023-2030 (US$ Mn)
TABLE 43 Global Plant Extracts Market, by Industrial Applications, By Region, 2017-2022 (US$ Mn)
TABLE 44 Global Plant Extracts Market, by Industrial Applications, By Region, 2023-2030 (US$ Mn)
TABLE 45 Global Plant Extracts Market, by Medicinal Plants, By Region, 2017-2022 (US$ Mn)
TABLE 46 Global Plant Extracts Market, by Medicinal Plants, By Region, 2023-2030 (US$ Mn)
TABLE 47 Global Plant Extracts Market, by Culinary Herbs and Spices, By Region, 2017-2022 (US$ Mn)
TABLE 48 Global Plant Extracts Market, by Culinary Herbs and Spices, By Region, 2023-2030 (US$ Mn)
TABLE 49 Global Plant Extracts Market, by Fruits and Berries, By Region, 2017-2022 (US$ Mn)
TABLE 50 Global Plant Extracts Market, by Fruits and Berries, By Region, 2023-2030 (US$ Mn)
TABLE 51 Global Plant Extracts Market, by Vegetables, By Region, 2017-2022 (US$ Mn)
TABLE 52 Global Plant Extracts Market, by Vegetables, By Region, 2023-2030 (US$ Mn)
TABLE 53 Global Plant Extracts Market, by Tea and Coffee Plants, By Region, 2017-2022 (US$ Mn)
TABLE 54 Global Plant Extracts Market, by Tea and Coffee Plants, By Region, 2023-2030 (US$ Mn)
TABLE 55 Global Plant Extracts Market, by Flowers and Floral Plants, By Region, 2017-2022 (US$ Mn)
TABLE 56 Global Plant Extracts Market, by Flowers and Floral Plants, By Region, 2023-2030 (US$ Mn)
TABLE 57 Global Plant Extracts Market, by Algae Species, By Region, 2017-2022 (US$ Mn)
TABLE 58 Global Plant Extracts Market, by Algae Species, By Region, 2023-2030 (US$ Mn)
TABLE 59 Global Plant Extracts Market, by Manufacturers, By Region, 2017-2022 (US$ Mn)
TABLE 60 Global Plant Extracts Market, by Manufacturers, By Region, 2023-2030 (US$ Mn)
TABLE 61 Global Plant Extracts Market, by Retailers, By Region, 2017-2022 (US$ Mn)
TABLE 62 Global Plant Extracts Market, by Retailers, By Region, 2023-2030 (US$ Mn)
TABLE 63 Global Plant Extracts Market, by Wholesale and Distributors, By Region, 2017-2022 (US$ Mn)
TABLE 64 Global Plant Extracts Market, by Wholesale and Distributors, By Region, 2023-2030 (US$ Mn)
TABLE 65 Global Plant Extracts Market, by Type of Extract, 2017-2022 (US$ Mn)
TABLE 66 Global Plant Extracts Market, by Type of Extract, 2023-2030 (US$ Mn)
TABLE 67 Global Plant Extracts Market, by Form of Extract, 2017-2022 (US$ Mn)
TABLE 68 Global Plant Extracts Market, by Form of Extract, 2023-2030 (US$ Mn)
TABLE 69 Global Plant Extracts Market, by Application, 2017-2022 (US$ Mn)
TABLE 70 Global Plant Extracts Market, by Application, 2023-2030 (US$ Mn)
TABLE 71 Global Plant Extracts Market, by Plant Source, 2017-2022 (US$ Mn)
TABLE 72 Global Plant Extracts Market, by Plant Source, 2023-2030 (US$ Mn)
TABLE 73 Global Plant Extracts Market, by End Users, 2017-2022 (US$ Mn)
TABLE 74 Global Plant Extracts Market, by End Users, 2023-2030 (US$ Mn)
TABLE 75 Global Plant Extracts Market, by Region, 2017-2022 (US$ Mn)
TABLE 76 Global Plant Extracts Market, by Region, 2023-2030 (US$ Mn)
TABLE 77 North America Plant Extracts Market, by Type of Extract, 2017-2022 (US$ Mn)
TABLE 78 North America Plant Extracts Market, by Type of Extract, 2023-2030 (US$ Mn)
TABLE 79 North America Plant Extracts Market, by Form of Extract, 2017-2022 (US$ Mn)
TABLE 80 North America Plant Extracts Market, by Form of Extract, 2023-2030 (US$ Mn)
TABLE 81 North America Plant Extracts Market, by Application, 2017-2022 (US$ Mn)
TABLE 82 North America Plant Extracts Market, by Application, 2023-2030 (US$ Mn)
TABLE 83 North America Plant Extracts Market, by Plant Source, 2017-2022 (US$ Mn)
TABLE 84 North America Plant Extracts Market, by Plant Source, 2023-2030 (US$ Mn)
TABLE 85 North America Plant Extracts Market, by End Users, 2017-2022 (US$ Mn)
TABLE 86 North America Plant Extracts Market, by End Users, 2023-2030 (US$ Mn)
TABLE 87 North America Plant Extracts Market, by Country, 2017-2022 (US$ Mn)
TABLE 88 North America Plant Extracts Market, by Country, 2023-2030 (US$ Mn)
TABLE 89 United States Plant Extracts Market, by Type of Extract, 2017-2022 (US$ Mn)
TABLE 90 United States Plant Extracts Market, by Type of Extract, 2023-2030 (US$ Mn)
TABLE 91 United States Plant Extracts Market, by Form of Extract, 2017-2022 (US$ Mn)
TABLE 92 United States Plant Extracts Market, by Form of Extract, 2023-2030 (US$ Mn)
TABLE 93 United States Plant Extracts Market, by Application, 2017-2022 (US$ Mn)
TABLE 94 United States Plant Extracts Market, by Application, 2023-2030 (US$ Mn)
TABLE 95 United States Plant Extracts Market, by Plant Source, 2017-2022 (US$ Mn)
TABLE 96 United States Plant Extracts Market, by Plant Source, 2023-2030 (US$ Mn)
TABLE 97 United States Plant Extracts Market, by End Users, 2017-2022 (US$ Mn)
TABLE 98 United States Plant Extracts Market, by End Users, 2023-2030 (US$ Mn)
TABLE 99 Canada Plant Extracts Market, by Type of Extract, 2017-2022 (US$ Mn)
TABLE 100 Canada Plant Extracts Market, by Type of Extract, 2023-2030 (US$ Mn)
TABLE 101 Canada Plant Extracts Market, by Form of Extract, 2017-2022 (US$ Mn)
TABLE 102 Canada Plant Extracts Market, by Form of Extract, 2023-2030 (US$ Mn)
TABLE 103 Canada Plant Extracts Market, by Application, 2017-2022 (US$ Mn)
TABLE 104 Canada Plant Extracts Market, by Application, 2023-2030 (US$ Mn)
TABLE 105 Canada Plant Extracts Market, by Plant Source, 2017-2022 (US$ Mn)
TABLE 106 Canada Plant Extracts Market, by Plant Source, 2023-2030 (US$ Mn)
TABLE 107 Canada Plant Extracts Market, by End Users, 2017-2022 (US$ Mn)
TABLE 108 Canada Plant Extracts Market, by End Users, 2023-2030 (US$ Mn)
TABLE 109 Mexico Plant Extracts Market, by Type of Extract, 2017-2022 (US$ Mn)
TABLE 110 Mexico Plant Extracts Market, by Type of Extract, 2023-2030 (US$ Mn)
TABLE 111 Mexico Plant Extracts Market, by Form of Extract, 2017-2022 (US$ Mn)
TABLE 112 Mexico Plant Extracts Market, by Form of Extract, 2023-2030 (US$ Mn)
TABLE 113 Mexico Plant Extracts Market, by Application, 2017-2022 (US$ Mn)
TABLE 114 Mexico Plant Extracts Market, by Application, 2023-2030 (US$ Mn)
TABLE 115 Mexico Plant Extracts Market, by Plant Source, 2017-2022 (US$ Mn)
TABLE 116 Mexico Plant Extracts Market, by Plant Source, 2023-2030 (US$ Mn)
TABLE 117 Mexico Plant Extracts Market, by End Users, 2017-2022 (US$ Mn)
TABLE 118 Mexico Plant Extracts Market, by End Users, 2023-2030 (US$ Mn)
TABLE 119 Europe Plant Extracts Market, by Type of Extract, 2017-2022 (US$ Mn)
TABLE 120 Europe Plant Extracts Market, by Type of Extract, 2023-2030 (US$ Mn)
TABLE 121 Europe Plant Extracts Market, by Form of Extract, 2017-2022 (US$ Mn)
TABLE 122 Europe Plant Extracts Market, by Form of Extract, 2023-2030 (US$ Mn)
TABLE 123 Europe Plant Extracts Market, by Application, 2017-2022 (US$ Mn)
TABLE 124 Europe Plant Extracts Market, by Application, 2023-2030 (US$ Mn)
TABLE 125 Europe Plant Extracts Market, by Plant Source, 2017-2022 (US$ Mn)
TABLE 126 Europe Plant Extracts Market, by Plant Source, 2023-2030 (US$ Mn)
TABLE 127 Europe Plant Extracts Market, by End Users, 2017-2022 (US$ Mn)
TABLE 128 Europe Plant Extracts Market, by End Users, 2023-2030 (US$ Mn)
TABLE 129 Europe Plant Extracts Market, by Country, 2017-2022 (US$ Mn)
TABLE 130 Europe Plant Extracts Market, by Country, 2023-2030 (US$ Mn)
TABLE 131 Germany Plant Extracts Market, by Type of Extract, 2017-2022 (US$ Mn)
TABLE 132 Germany Plant Extracts Market, by Type of Extract, 2023-2030 (US$ Mn)
TABLE 133 Germany Plant Extracts Market, by Form of Extract, 2017-2022 (US$ Mn)
TABLE 134 Germany Plant Extracts Market, by Form of Extract, 2023-2030 (US$ Mn)
TABLE 135 Germany Plant Extracts Market, by Application, 2017-2022 (US$ Mn)
TABLE 136 Germany Plant Extracts Market, by Application, 2023-2030 (US$ Mn)
TABLE 137 Germany Plant Extracts Market, by Plant Source, 2017-2022 (US$ Mn)
TABLE 138 Germany Plant Extracts Market, by Plant Source, 2023-2030 (US$ Mn)
TABLE 139 Germany Plant Extracts Market, by End Users, 2017-2022 (US$ Mn)
TABLE 140 Germany Plant Extracts Market, by End Users, 2023-2030 (US$ Mn)
TABLE 141 France Plant Extracts Market, by Type of Extract, 2017-2022 (US$ Mn)
TABLE 142 France Plant Extracts Market, by Type of Extract, 2023-2030 (US$ Mn)
TABLE 143 France Plant Extracts Market, by Form of Extract, 2017-2022 (US$ Mn)
TABLE 144 France Plant Extracts Market, by Form of Extract, 2023-2030 (US$ Mn)
TABLE 145 France Plant Extracts Market, by Application, 2017-2022 (US$ Mn)
TABLE 146 France Plant Extracts Market, by Application, 2023-2030 (US$ Mn)
TABLE 147 France Plant Extracts Market, by Plant Source, 2017-2022 (US$ Mn)
TABLE 148 France Plant Extracts Market, by Plant Source, 2023-2030 (US$ Mn)
TABLE 149 France Plant Extracts Market, by End Users, 2017-2022 (US$ Mn)
TABLE 150 France Plant Extracts Market, by End Users, 2023-2030 (US$ Mn)
TABLE 151 United Kingdom Plant Extracts Market, by Type of Extract, 2017-2022 (US$ Mn)
TABLE 152 United Kingdom Plant Extracts Market, by Type of Extract, 2023-2030 (US$ Mn)
TABLE 153 United Kingdom Plant Extracts Market, by Form of Extract, 2017-2022 (US$ Mn)
TABLE 154 United Kingdom Plant Extracts Market, by Form of Extract, 2023-2030 (US$ Mn)
TABLE 155 United Kingdom Plant Extracts Market, by Application, 2017-2022 (US$ Mn)
TABLE 156 United Kingdom Plant Extracts Market, by Application, 2023-2030 (US$ Mn)
TABLE 157 United Kingdom Plant Extracts Market, by Plant Source, 2017-2022 (US$ Mn)
TABLE 158 United Kingdom Plant Extracts Market, by Plant Source, 2023-2030 (US$ Mn)
TABLE 159 United Kingdom Plant Extracts Market, by End Users, 2017-2022 (US$ Mn)
TABLE 160 United Kingdom Plant Extracts Market, by End Users, 2023-2030 (US$ Mn)
TABLE 161 Italy Plant Extracts Market, by Type of Extract, 2017-2022 (US$ Mn)
TABLE 162 Italy Plant Extracts Market, by Type of Extract, 2023-2030 (US$ Mn)
TABLE 163 Italy Plant Extracts Market, by Form of Extract, 2017-2022 (US$ Mn)
TABLE 164 Italy Plant Extracts Market, by Form of Extract, 2023-2030 (US$ Mn)
TABLE 165 Italy Plant Extracts Market, by Application, 2017-2022 (US$ Mn)
TABLE 166 Italy Plant Extracts Market, by Application, 2023-2030 (US$ Mn)
TABLE 167 Italy Plant Extracts Market, by Plant Source, 2017-2022 (US$ Mn)
TABLE 168 Italy Plant Extracts Market, by Plant Source, 2023-2030 (US$ Mn)
TABLE 169 Italy Plant Extracts Market, by End Users, 2017-2022 (US$ Mn)
TABLE 170 Italy Plant Extracts Market, by End Users, 2023-2030 (US$ Mn)
TABLE 171 Spain Plant Extracts Market, by Type of Extract, 2017-2022 (US$ Mn)
TABLE 172 Spain Plant Extracts Market, by Type of Extract, 2023-2030 (US$ Mn)
TABLE 173 Spain Plant Extracts Market, by Form of Extract, 2017-2022 (US$ Mn)
TABLE 174 Spain Plant Extracts Market, by Form of Extract, 2023-2030 (US$ Mn)
TABLE 175 Spain Plant Extracts Market, by Application, 2017-2022 (US$ Mn)
TABLE 176 Spain Plant Extracts Market, by Application, 2023-2030 (US$ Mn)
TABLE 177 Spain Plant Extracts Market, by Plant Source, 2017-2022 (US$ Mn)
TABLE 178 Spain Plant Extracts Market, by Plant Source, 2023-2030 (US$ Mn)
TABLE 179 Spain Plant Extracts Market, by End Users, 2017-2022 (US$ Mn)
TABLE 180 Spain Plant Extracts Market, by End Users, 2023-2030 (US$ Mn)
TABLE 181 Benelux Plant Extracts Market, by Type of Extract, 2017-2022 (US$ Mn)
TABLE 182 Benelux Plant Extracts Market, by Type of Extract, 2023-2030 (US$ Mn)
TABLE 183 Benelux Plant Extracts Market, by Form of Extract, 2017-2022 (US$ Mn)
TABLE 184 Benelux Plant Extracts Market, by Form of Extract, 2023-2030 (US$ Mn)
TABLE 185 Benelux Plant Extracts Market, by Application, 2017-2022 (US$ Mn)
TABLE 186 Benelux Plant Extracts Market, by Application, 2023-2030 (US$ Mn)
TABLE 187 Benelux Plant Extracts Market, by Plant Source, 2017-2022 (US$ Mn)
TABLE 188 Benelux Plant Extracts Market, by Plant Source, 2023-2030 (US$ Mn)
TABLE 189 Benelux Plant Extracts Market, by End Users, 2017-2022 (US$ Mn)
TABLE 190 Benelux Plant Extracts Market, by End Users, 2023-2030 (US$ Mn)
TABLE 191 Russia Plant Extracts Market, by Type of Extract, 2017-2022 (US$ Mn)
TABLE 192 Russia Plant Extracts Market, by Type of Extract, 2023-2030 (US$ Mn)
TABLE 193 Russia Plant Extracts Market, by Form of Extract, 2017-2022 (US$ Mn)
TABLE 194 Russia Plant Extracts Market, by Form of Extract, 2023-2030 (US$ Mn)
TABLE 195 Russia Plant Extracts Market, by Application, 2017-2022 (US$ Mn)
TABLE 196 Russia Plant Extracts Market, by Application, 2023-2030 (US$ Mn)
TABLE 197 Russia Plant Extracts Market, by Plant Source, 2017-2022 (US$ Mn)
TABLE 198 Russia Plant Extracts Market, by Plant Source, 2023-2030 (US$ Mn)
TABLE 199 Russia Plant Extracts Market, by End Users, 2017-2022 (US$ Mn)
TABLE 200 Russia Plant Extracts Market, by End Users, 2023-2030 (US$ Mn)
TABLE 201 Rest of Europe Plant Extracts Market, by Type of Extract, 2017-2022 (US$ Mn)
TABLE 202 Rest of Europe Plant Extracts Market, by Type of Extract, 2023-2030 (US$ Mn)
TABLE 203 Rest of Europe Plant Extracts Market, by Form of Extract, 2017-2022 (US$ Mn)
TABLE 204 Rest of Europe Plant Extracts Market, by Form of Extract, 2023-2030 (US$ Mn)
TABLE 205 Rest of Europe Plant Extracts Market, by Application, 2017-2022 (US$ Mn)
TABLE 206 Rest of Europe Plant Extracts Market, by Application, 2023-2030 (US$ Mn)
TABLE 207 Rest of Europe Plant Extracts Market, by Plant Source, 2017-2022 (US$ Mn)
TABLE 208 Rest of Europe Plant Extracts Market, by Plant Source, 2023-2030 (US$ Mn)
TABLE 209 Rest of Europe Plant Extracts Market, by End Users, 2017-2022 (US$ Mn)
TABLE 210 Rest of Europe Plant Extracts Market, by End Users, 2023-2030 (US$ Mn)
TABLE 211 Asia Pacific Plant Extracts Market, by Type of Extract, 2017-2022 (US$ Mn)
TABLE 212 Asia Pacific Plant Extracts Market, by Type of Extract, 2023-2030 (US$ Mn)
TABLE 213 Asia Pacific Plant Extracts Market, by Form of Extract, 2017-2022 (US$ Mn)
TABLE 214 Asia Pacific Plant Extracts Market, by Form of Extract, 2023-2030 (US$ Mn)
TABLE 215 Asia Pacific Plant Extracts Market, by Application, 2017-2022 (US$ Mn)
TABLE 216 Asia Pacific Plant Extracts Market, by Application, 2023-2030 (US$ Mn)
TABLE 217 Asia Pacific Plant Extracts Market, by Plant Source, 2017-2022 (US$ Mn)
TABLE 218 Asia Pacific Plant Extracts Market, by Plant Source, 2023-2030 (US$ Mn)
TABLE 219 Asia Pacific Plant Extracts Market, by End Users, 2017-2022 (US$ Mn)
TABLE 220 Asia Pacific Plant Extracts Market, by End Users, 2023-2030 (US$ Mn)
TABLE 221 China Plant Extracts Market, by Type of Extract, 2017-2022 (US$ Mn)
TABLE 222 China Plant Extracts Market, by Type of Extract, 2023-2030 (US$ Mn)
TABLE 223 China Plant Extracts Market, by Form of Extract, 2017-2022 (US$ Mn)
TABLE 224 China Plant Extracts Market, by Form of Extract, 2023-2030 (US$ Mn)
TABLE 225 China Plant Extracts Market, by Application, 2017-2022 (US$ Mn)
TABLE 226 China Plant Extracts Market, by Application, 2023-2030 (US$ Mn)
TABLE 227 China Plant Extracts Market, by Plant Source, 2017-2022 (US$ Mn)
TABLE 228 China Plant Extracts Market, by Plant Source, 2023-2030 (US$ Mn)
TABLE 229 China Plant Extracts Market, by End Users, 2017-2022 (US$ Mn)
TABLE 230 China Plant Extracts Market, by End Users, 2023-2030 (US$ Mn)
TABLE 231 Japan Plant Extracts Market, by Type of Extract, 2017-2022 (US$ Mn)
TABLE 232 Japan Plant Extracts Market, by Type of Extract, 2023-2030 (US$ Mn)
TABLE 233 Japan Plant Extracts Market, by Form of Extract, 2017-2022 (US$ Mn)
TABLE 234 Japan Plant Extracts Market, by Form of Extract, 2023-2030 (US$ Mn)
TABLE 235 Japan Plant Extracts Market, by Application, 2017-2022 (US$ Mn)
TABLE 236 Japan Plant Extracts Market, by Application, 2023-2030 (US$ Mn)
TABLE 237 Japan Plant Extracts Market, by Plant Source, 2017-2022 (US$ Mn)
TABLE 238 Japan Plant Extracts Market, by Plant Source, 2023-2030 (US$ Mn)
TABLE 239 Japan Plant Extracts Market, by End Users, 2017-2022 (US$ Mn)
TABLE 240 Japan Plant Extracts Market, by End Users, 2023-2030 (US$ Mn)
TABLE 241 India Plant Extracts Market, by Type of Extract, 2017-2022 (US$ Mn)
TABLE 242 India Plant Extracts Market, by Type of Extract, 2023-2030 (US$ Mn)
TABLE 243 India Plant Extracts Market, by Form of Extract, 2017-2022 (US$ Mn)
TABLE 244 India Plant Extracts Market, by Form of Extract, 2023-2030 (US$ Mn)
TABLE 245 India Plant Extracts Market, by Application, 2017-2022 (US$ Mn)
TABLE 246 India Plant Extracts Market, by Application, 2023-2030 (US$ Mn)
TABLE 247 India Plant Extracts Market, by Plant Source, 2017-2022 (US$ Mn)
TABLE 248 India Plant Extracts Market, by Plant Source, 2023-2030 (US$ Mn)
TABLE 249 India Plant Extracts Market, by End Users, 2017-2022 (US$ Mn)
TABLE 250 India Plant Extracts Market, by End Users, 2023-2030 (US$ Mn)
TABLE 251 South Korea Plant Extracts Market, by Type of Extract, 2017-2022 (US$ Mn)
TABLE 252 South Korea Plant Extracts Market, by Type of Extract, 2023-2030 (US$ Mn)
TABLE 253 South Korea Plant Extracts Market, by Form of Extract, 2017-2022 (US$ Mn)
TABLE 254 South Korea Plant Extracts Market, by Form of Extract, 2023-2030 (US$ Mn)
TABLE 255 South Korea Plant Extracts Market, by Application, 2017-2022 (US$ Mn)
TABLE 256 South Korea Plant Extracts Market, by Application, 2023-2030 (US$ Mn)
TABLE 257 South Korea Plant Extracts Market, by Plant Source, 2017-2022 (US$ Mn)
TABLE 258 South Korea Plant Extracts Market, by Plant Source, 2023-2030 (US$ Mn)
TABLE 259 South Korea Plant Extracts Market, by End Users, 2017-2022 (US$ Mn)
TABLE 260 South Korea Plant Extracts Market, by End Users, 2023-2030 (US$ Mn)
TABLE 261 South-East Asia Plant Extracts Market, by Type of Extract, 2017-2022 (US$ Mn)
TABLE 262 South-East Asia Plant Extracts Market, by Type of Extract, 2023-2030 (US$ Mn)
TABLE 263 South-East Asia Plant Extracts Market, by Form of Extract, 2017-2022 (US$ Mn)
TABLE 264 South-East Asia Plant Extracts Market, by Form of Extract, 2023-2030 (US$ Mn)
TABLE 265 South-East Asia Plant Extracts Market, by Application, 2017-2022 (US$ Mn)
TABLE 266 South-East Asia Plant Extracts Market, by Application, 2023-2030 (US$ Mn)
TABLE 267 South-East Asia Plant Extracts Market, by Plant Source, 2017-2022 (US$ Mn)
TABLE 268 South-East Asia Plant Extracts Market, by Plant Source, 2023-2030 (US$ Mn)
TABLE 269 South-East Asia Plant Extracts Market, by End Users, 2017-2022 (US$ Mn)
TABLE 270 South-East Asia Plant Extracts Market, by End Users, 2023-2030 (US$ Mn)
TABLE 271 Rest of Asia Pacific Plant Extracts Market, by Type of Extract, 2017-2022 (US$ Mn)
TABLE 272 Rest of Asia Pacific Plant Extracts Market, by Type of Extract, 2023-2030 (US$ Mn)
TABLE 273 Rest of Asia Pacific Plant Extracts Market, by Form of Extract, 2017-2022 (US$ Mn)
TABLE 274 Rest of Asia Pacific Plant Extracts Market, by Form of Extract, 2023-2030 (US$ Mn)
TABLE 275 Rest of Asia Pacific Plant Extracts Market, by Application, 2017-2022 (US$ Mn)
TABLE 276 Rest of Asia Pacific Plant Extracts Market, by Application, 2023-2030 (US$ Mn)
TABLE 277 Rest of Asia Pacific Plant Extracts Market, by Plant Source, 2017-2022 (US$ Mn)
TABLE 278 Rest of Asia Pacific Plant Extracts Market, by Plant Source, 2023-2030 (US$ Mn)
TABLE 279 Rest of Asia Pacific Plant Extracts Market, by End Users, 2017-2022 (US$ Mn)
TABLE 280 Rest of Asia Pacific Plant Extracts Market, by End Users, 2023-2030 (US$ Mn)
TABLE 281 Latin America Plant Extracts Market, by Type of Extract, 2017-2022 (US$ Mn)
TABLE 282 Latin America Plant Extracts Market, by Type of Extract, 2023-2030 (US$ Mn)
TABLE 283 Latin America Plant Extracts Market, by Form of Extract, 2017-2022 (US$ Mn)
TABLE 284 Latin America Plant Extracts Market, by Form of Extract, 2023-2030 (US$ Mn)
TABLE 285 Latin America Plant Extracts Market, by Application, 2017-2022 (US$ Mn)
TABLE 286 Latin America Plant Extracts Market, by Application, 2023-2030 (US$ Mn)
TABLE 287 Latin America Plant Extracts Market, by Plant Source, 2017-2022 (US$ Mn)
TABLE 288 Latin America Plant Extracts Market, by Plant Source, 2023-2030 (US$ Mn)
TABLE 289 Latin America Plant Extracts Market, by End Users, 2017-2022 (US$ Mn)
TABLE 290 Latin America Plant Extracts Market, by End Users, 2023-2030 (US$ Mn)
TABLE 291 Brazil Plant Extracts Market, by Type of Extract, 2017-2022 (US$ Mn)
TABLE 292 Brazil Plant Extracts Market, by Type of Extract, 2023-2030 (US$ Mn)
TABLE 293 Brazil Plant Extracts Market, by Form of Extract, 2017-2022 (US$ Mn)
TABLE 294 Brazil Plant Extracts Market, by Form of Extract, 2023-2030 (US$ Mn)
TABLE 295 Brazil Plant Extracts Market, by Application, 2017-2022 (US$ Mn)
TABLE 296 Brazil Plant Extracts Market, by Application, 2023-2030 (US$ Mn)
TABLE 297 Brazil Plant Extracts Market, by Plant Source, 2017-2022 (US$ Mn)
TABLE 298 Brazil Plant Extracts Market, by Plant Source, 2023-2030 (US$ Mn)
TABLE 299 Brazil Plant Extracts Market, by End Users, 2017-2022 (US$ Mn)
TABLE 300 Brazil Plant Extracts Market, by End Users, 2023-2030 (US$ Mn)
TABLE 301 Argentina Plant Extracts Market, by Type of Extract, 2017-2022 (US$ Mn)
TABLE 302 Argentina Plant Extracts Market, by Type of Extract, 2023-2030 (US$ Mn)
TABLE 303 Argentina Plant Extracts Market, by Form of Extract, 2017-2022 (US$ Mn)
TABLE 304 Argentina Plant Extracts Market, by Form of Extract, 2023-2030 (US$ Mn)
TABLE 305 Argentina Plant Extracts Market, by Application, 2017-2022 (US$ Mn)
TABLE 306 Argentina Plant Extracts Market, by Application, 2023-2030 (US$ Mn)
TABLE 307 Argentina Plant Extracts Market, by Plant Source, 2017-2022 (US$ Mn)
TABLE 308 Argentina Plant Extracts Market, by Plant Source, 2023-2030 (US$ Mn)
TABLE 309 Argentina Plant Extracts Market, by End Users, 2017-2022 (US$ Mn)
TABLE 310 Argentina Plant Extracts Market, by End Users, 2023-2030 (US$ Mn)
TABLE 311 Rest of Latin America Plant Extracts Market, by Type of Extract, 2017-2022 (US$ Mn)
TABLE 312 Rest of Latin America Plant Extracts Market, by Type of Extract, 2023-2030 (US$ Mn)
TABLE 313 Rest of Latin America Plant Extracts Market, by Form of Extract, 2017-2022 (US$ Mn)
TABLE 314 Rest of Latin America Plant Extracts Market, by Form of Extract, 2023-2030 (US$ Mn)
TABLE 315 Rest of Latin America Plant Extracts Market, by Application, 2017-2022 (US$ Mn)
TABLE 316 Rest of Latin America Plant Extracts Market, by Application, 2023-2030 (US$ Mn)
TABLE 317 Rest of Latin America Plant Extracts Market, by Plant Source, 2017-2022 (US$ Mn)
TABLE 318 Rest of Latin America Plant Extracts Market, by Plant Source, 2023-2030 (US$ Mn)
TABLE 319 Rest of Latin America Plant Extracts Market, by End Users, 2017-2022 (US$ Mn)
TABLE 320 Rest of Latin America Plant Extracts Market, by End Users, 2023-2030 (US$ Mn)
TABLE 321 Middle East Plant Extracts Market, by Type of Extract, 2017-2022 (US$ Mn)
TABLE 322 Middle East Plant Extracts Market, by Type of Extract, 2023-2030 (US$ Mn)
TABLE 323 Middle East Plant Extracts Market, by Form of Extract, 2017-2022 (US$ Mn)
TABLE 324 Middle East Plant Extracts Market, by Form of Extract, 2023-2030 (US$ Mn)
TABLE 325 Middle East Plant Extracts Market, by Application, 2017-2022 (US$ Mn)
TABLE 326 Middle East Plant Extracts Market, by Application, 2023-2030 (US$ Mn)
TABLE 327 Middle East Plant Extracts Market, by Plant Source, 2017-2022 (US$ Mn)
TABLE 328 Middle East Plant Extracts Market, by Plant Source, 2023-2030 (US$ Mn)
TABLE 329 Middle East Plant Extracts Market, by End Users, 2017-2022 (US$ Mn)
TABLE 330 Middle East Plant Extracts Market, by End Users, 2023-2030 (US$ Mn)
TABLE 331 UAE Plant Extracts Market, by Type of Extract, 2017-2022 (US$ Mn)
TABLE 332 UAE Plant Extracts Market, by Type of Extract, 2023-2030 (US$ Mn)
TABLE 333 UAE Plant Extracts Market, by Form of Extract, 2017-2022 (US$ Mn)
TABLE 334 UAE Plant Extracts Market, by Form of Extract, 2023-2030 (US$ Mn)
TABLE 335 UAE Plant Extracts Market, by Application, 2017-2022 (US$ Mn)
TABLE 336 UAE Plant Extracts Market, by Application, 2023-2030 (US$ Mn)
TABLE 337 UAE Plant Extracts Market, by Plant Source, 2017-2022 (US$ Mn)
TABLE 338 UAE Plant Extracts Market, by Plant Source, 2023-2030 (US$ Mn)
TABLE 339 UAE Plant Extracts Market, by End Users, 2017-2022 (US$ Mn)
TABLE 340 UAE Plant Extracts Market, by End Users, 2023-2030 (US$ Mn)
TABLE 341 Saudi Arabia Plant Extracts Market, by Type of Extract, 2017-2022 (US$ Mn)
TABLE 342 Saudi Arabia Plant Extracts Market, by Type of Extract, 2023-2030 (US$ Mn)
TABLE 343 Saudi Arabia Plant Extracts Market, by Form of Extract, 2017-2022 (US$ Mn)
TABLE 344 Saudi Arabia Plant Extracts Market, by Form of Extract, 2023-2030 (US$ Mn)
TABLE 345 Saudi Arabia Plant Extracts Market, by Application, 2017-2022 (US$ Mn)
TABLE 346 Saudi Arabia Plant Extracts Market, by Application, 2023-2030 (US$ Mn)
TABLE 347 Saudi Arabia Plant Extracts Market, by Plant Source, 2017-2022 (US$ Mn)
TABLE 348 Saudi Arabia Plant Extracts Market, by Plant Source, 2023-2030 (US$ Mn)
TABLE 349 Saudi Arabia Plant Extracts Market, by End Users, 2017-2022 (US$ Mn)
TABLE 350 Saudi Arabia Plant Extracts Market, by End Users, 2023-2030 (US$ Mn)
TABLE 351 Rest of Middle East Plant Extracts Market, by Type of Extract, 2017-2022 (US$ Mn)
TABLE 352 Rest of Middle East Plant Extracts Market, by Type of Extract, 2023-2030 (US$ Mn)
TABLE 353 Rest of Middle East Plant Extracts Market, by Form of Extract, 2017-2022 (US$ Mn)
TABLE 354 Rest of Middle East Plant Extracts Market, by Form of Extract, 2023-2030 (US$ Mn)
TABLE 355 Rest of Middle East Plant Extracts Market, by Application, 2017-2022 (US$ Mn)
TABLE 356 Rest of Middle East Plant Extracts Market, by Application, 2023-2030 (US$ Mn)
TABLE 357 Rest of Middle East Plant Extracts Market, by Plant Source, 2017-2022 (US$ Mn)
TABLE 358 Rest of Middle East Plant Extracts Market, by Plant Source, 2023-2030 (US$ Mn)
TABLE 359 Rest of Middle East Plant Extracts Market, by End Users, 2017-2022 (US$ Mn)
TABLE 360 Rest of Middle East Plant Extracts Market, by End Users, 2023-2030 (US$ Mn)
TABLE 361 Africa Plant Extracts Market, by Type of Extract, 2017-2022 (US$ Mn)
TABLE 362 Africa Plant Extracts Market, by Type of Extract, 2023-2030 (US$ Mn)
TABLE 363 Africa Plant Extracts Market, by Form of Extract, 2017-2022 (US$ Mn)
TABLE 364 Africa Plant Extracts Market, by Form of Extract, 2023-2030 (US$ Mn)
TABLE 365 Africa Plant Extracts Market, by Application, 2017-2022 (US$ Mn)
TABLE 366 Africa Plant Extracts Market, by Application, 2023-2030 (US$ Mn)
TABLE 367 Africa Plant Extracts Market, by Plant Source, 2017-2022 (US$ Mn)
TABLE 368 Africa Plant Extracts Market, by Plant Source, 2023-2030 (US$ Mn)
TABLE 369 Africa Plant Extracts Market, by End Users, 2017-2022 (US$ Mn)
TABLE 370 Africa Plant Extracts Market, by End Users, 2023-2030 (US$ Mn)
TABLE 371 South Africa Plant Extracts Market, by Type of Extract, 2017-2022 (US$ Mn)
TABLE 372 South Africa Plant Extracts Market, by Type of Extract, 2023-2030 (US$ Mn)
TABLE 373 South Africa Plant Extracts Market, by Form of Extract, 2017-2022 (US$ Mn)
TABLE 374 South Africa Plant Extracts Market, by Form of Extract, 2023-2030 (US$ Mn)
TABLE 375 South Africa Plant Extracts Market, by Application, 2017-2022 (US$ Mn)
TABLE 376 South Africa Plant Extracts Market, by Application, 2023-2030 (US$ Mn)
TABLE 377 South Africa Plant Extracts Market, by Plant Source, 2017-2022 (US$ Mn)
TABLE 378 South Africa Plant Extracts Market, by Plant Source, 2023-2030 (US$ Mn)
TABLE 379 South Africa Plant Extracts Market, by End Users, 2017-2022 (US$ Mn)
TABLE 380 South Africa Plant Extracts Market, by End Users, 2023-2030 (US$ Mn)
TABLE 381 Egypt Plant Extracts Market, by Type of Extract, 2017-2022 (US$ Mn)
TABLE 382 Egypt Plant Extracts Market, by Type of Extract, 2023-2030 (US$ Mn)
TABLE 383 Egypt Plant Extracts Market, by Form of Extract, 2017-2022 (US$ Mn)
TABLE 384 Egypt Plant Extracts Market, by Form of Extract, 2023-2030 (US$ Mn)
TABLE 385 Egypt Plant Extracts Market, by Application, 2017-2022 (US$ Mn)
TABLE 386 Egypt Plant Extracts Market, by Application, 2023-2030 (US$ Mn)
TABLE 387 Egypt Plant Extracts Market, by Plant Source, 2017-2022 (US$ Mn)
TABLE 388 Egypt Plant Extracts Market, by Plant Source, 2023-2030 (US$ Mn)
TABLE 389 Egypt Plant Extracts Market, by End Users, 2017-2022 (US$ Mn)
TABLE 390 Egypt Plant Extracts Market, by End Users, 2023-2030 (US$ Mn)
TABLE 391 Rest of Africa Plant Extracts Market, by Type of Extract, 2017-2022 (US$ Mn)
TABLE 392 Rest of Africa Plant Extracts Market, by Type of Extract, 2023-2030 (US$ Mn)
TABLE 393 Rest of Africa Plant Extracts Market, by Form of Extract, 2017-2022 (US$ Mn)
TABLE 394 Rest of Africa Plant Extracts Market, by Form of Extract, 2023-2030 (US$ Mn)
TABLE 395 Rest of Africa Plant Extracts Market, by Application, 2017-2022 (US$ Mn)
TABLE 396 Rest of Africa Plant Extracts Market, by Application, 2023-2030 (US$ Mn)
TABLE 397 Rest of Africa Plant Extracts Market, by Plant Source, 2017-2022 (US$ Mn)
TABLE 398 Rest of Africa Plant Extracts Market, by Plant Source, 2023-2030 (US$ Mn)
TABLE 399 Rest of Africa Plant Extracts Market, by End Users, 2017-2022 (US$ Mn)
TABLE 400 Rest of Africa Plant Extracts Market, by End Users, 2023-2030 (US$ Mn)


How big is the global market for plant extracts right now?

In 2022, the plant extracts market was estimated to be worth USD 34154.8 million.

What is the plant extracts market’s anticipated growth rate from 2023 to 2030?

The market for plant extracts is anticipated to increase at a CAGR of 12.80% from 2023 to 2030, reaching USD 89520.92 million in 2030.

In terms of the type of extract, which market category is in the lead?

The most widely used type of extract is the herbal extracts.

Which segment is leading the market in terms of the form of the extract?

Liquid extracts, by the form of extract, are the notable segment.

Which application segment is estimated to have the highest CAGR throughout the forecast period?

The pharmaceuticals category is anticipated to exhibit the highest CAGR during the projection period.

Plant Based Plastic Green Plastic Market

Published:
Report ID: 55230

Bioresorbable Implants Market

Published:
Report ID: 54326

Tissue And Organ Transplantation Market

Published:
Report ID: 52783

Flower Pots And Planters Market

Published:
Report ID: 52089

Dental Implants Market

Published:
Report ID: 5759

Organ Transplantation Market

Published:
Report ID: 50467

Orthopedic Implants Market

Published:
Report ID: 22006

Plant Based Food Packaging Market

Published:
Report ID: 50402

Soy And Milk Protein Ingredients Market

Published:
Report ID: 55256

Meat Substitutes Market

Published:
Report ID: 8481

Dairy Nutritional And Nutraceutical Ingredients Market

Published:
Report ID: 54549

Sugar Free Lifesavers Market

Published:
Report ID: 52346

Electrolyte Drinks Market

Published:
Report ID: 52029

Anti-Caking Agents Market

Published:
Report ID: 53392

Cold Chain Equipment Market

Published:
Report ID: 3766

Thermoformed Plastic Products Market

Published:
Report ID: 52770

Seedless Watermelon Seed Market

Published:
Report ID: 52343

Caps and Closures Market

Published:
Report ID: 52281

Green Pepper Market

Published:
Report ID: 51990

Protein Stability Analysis Market

Published:
Report ID: 51433

Purchase Options

The report comes as a view-only PDF document, optimized for individual clients. This version is recommended for personal digital use and does not allow printing.
$3699

To meet the needs of modern corporate teams, our report comes in two formats: a printable PDF and a data-rich Excel sheet. This package is optimized for internal analysis and multi-location access, making it an excellent choice for organizations with distributed workforce.
$4699

The report will be delivered in printable PDF format along with the report’s data Excel sheet. This license offers 100 Free Analyst hours where the client can utilize Credence Research Inc.’s research team. It is highly recommended for organizations seeking to execute short, customized research projects related to the scope of the purchased report.
$6699

Smallform of Sample request

Have a question?

User Profile

Don’t settle for less – trust Mitul to help you find the best solution.

Report delivery within 24 to 48 hours

– Other Info –

What people say?-

User Review

I am very impressed with the information in this report. The author clearly did their research when they came up with this product and it has already given me a lot of ideas.

Jana Schmidt
CEDAR CX Technologies

– Connect with us –

Phone

+91 6232 49 3207


support

24/7 Research Support


sales@credenceresearch.com

– Research Methodology –

Going beyond the basics: advanced techniques in research methodology

– Trusted By –

Pepshi, LG, Nestle
Motorola, Honeywell, Johnson and johnson
LG Chem, SIEMENS, Pfizer
Unilever, Samsonite, QIAGEN