Market Overview
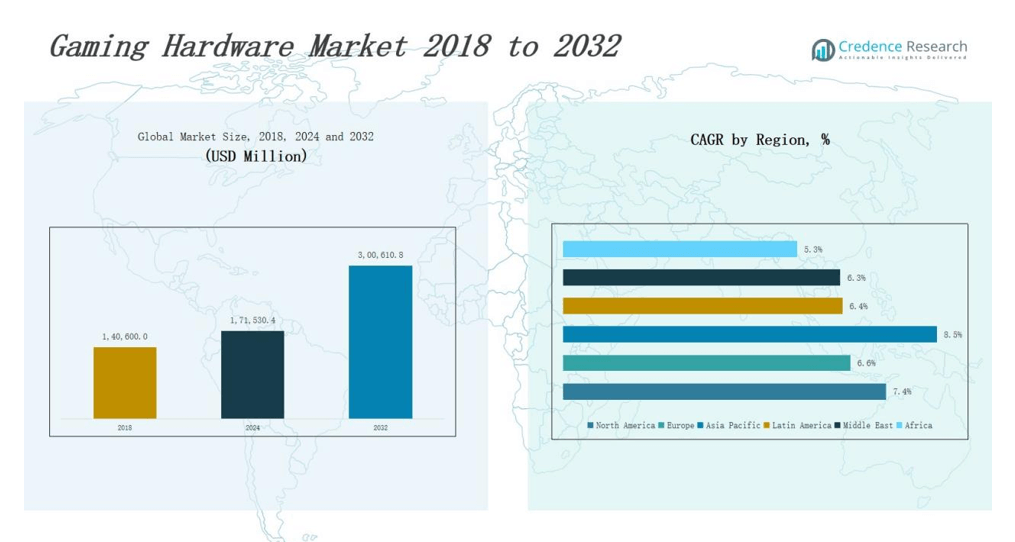
Gaming Hardware Market size was valued at USD 1,40,600.0 million in 2018 to USD 1,71,530.4 million in 2024 and is anticipated to reach USD 3,00,610.8 million by 2032, at a CAGR of 7.4% during the forecast period.
| REPORT ATTRIBUTE |
DETAILS |
| Historical Period |
2020-2023 |
| Base Year |
2024 |
| Forecast Period |
2025-2032 |
| Gaming Hardware Market Size 2024 |
USD 1,71,530.4 million |
| Gaming Hardware Market, CAGR |
7.4% |
| Gaming Hardware Market Size 2032 |
USD 3,00,610.8 million |
The Gaming Hardware Market is shaped by global leaders such as Sony Corporation, Microsoft Corporation, Nintendo Co., Ltd., ASUS, Lenovo, Dell Technologies, Acer Inc., and Razer Inc., each driving competitiveness through innovations in consoles, gaming laptops, accessories, and peripherals. These companies strengthen their market presence through product launches, immersive technologies, and growing investments in high-performance gaming systems. Regionally, North America dominates the Gaming Hardware Market with a 39 percent share, supported by strong consumer demand, widespread adoption of advanced gaming platforms, and the presence of key manufacturers that continuously expand product portfolios and enhance gaming experiences.
Market Insights
- The Gaming Hardware Market grew from USD 1,40,600.0 million in 2018 to USD 1,71,530.4 million in 2024 and will reach USD 3,00,610.8 million by 2032.
- Leading companies such as Sony, Microsoft, Nintendo, ASUS, Lenovo, Dell, Acer, and Razer drive competition through advanced consoles, gaming laptops, and immersive technologies.
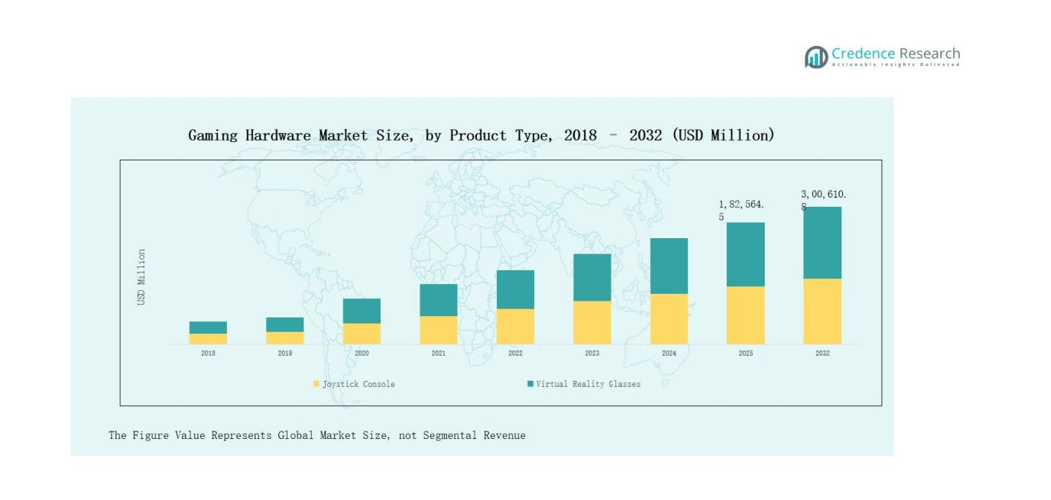
- Joystick consoles dominate by product type with 55 percent share, while virtual reality glasses expand rapidly with 45 percent share, supported by e-sports and immersive experiences.
- Residential applications lead with 62 percent share, followed by commercial at 28 percent and others at 10 percent, fueled by online platforms and rising entertainment demand.
- North America commands 34 percent share, Europe holds 22 percent, Asia Pacific captures 27 percent, while Latin America, Middle East, and Africa account for 6, 5, and 3 percent respectively.
Access crucial information at unmatched prices!
Request your sample report today & start making informed decisions powered by Credence Research Inc.!
Download Sample
Market Segment Insights
By Product Type
The gaming hardware market by product type is dominated by joystick consoles, holding a 55 percent share. Growth is driven by the popularity of advanced gaming consoles, exclusive titles, and integration of cloud-based gaming services. Virtual reality glasses, with a 45 percent share, are rapidly expanding due to immersive gaming experiences, rising adoption in e-sports, and falling device costs. Their future growth is also supported by increasing demand for simulation-based training, rising affordability, and continuous technological upgrades enhancing overall consumer experience globally.
- For instance, Sony’s PlayStation 5, which surpassed 50 million units sold by December 2023, combines powerful hardware with exclusive titles like Spider-Man 2 and integrates cloud gaming through PlayStation Plus
By Application
The residential segment leads the gaming hardware market with a 62 percent share, supported by increasing consumer spending, online multiplayer platforms, and home-based entertainment demand. The commercial segment accounts for 28 percent, driven by gaming cafes, e-sports arenas, and theme-based arcades. The remaining 10 percent share is attributed to other uses, including educational simulations and corporate training applications. Growth in residential use is further reinforced by rising internet connectivity, subscription-based gaming services, and adoption of immersive devices for interactive experiences.
By End-Use
The PC and laptop segment holds the largest share at 48 percent, fueled by widespread availability of gaming laptops, customizable desktops, and strong demand from professional gamers. Smartphones contribute 32 percent, supported by mobile gaming growth, app-based revenue models, and high smartphone penetration. Televisions account for 20 percent, driven by console-based gaming and the popularity of large-screen immersive experiences. Market growth is also supported by rapid cloud gaming adoption, integration with smart devices, and rising demand for cross-platform gaming compatibility worldwide.
- For instance, ASUS reported in 2023 that its ROG gaming laptop line saw double-digit sales growth, supported by demand for high-refresh-rate displays and AI-powered performance features.
Market Overview
Rising Popularity of E-Sports and Online Gaming
The gaming hardware market benefits strongly from the global rise of e-sports and online multiplayer platforms. Increasing participation in competitive gaming has driven demand for advanced consoles, high-performance PCs, and professional-grade accessories. Streaming platforms and sponsorship deals further fuel this growth, pushing gamers toward upgrading to the latest hardware. This shift has made gaming a mainstream entertainment medium, enhancing the sales of joysticks, VR devices, and other specialized hardware. The trend is expected to continue as e-sports gain wider recognition worldwide.
- For instance, Sony’s PlayStation 5 surpassed 50 million units sold by late 2023, driven by the surge in competitive gaming and immersive experiences.
Technological Advancements in Gaming Devices
Advances in graphics processing, processors, and immersive technologies are shaping the gaming hardware market. Hardware innovation, such as ray-tracing GPUs, 4K and 8K compatibility, and cloud-enabled consoles, significantly enhances gameplay experiences. VR and AR integration has also expanded opportunities by creating realistic and interactive environments. These innovations appeal to both casual and professional gamers, fueling consistent hardware upgrades. Companies invest heavily in R&D to launch next-gen devices, strengthening market expansion and boosting hardware adoption across multiple gaming platforms.
- For instance, NVIDIA’s GeForce RTX 40 Series GPUs (launched in 2022) introduced real-time ray tracing and AI-powered DLSS 3, delivering up to four times the performance boost in supported titles.
Expanding Mobile and Cloud Gaming Ecosystem
Mobile and cloud gaming services are fueling demand for gaming hardware across global markets. With smartphones achieving console-level processing capabilities, mobile gaming has become a leading revenue driver. Cloud gaming platforms allow users to play advanced titles without owning high-end consoles, further boosting the appeal of accessories such as controllers and headsets. This ecosystem expands accessibility while encouraging hardware upgrades for enhanced performance. Rising internet penetration, 5G rollout, and affordable subscription-based models continue to reinforce this growth driver.
Key Trends & Opportunities
Integration of Virtual Reality and Augmented Reality
The adoption of VR and AR devices in gaming hardware is a rising opportunity. Virtual reality glasses, motion sensors, and haptic devices create immersive experiences that attract both residential and commercial users. The increasing popularity of metaverse platforms and simulation-based training also supports VR integration in gaming ecosystems. Falling hardware costs and software compatibility improvements make VR devices more accessible to consumers. This trend is expected to reshape gaming experiences and generate long-term opportunities for hardware manufacturers.
- For instance, Sony launched the PlayStation VR2 in February 2023, featuring OLED 4K HDR displays and advanced eye-tracking technology, significantly enriching immersive console gaming.
Growing Penetration of Smart TVs and Streaming Platforms
Smart TVs integrated with gaming features and streaming platforms are influencing hardware adoption. Gamers are shifting to television-based gaming powered by consoles, cloud access, and integrated applications. The demand for larger screens with higher refresh rates enhances console sales and accessories demand. Streaming platforms like Twitch and YouTube Gaming also create opportunities by encouraging hardware upgrades for competitive performance. This trend strengthens commercial and residential segments alike, positioning TV and streaming-driven gaming as a strong growth opportunity.
- For instance, Samsung introduced its Gaming Hub in 2022, directly integrating Xbox Cloud Gaming and NVIDIA GeForce NOW into its Smart TVs, eliminating the need for extra hardware.
Key Challenges
High Costs of Advanced Gaming Hardware
The rising cost of gaming consoles, VR devices, and high-performance PCs poses a major challenge. Consumers in price-sensitive regions often hesitate to invest in premium devices due to affordability concerns. Rapid technological upgrades further shorten hardware life cycles, creating higher replacement costs. This issue limits adoption in developing markets where disposable income levels are lower. While subscription services partially reduce financial barriers, expensive hardware remains a restraint for widespread consumer penetration across the global gaming ecosystem.
Shortages in Semiconductor Supply Chains
The gaming hardware market faces significant disruption from global semiconductor shortages. Advanced processors and graphic cards are critical for console and PC production, making hardware supply heavily reliant on chip availability. Supply chain disruptions and geopolitical uncertainties have raised costs and caused production delays. This directly impacts the availability of consoles, VR devices, and high-performance laptops. Companies often struggle to meet rising demand during peak launches, affecting sales and customer satisfaction. Stability in supply chains remains a critical concern.
Rising Competition from Free-to-Play and Cloud Platforms
Free-to-play games and cloud platforms reduce dependency on expensive gaming hardware. As subscription-based services offer access to advanced titles on basic devices, consumer reliance on high-end consoles or PCs decreases. This shift challenges traditional hardware sales, particularly in regions with strong cloud adoption. Mobile devices also capture a significant portion of the gaming population, limiting upgrades to dedicated consoles. Companies must innovate to maintain hardware relevance, creating bundled ecosystems and unique experiences that cloud-only solutions cannot match.
Regional Analysis
North America
North America leads the gaming hardware market with a 34 percent share in 2024, valued at USD 60,806.5 million. Growth is supported by high adoption of advanced consoles, strong presence of key players like Microsoft and Sony, and widespread e-sports culture. The region is expected to reach USD 1,06,394.6 million by 2032 at a CAGR of 7.4 percent. Rising demand for VR and AR devices and integration of cloud-based gaming platforms further drive expansion, making North America the dominant hub for premium gaming hardware adoption.
Europe
Europe holds a 22 percent market share in 2024, with revenues of USD 39,927.6 million. Growth is driven by increasing popularity of PC-based gaming, strong demand for VR technologies, and expansion of e-sports leagues across major economies. The market is forecast to reach USD 65,759.4 million by 2032 at a CAGR of 6.6 percent. Countries like Germany, the UK, and France remain key revenue contributors. Continuous technological innovation, rising consumer spending, and the adoption of smart TVs and streaming platforms strengthen Europe’s market presence.
Asia Pacific
Asia Pacific accounts for a 27 percent market share in 2024, valued at USD 47,984.9 million. The region is projected to reach USD 91,785.7 million by 2032, recording the highest CAGR of 8.5 percent. Growth is fueled by strong smartphone penetration, expanding gaming communities in China, Japan, and South Korea, and rising investments in e-sports. Affordable hardware options and rapid adoption of VR technologies also contribute to the market. Asia Pacific’s expanding youth population and digital infrastructure position it as the fastest-growing gaming hardware market globally.
Latin America
Latin America captures a 6 percent market share in 2024, valued at USD 10,530.2 million. The market is forecast to reach USD 17,098.7 million by 2032, growing at a CAGR of 6.4 percent. Brazil and Mexico dominate due to increasing e-sports popularity and expanding internet penetration. Gaming cafes and console-based entertainment drive adoption, while affordable mobile gaming hardware boosts growth. Although price sensitivity limits high-end hardware demand, subscription services and rising disposable incomes are expected to expand hardware penetration in the region.
Middle East
The Middle East represents a 5 percent share of the gaming hardware market in 2024, with revenues at USD 7,820.7 million. The market is projected to grow to USD 12,657.4 million by 2032 at a CAGR of 6.3 percent. Growth is supported by expanding gaming hubs in GCC countries, strong demand for premium consoles, and government investments in digital entertainment. The region also shows rising interest in VR-based experiences and e-sports tournaments. Increasing penetration of smartphones and high-speed internet further enhance gaming hardware adoption in both commercial and residential sectors.
Africa
Africa holds a 3 percent market share in 2024, with revenues of USD 4,460.5 million. The market is set to reach USD 6,915.0 million by 2032 at a CAGR of 5.3 percent, the slowest among all regions. Growth is driven by rising smartphone gaming, expansion of internet services, and affordable entry-level consoles. South Africa leads the region, followed by Nigeria and Egypt. While infrastructure limitations and lower disposable incomes restrict rapid adoption of advanced devices, affordable cloud gaming solutions and mobile-based ecosystems offer long-term opportunities for market penetration.
Market Segmentations:
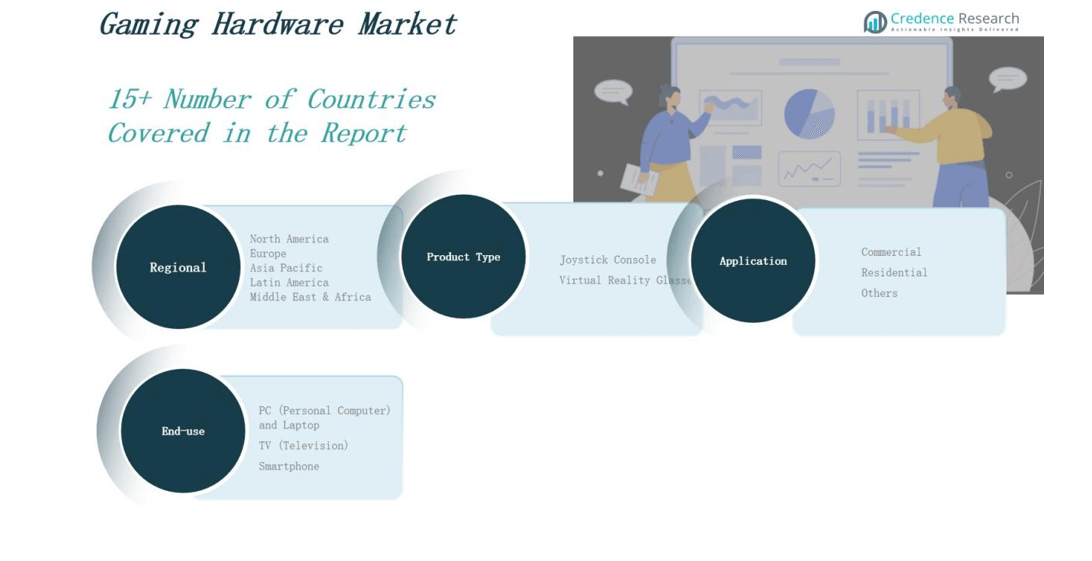
By Product Type
- Joystick Console
- Virtual Reality Glasses
By Application
- Commercial
- Residential
- Others
By End-Use
- PC (Personal Computer) and Laptop
- TV (Television)
- Smartphone
By Region
- North America
- Europe
- Germany
- France
- U.K.
- Italy
- Spain
- Rest of Europe
- Asia Pacific
- China
- Japan
- India
- South Korea
- South-east Asia
- Rest of Asia Pacific
- Latin America
- Brazil
- Argentina
- Rest of Latin America
- Middle East & Africa
- GCC Countries
- South Africa
- Rest of the Middle East and Africa
Competitive Landscape
The competitive landscape of the gaming hardware market is characterized by the presence of global technology leaders and specialized gaming companies that consistently invest in innovation to strengthen market share. Major players include Sony Corporation, Microsoft Corporation, Nintendo Co., Ltd., Apple Inc., Google, HTC Corporation, Oculus VR, LLC, Activision Blizzard, Inc., Sega Games Co., Ltd., GAMDIAS, and Anker Innovations Technology. These companies compete through next-generation product launches, integration of advanced processors and graphics technologies, and expansion of immersive hardware such as VR and AR devices. Strategic collaborations, acquisitions, and partnerships with software developers and streaming platforms further reinforce competitiveness. North America and Asia Pacific remain primary battlegrounds due to strong consumer bases and e-sports expansion. Continuous investment in cloud compatibility, wireless accessories, and high-performance devices helps firms maintain consumer loyalty. However, intense rivalry, rapid technology cycles, and supply chain constraints push players to differentiate through design, affordability, and enhanced user experiences.
Shape Your Report to Specific Countries or Regions & Enjoy 30% Off!
Key Players
- Sony Corporation
- Microsoft Corporation
- Apple Inc
- Google
- HTC Corporation
- Nintendo
- Linden Research, Inc.
- Activision Blizzard, Inc.
- Sega Games Co., Ltd.
- Oculus VR, LLC
- GAMDIAS
- Anker Innovations Technology
Recent Developments
- In October 2025, ASUS and Microsoft will officially release the ROG Xbox Ally and Ally X handhelds, powered by AMD Ryzen processors and Windows 11.
- In August 2025 at Gamescom, Sony introduced its latest INZONE gaming gear lineup, including headsets, keyboard, mouse, and pads, developed in collaboration with esports brand Fnatic.
- In 2025, AYN introduced two new Android handhelds—the dual‑screen Thor and the next‑gen Odin 3 highlighting dual‑screen design, AMOLED displays, and powerful Snapdragon processors
- In January 2025, AMD announced new gaming products including the Ryzen 9950X3D and 9900X3D desktop processors and the second-generation Ryzen Z2 handheld gaming PC processor.
Market Concentration & Characteristics
The Gaming Hardware Market shows a moderately concentrated structure with a mix of established global leaders and emerging regional players. It is defined by strong competition among companies such as Sony, Microsoft, Nintendo, and Apple, which dominate with advanced consoles, immersive VR devices, and performance-driven PCs. The market features high entry barriers due to the need for significant investment in research, development, and distribution networks. It is also shaped by rapid innovation cycles, pushing companies to upgrade product lines frequently to maintain consumer interest. Price competition, technological differentiation, and exclusive content partnerships play critical roles in shaping competitive advantage. It maintains strong demand across residential and commercial applications, supported by e-sports expansion and cloud-based platforms. Consumer loyalty toward brand ecosystems further increases market concentration. Despite ongoing pressure from mobile and cloud gaming, the market sustains steady growth through innovation in design, graphics, and integration with smart devices and entertainment systems.
Report Coverage
The research report offers an in-depth analysis based on Product Type, Application, End Use and Region. It details leading market players, providing an overview of their business, product offerings, investments, revenue streams, and key applications. Additionally, the report includes insights into the competitive environment, SWOT analysis, current market trends, as well as the primary drivers and constraints. Furthermore, it discusses various factors that have driven market expansion in recent years. The report also explores market dynamics, regulatory scenarios, and technological advancements that are shaping the industry. It assesses the impact of external factors and global economic changes on market growth. Lastly, it provides strategic recommendations for new entrants and established companies to navigate the complexities of the market.
Future Outlook
- Demand for immersive VR and AR devices will grow, enhancing user experience and gaming engagement.
- Cloud-based gaming platforms will expand hardware needs, encouraging accessories integration for seamless player experiences.
- Smartphone gaming hardware demand will surge, fueled by mobile penetration and strong app-based ecosystems.
- E-sports growth will increase demand for high-performance consoles, peripherals, and advanced competitive gaming setups.
- Smart TV adoption will strengthen console sales, supporting immersive gaming experiences in household entertainment spaces.
- Customizable PCs and laptops will gain traction, attracting professional gamers seeking performance-driven gaming devices.
- Hardware and software partnerships will expand bundled ecosystems, improving accessibility and enriching gaming content.
- Rising affordability concerns will drive mid-range device launches, supporting adoption in price-sensitive consumer markets.
- Strengthened global supply chains will stabilize hardware availability, reducing shortages and production bottlenecks.
- Sustainable designs and energy-efficient devices will gain traction, aligning with environmentally conscious consumer preferences.


