Market Overview:
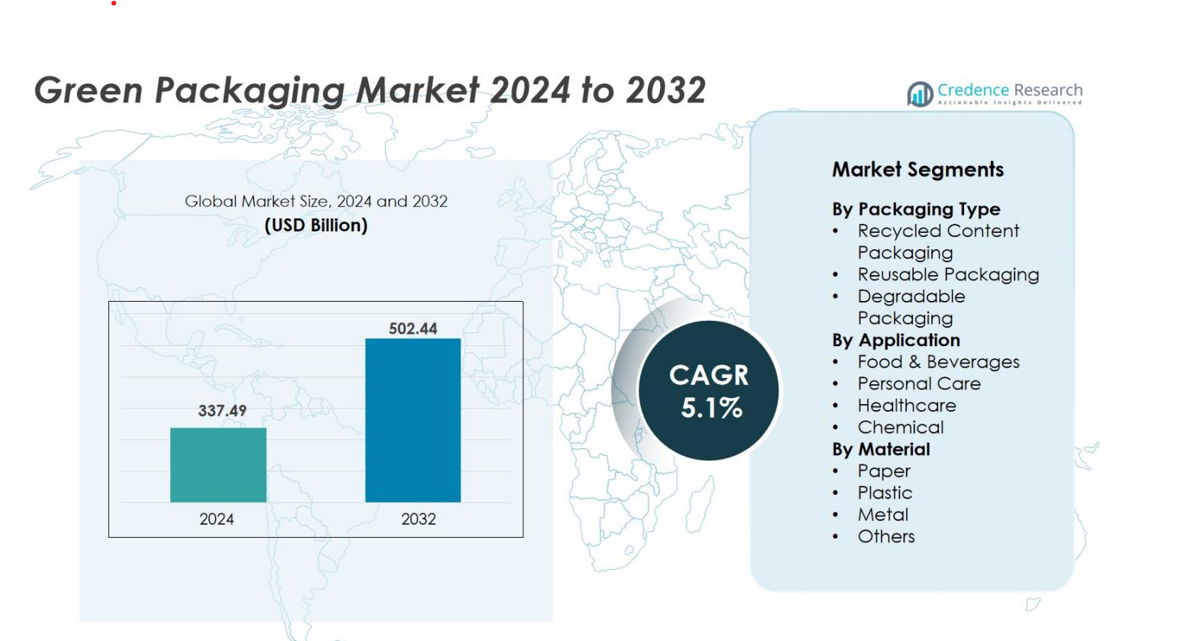
Green Packaging market size was valued USD 337.49 billion in 2024 and is anticipated to reach USD 502.44 billion by 2032, at a CAGR of 5.1% during the forecast period.
| REPORT ATTRIBUTE |
DETAILS |
| Historical Period |
2020-2023 |
| Base Year |
2024 |
| Forecast Period |
2025-2032 |
| Green Packaging Market Size 2024 |
USD 337.49 billion |
| Green Packaging Market, CAGR |
5.1% |
| Green Packaging Market Size 2032 |
USD 502.44 billion |
The Green Packaging market includes major players such as Amcor plc, Mondi, DS Smith Plc, Ball Corporation, Sealed Air, Tetra Laval, Nampak Ltd, Evergreen Packaging LLC and Be Green Packaging. These companies focus on recyclable materials, biodegradable films, and lightweight paper-based solutions to meet rising sustainability goals. Many suppliers expand production capacity and form partnerships with food, beverage, and e-commerce brands to strengthen their global presence. North America leads the market with 32% share, supported by strict sustainability regulations, strong recycling infrastructure and high consumer demand for eco-friendly products. Europe follows with 28% share, driven by advanced waste management systems and stringent environmental directives.
Market Insights
- The Green Packaging market was valued at USD 337.49 billion in 2024 and is projected to reach USD 502.44 billion by 2032, growing at a CAGR of 5.1% during the forecast period.
- Rising environmental awareness and strict regulations banning single-use plastics drive demand for recyclable and biodegradable packaging across food, beverages, and personal care industries.
- Trends such as bioplastics, molded fiber, lightweight paper cartons, and reusable packaging systems continue to expand as companies adopt circular economy models and sustainable product labeling.
- Competition remains strong with key players like Amcor, Mondi, DS Smith Plc, Ball Corporation, Sealed Air, and Tetra Laval investing in recyclable materials, capacity expansion, and partnerships with FMCG and e-commerce brands.
- North America holds 32% share, followed by Europe at 28% and Asia Pacific at 25%, while recycled content packaging leads the segment with 45% share due to established recycling infrastructure and high consumer preference.
Access crucial information at unmatched prices!
Request your sample report today & start making informed decisions powered by Credence Research Inc.!
Download Sample
Market Segmentation Analysis
By Packaging Type
Recycled content packaging holds 45% share, making it the dominant type in the green packaging market. Strong use in food, beverage, and e-commerce sectors drives demand. Manufacturers choose recycled material to cut plastic waste and meet sustainability rules. Reusable packaging continues to rise with refill systems in retail and cosmetics, while degradable packaging grows under bans on single-use plastics. Despite these gains, recycled content packaging stays ahead due to established recycling networks and high consumer acceptance.
- For instance, Amazon, aligning with net-zero ambitions, introduced packaging recycling initiatives with over 150 drop-off points in Dubai and optimizes packaging size to reduce waste.
By Application
Food & beverages account for 40% share, making it the largest application segment. Brands adopt compostable cups, paper cartons, and recycled trays to reduce waste and improve brand image. Personal care follows with sustainable tubes, bottles, and refill models across skincare and cosmetics. Healthcare and chemical products show steady growth with recyclable and medical-grade bioplastic packaging. High global consumption and strict food safety rules help food & beverages remain the leading segment.
- For instance, Huhtamaki Oyj offers fiber-based compostable foodservice packaging, serving quick-service restaurants with capacities ranging from below 12 oz to above 32 oz, focusing on institutional catering applications.
By Material
Paper holds the dominant position with 50% share in the material segment. It is widely used for cartons, paperboard boxes, molded fiber trays, and bags due to easy recyclability and low environmental impact. Recycled and bio-based plastic materials grow quickly in beverages, household goods, and retail packaging. Metal packaging, including aluminum cans, benefits from strong recycling rates. Other materials such as glass and bio-composites serve niche uses. Paper remains the leader because it is cost-efficient and accepted by consumers and regulators.
Key Growth Drivers
Rising Environmental Regulations and Sustainability Mandates
Governments across the world are enforcing stricter environmental laws that limit plastic usage and promote recyclable materials. These mandates encourage industries to shift toward eco-friendly packaging formats such as recycled content, biodegradable films, and molded fiber products. Many countries have banned single-use plastics and introduced extended producer responsibility rules, pushing manufacturers to adopt greener packaging choices. Brands also face pressure to disclose environmental performance, which increases investment in sustainable materials and recyclable formats. As regulatory frameworks strengthen, companies move toward circular packaging systems to reduce waste and carbon emissions.
- For instance, P&G increased its recycled resin use in packaging from 52,800 metric tons in FY19/20 to 96,469 metric tons in FY21/22, a clear marker of increased sustainable material investments. P&G has also stated that it has doubled its use of recycled resin since fiscal year 2018.
Growing Consumer Demand for Eco-Friendly Products
Consumers increasingly prefer products packaged in biodegradable, recyclable, or reusable formats. Rising awareness of climate change, ocean pollution, and landfill waste influences purchasing behavior, especially in developed markets. Many buyers associate sustainable packaging with product quality and ethical business practices, pushing brands to redesign packaging. Food and beverage companies, e-commerce brands, and cosmetic manufacturers respond by replacing plastic with paper, molded pulp, and recycled materials. Retailers also promote eco-labels and zero-plastic aisles, which expand consumer access to green packaged products.
- For instance, Unilever has introduced its Love Beauty and Planet line, which features 100% recycled plastic bottles. This innovation emphasizes the reduction of virgin plastic use and elevates eco-conscious packaging, helping to meet environmentally aware consumer expectations.
Expansion of Circular Economy and Recycling Infrastructure
Global investment in recycling facilities, composting plants, and material recovery systems supports large-scale adoption of green packaging. Companies collaborate with recycling firms to improve collection, sorting, and reuse of paper, metals, and recycled plastics. The circular economy model allows brands to reduce material costs, minimize waste, and retain resources within production cycles. E-commerce companies and FMCG brands invest in reusable shipping boxes, pallet wraps, and returnable packaging systems. Many packaging producers adopt life-cycle assessments to improve sustainability performance and reduce carbon footprints. These developments accelerate demand for recycled content packaging, making circular systems a long-term growth driver.
Key Trends & Opportunities
Rapid Growth of Biodegradable and Compostable Materials
Bioplastics, compostable films, and plant-based trays are gaining strong acceptance across food, beverage, and retail packaging. Materials like PLA, bagasse, and starch-based films offer lower carbon impact and decompose without toxic residue. Start-ups and major brands invest in bio-based packaging to replace petroleum-based plastics. Governments provide tax benefits and certifications to support compostable packaging adoption. This creates opportunities for material suppliers, packaging converters, and recycling companies to expand their presence in green packaging ecosystems.
- For instance, RWDC Industries manufactures a biopolymer named Solon, a type of polyhydroxyalkanoate (PHA), derived through microbial fermentation using plant-based oils or waste cooking oils. Solon is certified by TÜV Austria as fully biodegradable in soil, fresh water, and marine environments.
Rise of Smart and Minimalist Packaging Design
Companies adopt lightweight, minimalist packaging to cut material waste and transportation emissions. Digital printing and smart labels help brands use less ink, track recyclability, and improve supply chain efficiency. E-commerce players use right-sized packaging to reduce void space and shipping waste. Smart QR and NFC tags support customer education on recycling instructions and traceability. These trends enable brands to enhance sustainability while maintaining product protection, creating new market opportunities.
- For instance, HP’s PageWide C500 Press can print up to 1,800 corrugated sheets per hour with no print plates, enabling just-in-time production that cuts setup waste and inventory needs significantly.
Key Challenges
Higher Production Costs and Limited Material Availability
Green packaging materials such as bioplastics and renewable fibers often cost more than conventional plastic. Manufacturers face challenges in scaling production due to limited raw material availability and complex supply chains. Small and medium enterprises struggle to transition because eco-friendly packaging requires investment in new machinery and certification processes. Higher production costs lead to premium pricing, which reduces adoption in cost-sensitive markets. Overcoming this challenge requires innovation, subsidies, and large-scale material sourcing.
Recycling and Composting Infrastructure Gaps
Many regions lack proper infrastructure to support recycling and composting of biodegradable or recyclable materials. Items labeled recyclable often end up in landfills due to poor segregation and limited municipal facilities. Compostable materials need industrial composting, which is unavailable in several countries. Lack of standard labeling creates consumer confusion and contamination of recycling streams. These gaps restrict the full potential of green packaging and delay mass adoption, especially in emerging markets.
Regional Analysis
North America
North America holds 32% share of the green packaging market, driven by strong sustainability regulations and consumer preference for recyclable products. The U.S. leads adoption across food, beverages, and e-commerce, with major brands shifting to paper-based and compostable formats. Investments in recycling infrastructure and extended producer responsibility laws support high usage of recycled content packaging. Canada promotes plastic ban policies and circular economy programs, increasing demand for reusable and biodegradable materials. Rising environmental awareness and corporate sustainability commitments continue to strengthen market growth in the region.
Europe
Europe accounts for 28% share, supported by strict environmental legislation and advanced waste management systems. The EU’s directives on single-use plastics and carbon reduction goals push companies to adopt eco-friendly packaging formats. Germany, France, and the U.K. lead innovations in recyclable paper, metal cans, and bio-based plastic. Retail and FMCG industries invest in sustainable labels and refill-based packaging. High recycling rates and strong consumer preference for green packaged goods keep Europe among the leading markets.
Asia Pacific
Asia Pacific holds 25% share, emerging as one of the fastest-growing regions due to rising industrial activity and population growth. China, India, Japan, and South Korea promote plastic reduction rules and sustainable alternatives. Local manufacturers increasingly use recycled paper, molded fiber trays, and lightweight packaging for food delivery and retail sectors. Growing urbanization, rising disposable incomes, and eco-conscious consumers support market expansion. Government-backed recycling initiatives further accelerate adoption across major economies.
Latin America
Latin America captures 8% share, supported by increasing environmental policies and corporate sustainability targets. Brazil and Mexico lead adoption of recyclable and biodegradable packaging in food, beverage, and personal care sectors. The region sees steady demand for paper-based and compostable solutions due to rising awareness and regulatory pressure. Limited recycling infrastructure remains a constraint, yet government-backed waste collection programs are improving. Growing retail and e-commerce activities also boost demand for green shipping materials.
Middle East & Africa
Middle East & Africa hold 7% share, with gradual adoption of sustainable packaging solutions. Rising consumer awareness and government initiatives for waste reduction encourage companies to use recyclable paper, metal cans, and bioplastic materials. UAE, Saudi Arabia, and South Africa lead regional adoption in food, beverages, and cosmetics. The region benefits from increasing sustainability commitments by multinational brands. However, limited recycling facilities and higher costs of eco-friendly materials slow widespread adoption. Growing environmental regulations and industrial development are expected to support future demand.
Market Segmentations
By Packaging Type
- Recycled Content Packaging
- Reusable Packaging
- Degradable Packaging
By Application
- Food & Beverages
- Personal Care
- Healthcare
- Chemical
By Material
- Paper
- Plastic
- Metal
- Others
By Geography
- North America
- Europe
- Germany
- France
- U.K.
- Italy
- Spain
- Rest of Europe
- Asia Pacific
- China
- Japan
- India
- South Korea
- South-east Asia
- Rest of Asia Pacific
- Latin America
- Brazil
- Argentina
- Rest of Latin America
- Middle East & Africa
- GCC Countries
- South Africa
- Rest of the Middle East and Africa
Competitive Landscape
The competitive landscape of the green packaging market features global companies focusing on sustainable innovation, recyclable materials, and circular economy initiatives. Major players such as Amcor plc, Mondi, DS Smith Plc, Ball Corporation, Tetra Laval, Sealed Air, and Evergreen Packaging invest in eco-friendly product portfolios, including recycled content packaging, compostable formats, and lightweight paper solutions. Many firms expand capacity for molded fiber trays, plant-based plastics, and recyclable cartons to meet rising consumer and regulatory demand. Strategic partnerships with food, beverage, and e-commerce brands support large-scale commercial adoption. Companies also introduce refillable and reusable packaging systems to reduce waste across supply chains. Research and development, material transparency, and certifications remain key competitive factors. Additionally, mergers and acquisitions accelerate market expansion and product diversification. As sustainability commitments strengthen worldwide, competition remains centered on performance efficiency, low environmental impact, and cost-effective production of green packaging alternatives.
Shape Your Report to Specific Countries or Regions & Enjoy 30% Off!
Key Player Analysis
- Amcor
- Be Green Packaging
- DS Smith
- DuPont
- Evergreen Packaging
- Mondi
- Nampak
- Ball Corporation
- Sealed Air
- Tetra Laval
Recent Developments
- In January 2024, SEE introduced a compostable protein packaging tray at IPPE 2024, made from bio-based, food-contact grade resin. The tray is USDA-certified with 54% bio-based content derived from renewable wood cellulose, highlighting SEE’s focus on sustainable material innovation.
- In March 2023, Hinojosa Packaging Group unveiled its Foodservice line, a 100% recyclable range of primary packaging products. Designed for hot and cold beverages as well as 4th and 5th range prepared foods, the new line strengthens the company’s commitment to circular packaging solutions.
- In February 2023, Sealed Air completed the acquisition of Liquibox, a producer of sustainable liquid packaging solutions. This acquisition enhances Sealed Air’s food and beverage packaging portfolio, supporting the company’s goal to address rising consumer demand for eco-friendly packaging options.
Report Coverage
The research report offers an in-depth analysis based on Packaging Type, Application, Material and Geography. It details leading market players, providing an overview of their business, product offerings, investments, revenue streams, and key applications. Additionally, the report includes insights into the competitive environment, SWOT analysis, current market trends, as well as the primary drivers and constraints. Furthermore, it discusses various factors that have driven market expansion in recent years. The report also explores market dynamics, regulatory scenarios, and technological advancements that are shaping the industry. It assesses the impact of external factors and global economic changes on market growth. Lastly, it provides strategic recommendations for new entrants and established companies to navigate the complexities of the market.
Future Outlook
- Demand for recyclable and biodegradable packaging will continue rising due to strict sustainability rules.
- Companies will increase use of paper-based and molded fiber products in food and e-commerce.
- Bioplastics and compostable materials will gain wider commercial adoption.
- Packaging manufacturers will invest in lightweight designs to cut material usage and carbon emissions.
- Refillable and reusable packaging systems will expand across retail and personal care.
- Digital printing and smart labels will improve recyclability tracking and consumer guidance.
- Circular economy partnerships will strengthen recycling and material recovery networks.
- Emerging economies will adopt green packaging faster as regulations tighten.
- Brands will use sustainable packaging as a competitive differentiator in global markets.
- Investments in recycling and industrial composting infrastructure will support long-term market growth.



