
| REPORT ATTRIBUTE | DETAILS |
|---|---|
| Historical Period | 2020-2023 |
| Base Year | 2024 |
| Forecast Period | 2025-2032 |
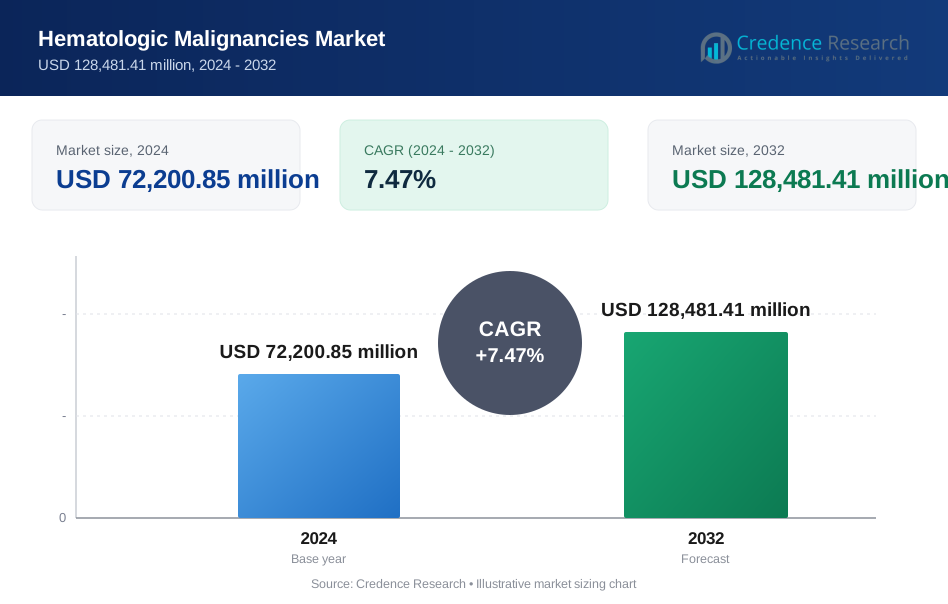
| Hematologic Malignancies Market Size 2024 | USD 72,200.85 million |
| Hematologic Malignancies Market, CAGR | 7.47% |
| Hematologic Malignancies Market Size 2032 | USD 128,481.41 million |
Market Overview:
The Hematologic Malignancies Market is projected to grow from USD 72,200.85 million in 2024 to USD 128,481.41 million by 2032, with a compound annual growth rate (CAGR) of 7.47%. Rising incidence of blood cancers—including leukemia, lymphoma and myeloma continues to drive demand for advanced diagnostics and targeted therapies. Greater awareness of early detection and progress in precision medicine have increased adoption of newer treatment options. An expanding geriatric population, which faces higher risk for these cancers, is also pushing demand. At the same time, developers are advancing immunotherapies, gene therapies and CAR-T cell therapies, improving outcomes and supporting revenue growth. Pharmaceutical companies, research institutions and health care providers are accelerating innovation through collaborations, while higher R&D spending and supportive regulatory approvals are expected to sustain momentum.
Regionally, North America holds the largest share, supported by advanced health care infrastructure and strong treatment demand. Europe follows, aided by established health systems and ongoing innovation in blood cancer therapies. Asia-Pacific is the fastest-growing region, driven by rising cancer incidence, improving access to care and increasing biotechnology investment, particularly in China and India. Latin America and the Middle East and Africa remain emerging markets as health care spending rises and demand grows for advanced treatments. Major companies including F. Hoffmann-La Roche Ltd., Pfizer Inc., Novartis AG, Sanofi and Merck & Co., Inc.—are expanding globally through partnerships, R&D investment and localized offerings.
Market Insights:
- The Hematologic Malignancies Market is projected to grow from USD 72,200.85 million in 2024 to USD 128,481.41 million by 2032, with a CAGR of 7.47%.
- Increasing prevalence of blood cancers such as leukemia, lymphoma, and myeloma is driving market growth.
- Advancements in targeted therapies, immunotherapies, and precision medicine are transforming treatment approaches for hematologic malignancies.
- Rising awareness of early cancer detection and demand for advanced diagnostic tools is boosting market expansion.
- The expanding geriatric population, which is more susceptible to hematologic malignancies, is increasing the demand for effective therapies.
- Growing investment in research and development, along with favorable regulatory approvals, is fueling innovation in the market.
- North America, Europe, and Asia-Pacific are the leading regions, with North America holding the largest market share (40% in 2024).
Market Drivers:
Rising prevalence of hematologic malignancies
The rising incidence of hematologic malignancies—including leukemia, lymphoma and multiple myeloma continues to drive market growth. As awareness increases, more patients undergo diagnostic testing, supporting earlier detection and treatment. Aging populations globally are expected to increase disease prevalence, boosting demand for advanced diagnostics and therapies. This demand is pushing drugmakers to invest in new approaches that aim to improve outcomes and survival.
Advancements in targeted therapies and precision medicine
Advances in targeted therapies, immunotherapies and precision medicine are reshaping treatment for hematologic malignancies. These approaches, including CAR-T cell therapy and gene therapies, can improve efficacy and reduce toxicity compared with conventional chemotherapy. Novartis’ Kymriah, for example, helped validate CAR-T as an option for select blood cancers and highlighted the commercial potential of personalized care. As clinicians match treatments to genetic and molecular profiles, pharmaceutical companies have more opportunities to develop differentiated therapies and expand market share.
Increased focus on early detection and diagnostics
Early detection remains a key factor in improving treatment success and survival. Demand continues to rise for advanced diagnostic tools such as next-generation sequencing (NGS), liquid biopsy and molecular diagnostics. These technologies can identify biomarkers earlier and help clinicians tailor treatment plans. As stakeholders place more emphasis on early diagnosis, adoption of these tools is expected to increase and support market growth.
Growing investment in research and development
Pharmaceutical companies and research institutions are increasing R&D investment to identify new targets and improve treatment protocols. Favorable regulatory pathways in several markets continue to support innovation and can shorten development timelines. The Advanced Research Projects Agency for Health (ARPA-H) has committed up to $ 46 million to SonALAsense to support development of minimally invasive or noninvasive ultrasound treatment designed to activate a compound that destroys cancer cells. Continued R&D and technology progress are expected to remain central to expansion in hematologic malignancies therapies and diagnostics.
Market Trends:
Shift toward immunotherapies and CAR-T cell treatments
Immunotherapies and CAR-T cell treatments are emerging as major trends in the hematologic malignancies market. These approaches use a patient’s immune system to target cancer cells and can offer more precise treatment than traditional options. CAR-T therapies, in particular, have shown strong efficacy in select leukemia and lymphoma indications. Novartis Pharmaceuticals, for example, is developing PHE885, a CAR-T therapy targeting BCMA for relapsed or refractory multiple myeloma. PHE885 uses the T-Charge platform to improve T-cell persistence and shorten manufacturing time, which could improve outcomes and operational feasibility.
Increasing use of biomarker-driven therapies
Biomarker-driven therapies are becoming more common as clinicians use genetic mutations and molecular markers to match patients to specific treatments. This approach can improve efficacy and reduce avoidable toxicity. Wider use of biomarker testing and improved molecular diagnostics are enabling more precise treatment strategies and are expected to influence care pathways over the next several years.
Expansion of next-generation sequencing technologies
Next-generation sequencing (NGS) is playing a larger role in diagnosis and treatment selection for hematologic malignancies. NGS supports broad mutation profiling that can aid earlier detection and guide use of targeted therapies. Cancer Genetics Inc., for example, uses NGS and related genomic methods to identify alterations in blood cancers in collaboration with drugmakers, clinicians and research laboratories. As NGS becomes more accessible and cost-effective, adoption in clinical settings is expected to increase, supporting more personalized treatment planning and monitoring.
Collaborations and partnerships driving innovation
Strategic collaborations among pharmaceutical companies, academic institutions and health care providers remain a prominent trend. These partnerships can accelerate R&D, expand access to specialized capabilities and support evidence generation needed for approvals and adoption. As demand increases for more effective and less invasive options, partnerships are expected to remain a key mechanism for advancing new therapies and diagnostics.
Market Challenges Analysis:
High treatment costs and access constraints
High prices for advanced therapies, including CAR-T and targeted immunotherapies, remain a central barrier to adoption. Total cost extends beyond the therapy itself and can include hospitalization, specialized facilities and intensive monitoring. These requirements limit access, particularly in low- and middle-income countries and in health systems with constrained capacity. Gilead Sciences’ Yescarta, for example, has a list price of $373,000 per patient. Limited reimbursement in some markets can further increase financial pressure on patients and providers, slowing uptake.
Complex regulatory pathways and approval delays
Developers face lengthy clinical and regulatory processes because hematologic malignancies often require extensive safety and efficacy evaluation and long-term follow-up. Differences in regulatory requirements across regions add complexity for global commercialization and can increase timelines and costs. Smaller biotech companies can face added strain because compliance and postapproval commitments require substantial resources. These factors can delay patient access, raise development risk and slow innovation.
Market Opportunities:
The market continues to offer growth opportunities as precision medicine expands and stakeholders deepen understanding of the molecular drivers of blood cancers. This shift supports demand for targeted therapies and personalized regimens, including CAR-T and immunotherapies, with potential to broaden into additional hematologic indications as clinical evidence matures and manufacturing scales.
Opportunities are also increasing in diagnostics as health systems prioritize earlier detection and treatment selection. Adoption of liquid biopsy and NGS is rising as performance improves and costs decline, supporting broader testing and more tailored care. Companies can capture value through partnerships with health systems and academic centers to improve affordability, expand access and strengthen real-world evidence. Emerging markets, supported by improving infrastructure and higher health care spending, also represent meaningful upside for both therapies and advanced diagnostics.
Market Segmentation Analysis:
By Type
The hematologic malignancies market is segmented by cancer types, including leukemia, lymphoma, and multiple myeloma. Leukemia holds a significant share due to its high prevalence, but lymphoma is also witnessing robust growth owing to advancements in treatment options. The growing awareness and diagnosis of these conditions further drive the segment's expansion.
By Therapy Type
Therapy types in the hematologic malignancies market include chemotherapy, immunotherapy, and targeted therapy. Immunotherapy and targeted therapies are experiencing rapid adoption due to their ability to provide more personalized, effective treatment with fewer side effects. These therapies are gaining traction, especially with advancements in CAR-T cell and monoclonal antibody treatments.
By Dosage Form
The market is also segmented by dosage forms, including oral, injectable, and intravenous formulations. Injectable and intravenous forms dominate the segment due to the nature of most therapies for hematologic malignancies, which require precise delivery methods. However, oral formulations are increasingly being developed, offering more convenience and flexibility for patients.
Segments:
Based on Type:
- Leukaemia
- Lymphoma
- Myeloma
Based on Therapy Type
- Chemotherapy
- Immunotherapy
- Targeted Therapy
-
- Tyrosine kinase inhibitors
- Proteasome inhibitor
- B-cell lymphoma-2 protein inhibitor
- Isocitrate dehydrogenase-1 inhibitor
- Hedgehog pathway inhibitor
- Others
Based on Diagnosis
- Blood Tests
- Biopsy
- Imaging Tests
-
- X-ray
- Magnetic resonance imaging (MRI)
- Positron Emission Tomography (PET)
- Others
Based on Dosage form
- Tablets
- Capsules
- Injections
- Others
Based on Route of Administration
- Oral
- Parenteral
- Others
Based on End-Users
- Hospitals
- Specialty Clinics
- Homecare
- Others
Based on Distribution Channel
- Hospital Pharmacy
- Retail Pharmacy
- Online Pharmacy
- Others
Based on the Geography:
- North America
- U.S.
- Canada
- Mexico
- Europe
- Germany
- France
- U.K.
- Italy
- Spain
- Rest of Europe
- Asia Pacific
- China
- Japan
- India
- South Korea
- South-east Asia
- Rest of Asia Pacific
- Latin America
- Brazil
- Argentina
- Rest of Latin America
- Middle East & Africa
- GCC Countries
- South Africa
- Rest of the Middle East and Africa
Regional Analysis:
North America
North America holds the largest market share in the hematologic malignancies market, accounting for 40% of the total market in 2024. The dominance of this region is primarily attributed to the high prevalence of hematologic cancers, advanced healthcare infrastructure, and the presence of key pharmaceutical companies. The U.S. has been a leader in innovation, with significant investment in research and development, particularly in advanced therapies such as CAR-T cell treatments and immunotherapies. Additionally, the availability of advanced diagnostic tools, such as next-generation sequencing (NGS) and liquid biopsy, further strengthens North America’s position in the global market. Strong government support, favorable reimbursement policies, and access to cutting-edge clinical trials also contribute to the region's market leadership.
Europe
Europe holds the second-largest share of the hematologic malignancies market, capturing 30% of the global market in 2024. The region benefits from a growing awareness of hematologic cancers, a strong healthcare system, and rising investment in biotechnology and pharmaceutical research. Countries like Germany, France, and the U.K. are at the forefront of cancer research and innovation, with a significant number of ongoing clinical trials focused on developing new therapies for blood cancers. The European market is further supported by favorable government initiatives, improving access to advanced treatments, and a strong emphasis on early diagnosis. The demand for personalized therapies is increasing, particularly in Western Europe, where healthcare systems are highly developed, and patients have access to the latest treatment options.
Asia-Pacific
The Asia-Pacific region is expected to witness the fastest growth in the hematologic malignancies market, holding 20% of the market share in 2024. This growth is driven by the increasing incidence of blood cancers, improving healthcare infrastructure, and growing awareness of early cancer detection. Countries such as China, Japan, and India are seeing a rise in healthcare spending, which is boosting the adoption of advanced therapies and diagnostic technologies. In particular, China is becoming a key market player, with significant investment in the biotechnology sector and the development of innovative therapies. Additionally, the increasing focus on clinical research and the rising demand for affordable, effective treatments are driving market expansion in this region.
Latin America
Latin America holds 5% of the global hematologic malignancies market in 2024. While the region is still developing its healthcare infrastructure, there is a growing focus on improving cancer care and access to advanced therapies. Brazil and Mexico are the largest contributors to the market in this region, driven by an increasing number of diagnosed cases and growing investments in healthcare. However, the lack of widespread access to advanced treatments and diagnostic tools remains a challenge for the region’s growth.
Middle East and Africa
The Middle East and Africa (MEA) region accounts for 5% of the market share in 2024, with countries like Saudi Arabia, the UAE, and South Africa leading the growth. Although the market is still developing, there is growing investment in healthcare infrastructure and a rising demand for advanced cancer treatments. The lack of accessibility to cutting-edge therapies, however, poses a challenge, particularly in less developed countries within the region. Despite these obstacles, government initiatives to improve cancer care and early detection efforts are expected to drive future growth in the MEA market.
Key Player Analysis:
- Hoffmann-La Roche Ltd. (Switzerland)
- Allergan (Ireland)
- Pfizer Inc. (US)
- AstraZeneca (UK)
- Merck & Co., Inc. (US)
- Teva Pharmaceutical Industries Ltd. (Ireland)
- GlaxoSmithKline plc (UK)
- Sanofi (France)
- Novartis AG (Switzerland)
- Bayer AG (Germany)
- Mylan N.V. (US)
- Eli Lilly and Company (US)
Competitive Analysis:
The hematologic malignancies market is highly competitive, with several prominent players striving to expand their market presence through innovative therapies and strategic collaborations. F. Hoffmann-La Roche Ltd., Mylan N.V., Teva Pharmaceutical Industries Ltd., Sanofi, Pfizer Inc., GlaxoSmithKline plc, Novartis AG, Bayer AG, Eli Lilly and Company, Merck & Co., Inc., Allergan, and AstraZeneca are key participants actively developing advanced treatments for blood cancers such as leukemia, lymphoma, and myeloma. These companies are focusing on the development of targeted therapies, immunotherapies, and CAR-T cell treatments, driving growth in the market. The leading players are also investing in research and development to enhance their product portfolios and gain regulatory approvals for novel treatments. Strategic partnerships, acquisitions, and expanding clinical trial activities are common tactics used to strengthen their market positions. Moreover, these players are continuously working on improving patient outcomes by making treatments more personalized and accessible, responding to the increasing demand for more effective and less toxic therapies.
Recent Developments:
- In January 2026, Amgen announced it would acquire Dark Blue Therapeutics in a deal worth up to $840 million to add a preclinical blood-cancer (AML) program involving a small-molecule degrader targeting MLLT1/3.
- In November 2025, Dealforma highlighted an AbbVie–IGI partnership featuring a trispecific antibody program in relapsed/refractory multiple myeloma as part of recent oncology R&D deal activity.
- In June 2024, Roche introduced a highly sensitive SITU hybridization test designed to assist pathologists in distinguishing between normal cells and B-cell malignancies. This launch aims to improve the testing of patients potentially diagnosed with B-cell lymphoma.
- In May 2024, Bruker Corporation completed its acquisition of ELITech Group, which is expected to generate $100 million in revenue for the remainder of the year.
- In April 2024, QIAGEN N.V. launched the QIAseq Targeted RNA-seq Panel for T-cell receptors, highlighting their importance in the adaptive immune system's role of identifying and eliminating abnormal cells, including cancerous ones.
- Earlier, in February 2024, AbbVie Inc. acquired ImmunoGen Inc., along with its leading cancer therapy, ELAHERE. This acquisition is set to bolster AbbVie’s commercial and clinical presence in the solid tumor space. That same month, Precipio, Inc. signed a distribution agreement with Cardinal Health to market and distribute its HemeScreen molecular assay products, targeting acute healthcare systems, reference labs, and physician-owned laboratories.
- In January 2024, Illumina, Inc. entered into a partnership with Janssen Research & Development, LLC to develop its novel molecular residual disease (MRD) assay. This whole-genome sequencing (WGS) solution focuses on detecting circulating tumor DNA (ctDNA) to enhance the understanding of disease persistence or recurrence post-clinical intervention.
Market Concentration & Characteristics:
The hematologic malignancies market is characterized by moderate to high concentration, with a few dominant players holding substantial market shares. Leading pharmaceutical companies, such as F. Hoffmann-La Roche Ltd., Pfizer Inc., Novartis AG, and Merck & Co., Inc., are at the forefront of innovation, particularly in the development of targeted therapies, immunotherapies, and CAR-T cell treatments. These companies focus on extensive research and development to introduce novel therapies that offer personalized treatment options for blood cancers. The market is also marked by strong partnerships and collaborations between pharmaceutical companies, biotech firms, and research institutions, which are crucial for accelerating the discovery and commercialization of new therapies. Additionally, regulatory agencies play a significant role in shaping market dynamics, ensuring that only safe and effective treatments are introduced. As a result, the market exhibits a competitive yet collaborative environment driven by innovation and strategic alliances.
Report Coverage:
The research report offers an in-depth analysis based on Type, Therapy Type, Diagnosis, Dosage Form, Route of Administration, End-User, Distribution Channel and Geography. It details leading market players, providing an overview of their business, product offerings, investments, revenue streams, and key applications. Additionally, the report includes insights into the competitive environment, SWOT analysis, current market trends, as well as the primary drivers and constraints. Furthermore, it discusses various factors that have driven market expansion in recent years. The report also explores market dynamics, regulatory scenarios, and technological advancements that are shaping the industry. It assesses the impact of external factors and global economic changes on market growth. Lastly, it provides strategic recommendations for new entrants and established companies to navigate the complexities of the market.
Future Outlook:
- The development of personalized therapies will continue to shape treatment approaches for hematologic malignancies.
- Immunotherapies and CAR-T cell treatments will gain further traction as more effective alternatives to conventional therapies.
- Early detection technologies, such as liquid biopsy and next-generation sequencing, will become more widely adopted.
- The rising geriatric population will increase the demand for hematologic malignancy treatments.
- Governments and healthcare providers will continue to invest in improving cancer care infrastructure, especially in emerging markets.
- Advances in precision medicine will enable more targeted and less toxic treatment options.
- The market will see more collaborations between pharmaceutical companies and research institutions to foster innovation.
- Increasing awareness of blood cancers will result in higher rates of early diagnosis and treatment.
- The focus on gene therapies and gene editing techniques will expand treatment options for patients.
- New regulatory frameworks and approvals will accelerate the introduction of novel therapies to the market.
Request a Free Sample
Fill in your details and we'll send you a free sample report.
- Sample data tables & charts
- Research methodology
Need a Custom Version of This Report?
Tailor the scope, geography, or segments to your exact requirements.
- Custom geography or segment scope
- Direct access to our analyst team
Frequently Asked Questions
What is the current size of the Hematologic Malignancies Market?
What factors are driving the growth of the Hematologic Malignancies Market?
What are some challenges faced by the Hematologic Malignancies Market?
Who are the major players in the Hematologic Malignancies Market
Table of Content
Chapter 1. Report Introduction
- 1.1 Report Description & Purpose
- 1.1.1 Report Title & Market Definition
- 1.1.2 Unique Selling Propositions (USP) & Key Differentiators
- 1.1.3 Value Proposition for Stakeholders
- 1.2 Research Objectives
- 1.2.1 Market Sizing Objectives (Volume & Revenue)
- 1.2.2 Segmentation Objectives
- 1.2.3 Competitive Intelligence Objectives
- 1.2.4 Forecast & Scenario Objectives
- 1.3 Report Scope
- 1.3.1 Hematologic Malignancies Scope – Types & Subtypes Covered
- 1.3.2 Geographic Scope – Regions & Countries Covered
- 1.3.3 Historical Period, Base Year & Forecast Period (2024; forecast to 2032)
- 1.3.4 Inclusions & Exclusions
- 1.4 HS Code & Classification Framework
- 1.5 Currency, Units & Pricing Basis
- 1.6 Target Stakeholders
- 1.7 Limitations & Assumptions
Chapter 2. Executive Summary
- 2.1 Global Hematologic Malignancies Market Snapshot
- 2.1.1 Market Size – Historical (2024) & Forecast (2024-2032) (2024: USD 72,200.85 million → 2032: USD 128,481.41 million)
- 2.1.2 Volume & Revenue – Global Totals
- 2.1.3 Key Market Highlights – Top Five Facts
- 2.2 Hematologic Malignancies Market Segmentation Snapshot
- 2.2.1 Market Split by Region – 2024 vs. 2032
- 2.3 Competitive Snapshot
- 2.3.1 Top 10 Players by Revenue Share – 2024
- 2.3.2 Top 10 Players by Volume Share – 2024
- 2.3.3 Recent Strategic Developments (18-Month Summary)
- 2.4 Key Investment Highlights & Strategic Conclusions
Chapter 3. Hematologic Malignancies Market Dynamics & Industry Analysis
- 3.1 Market Overview & Context
- 3.1.1 Hematologic Malignancies Market Position in the Broader Automotive Value Chain
- 3.1.2 OEM vs. Replacement Market Dynamics
- 3.1.3 Market Maturity & Development Stage by Region
- 3.2 Hematologic Malignancies Market Drivers
- 3.3 Hematologic Malignancies Market Restraints & Challenges
- 3.4 Hematologic Malignancies Market Opportunities
- 3.5 Porter's Five Forces Analysis
- 3.5.1 Threat of New Entrants
- 3.5.2 Bargaining Power of Suppliers
- 3.5.3 Bargaining Power of Buyers
- 3.5.4 Threat of Substitutes
- 3.5.5 Competitive Rivalry – Intensity Assessment
- 3.6 Hematologic Malignancies Value Chain Analysis
- 3.6.1 Upstream – Raw Material/Input Suppliers
- 3.6.1.1 Raw Material/Input 1
- 3.6.1.2 Raw Material/Input 2
- 3.6.1.3 Raw Material/Input 3
- 3.6.2 Midstream – Production/Manufacturing/Service Delivery
- 3.6.2.1 Production/Process Overview
- 3.6.2.2 Key Facility Locations & Capacity by Manufacturer
- 3.6.3 Downstream – Distribution & End Consumer
- 3.6.3.1 Primary Channel – B2B/OEM
- 3.6.3.2 Secondary Channels – Dealer, Retail, Online, Direct
- 3.6.4 Value Chain Profitability Analysis
- 3.6.1 Upstream – Raw Material/Input Suppliers
- 3.7 PESTEL Analysis
- 3.7.1 Political Factors
- 3.7.2 Economic Factors
- 3.7.3 Social Factors
- 3.7.4 Technological Factors
- 3.7.5 Environmental Factors
- 3.7.6 Legal Factors
- 3.8 Hematologic Malignancies Supply Chain Analysis
- 3.8.1 Raw Material/Input Supply Risk Assessment
- 3.8.2 Manufacturing Concentration Risk (Geographic Exposure)
- 3.8.3 Trade Disruption Impact Analysis
- 3.9 Regulatory & Policy Landscape
Note: The regulatory and policy landscape section covers regulations based on their applicability to the market, Hematologic Malignancies category, geography, and scope of the study. Only regulatory frameworks with a material impact on operations, compliance, trade, sustainability, or market access are analyzed in detail.
Chapter 4. Key Investment Pockets & Opportunity Analysis
- 4.1 Hematologic Malignancies Market Attractiveness Analysis
- 4.1.1 By Region – Investment Attractiveness Matrix (Volume × CAGR)
- 4.2 Absolute Revenue Growth Opportunity
- 4.2.1 By Region – Absolute USD Growth Through 2032
- 4.3 Incremental Volume Opportunity
- 4.3.1 By Region – Incremental Volume Through 2032
- 4.3.2 Segment – Incremental Volume
- 4.4 Emerging Submarket Opportunity Deep Dive (Subject to Applicability)
- 4.5 Emerging Market Opportunity Scorecards
- 4.5.1 United States
- 4.5.2 Europe
- 4.5.3 Asia
- 4.5.4 Middle East & Africa
Note: Emerging Market Opportunity Scorecards will be included based on relevance and strategic importance. Regions listed are indicative and may vary depending on data availability and market dynamics.
Chapter 5. Hematologic Malignancies Import-Export Analysis & Trade Flows
- 5.1 Global Trade Overview
- 5.1.1 Global Export Value by Country (2024)
- 5.1.2 Global Export Volume by Country (2024)
- 5.1.3 Global Import Value by Country (2024)
- 5.1.4 Global Import Volume by Country (2024)
- 5.1.5 Net Trade Balance by Country (2024)
- 5.2 Export Analysis – Segment
- 5.2.1 Type 1 (HS Code)
- 5.2.2 Type 2 (HS Code)
- 5.2.3 Type 3 (HS Code)
- 5.2.4 Type 4 (HS Code)
- 5.2.5 Type 5 (HS Code)
- 5.3 Import Analysis – Segment
- 5.3.1 Type 1 (HS Code)
- 5.3.2 Type 2 (HS Code)
- 5.3.3 Type 3 (HS Code)
- 5.3.4 Type 4 (HS Code)
- 5.3.5 Type 5 (HS Code)
- 5.4 Average Unit Trade Prices
- 5.4.1 Average Export Price – Segment & Country
- 5.4.2 Average Import Price – Segment & Source Country
- 5.4.3 Price Trends (2024)
- 5.5 Key Trade Route Analysis
- 5.5.1 Trade Route 1
- 5.5.2 Trade Route 2
- 5.5.3 Trade Route 3
- 5.5.4 Trade Route 4
- 5.5.5 Trade Route 5
- 5.6 Trade Policy Impact Assessment
- 5.6.1 US Anti-Dumping & Section 301 Tariffs
- 5.6.2 EU Customs Union Impact
- 5.6.3 Major Free Trade Agreements
- 5.6.4 USMCA Rules of Origin
Note: Trade policy analysis will be included only where relevant to the Hematologic Malignancies market.
Chapter 6. Competitive Landscape & Company Benchmarking
- 6.1 Hematologic Malignancies Market Concentration & Structure
- 6.1.1 Herfindahl-Hirschman Index (HHI) – vs. 2024
- 6.1.2 Tier 1, Tier 2 & Tier 3 Market Structure
- 6.1.3 Global, Regional & Local Player Dynamics
- 6.2 Hematologic Malignancies Market Share Analysis – 2024
- 6.2.1 Global Revenue Share by Company
- 6.2.2 Global Volume Share by Company
- 6.2.3 Regional Revenue Share
- 6.2.4 Market Share Evolution ( vs. 2024)
- 6.2.5 OEM Segment Share by Company
- 6.2.6 Replacement Segment Share by Company
- 6.3 Production/Delivery Capacity & Facility Analysis
- 6.3.1 Global Installed Capacity
- 6.3.2 Capacity Utilization Rates
- 6.3.3 Production/Output Volume
- 6.3.4 Facility Locations & Capacity Map
- 6.3.5 Planned Capacity Additions
- 6.4 Hematologic Malignancies Competitive Benchmarking Matrix
- 6.4.1 Revenue, Volume, CAGR & Profitability Comparison
- 6.4.2 Channel Revenue Mix
- 6.4.3 Geographic Revenue Exposure
- 6.4.4 R&D Intensity
- 6.4.5 Sustainability Maturity
- 6.5 Strategic Developments in Hematologic Malignancies (Last 24 Months)
- 6.5.1 Mergers, Acquisitions & Divestments
- 6.5.2 New Hematologic Malignancies Launches
- 6.5.3 Facility Expansions
- 6.5.4 Strategic Alliances, Joint Ventures & Partnerships
- 6.5.5 Distribution Expansion & Market Entry
- 6.5.6 Sustainability & ESG Initiatives
- 6.6 Competitive Strategy Mapping
- 6.6.1 Leader, Challenger, Follower & Niche Classification
- 6.6.2 Pricing Strategy Comparison
- 6.6.3 Channel Strategy Matrix
Note: Strategic developments are included based on their materiality and the availability of reliable information.
Chapter 7. Global Hematologic Malignancies Market – By Distribution Channel
- 7.1 Segment Overview
- 7.1.1 Volume & Revenue Split by Channel (2024 & 2032)
- 7.1.2 Channel Mix Evolution (2024-2032)
Chapter 8. Regional Market Analysis – Global Overview
- 8.1 Global Regional Overview
- 8.1.1 Regional Volume Share
- 8.1.2 Regional Revenue Share
- 8.1.3 Regional Volume by Region
- 8.1.4 Regional Revenue by Region
- 8.1.5 Regional Forecast Through 2032
- 8.2 Cross-Regional Segment Analysis
- 8.2.1 By Distribution Channel
- 8.2.2 By Brand/Price Tier
Chapter 9. North America Hematologic Malignancies Market
- 9.1 United States
- 9.2 Canada
- 9.3 Mexico
Chapter 10. Europe Hematologic Malignancies Market
- 10.1 Germany
- 10.2 France
- 10.3 Italy
- 10.4 United Kingdom
- 10.5 Spain
- 10.6 Poland
- 10.7 Russia
- 10.8 Netherlands
- 10.9 Belgium
- 10.10 Sweden
- 10.11 Denmark
- 10.12 Norway
- 10.13 Rest of Europe
Chapter 11. Asia Pacific Hematologic Malignancies Market
- 11.1 China
- 11.2 India
- 11.3 Japan
- 11.4 South Korea
- 11.5 Thailand
- 11.6 Indonesia
- 11.7 Vietnam
- 11.8 Malaysia
- 11.9 Australia
- 11.10 Rest of Asia Pacific
Chapter 12. Latin America Hematologic Malignancies Market
- 12.1 Brazil
- 12.2 Argentina
- 12.3 Colombia
- 12.4 Chile
- 12.5 Rest of Latin America
Chapter 13. Middle East Hematologic Malignancies Market
- 13.1 Saudi Arabia
- 13.2 United Arab Emirates
- 13.3 Turkey
- 13.4 Israel
- 13.5 Iran
- 13.6 Rest of the Middle East
Chapter 14. Africa Hematologic Malignancies Market
- 14.1 South Africa
- 14.2 Egypt
- 14.3 Nigeria
- 14.4 Morocco
- 14.5 Rest of Africa
Chapter 15. Hematologic Malignancies Company Profiles
- 15.1 [Company 01]
- 15.1.1 Company Overview
- 15.1.2 Key Management Personnel
- 15.1.3 Products & Services Portfolio
- 15.1.4 Financial Performance
- 15.1.5 Key Market Focus & Geographic Presence
- 15.1.6 Recent Developments & Strategic Initiatives
Note: The company profile list is preliminary and may change based on research findings, market developments, data availability, and client requirements.
Chapter 16. Appendices
- Appendix A – List of Abbreviations & Acronyms
- Appendix B – Industry Classification Code Reference – Full Series
- Appendix C – Production & Capacity Data Tables
- Appendix D – End-Use & Demand Base Tables
- Appendix E – Consumption & Replacement Rate Assumptions
- Appendix F – ASP Reference Tables
- Appendix G – Manufacturing & Facility Database
- Appendix H – Import-Export Data Tables
- Appendix I – Regulatory Summary Tables
- Appendix J – Primary Research Participant List (Anonymized)
- Appendix K – Primary Research Questionnaire Framework
- Appendix L – Data Sources & Bibliography
- Appendix M – Market Size Divergence & Source Comparison
Chapter 17. Research Methodology
- 17.1 Research Framework & Philosophy
- 17.2 Secondary Research – Sources, Hierarchy & Data Extraction
- 17.3 Data Modeling – Bottom-Up & Top-Down Market Sizing
- 17.4 Primary Research – Stakeholder Framework, LOI & Sample Sizes
- 17.5 Forecast Methodology – Regression, Scenario & Sensitivity Analysis
- 17.6 Quality Control – Four-Layer Validation Framework
- 17.7 Limitations & Standard Assumptions
- 17.8 Disclaimer
