
Market Overview:
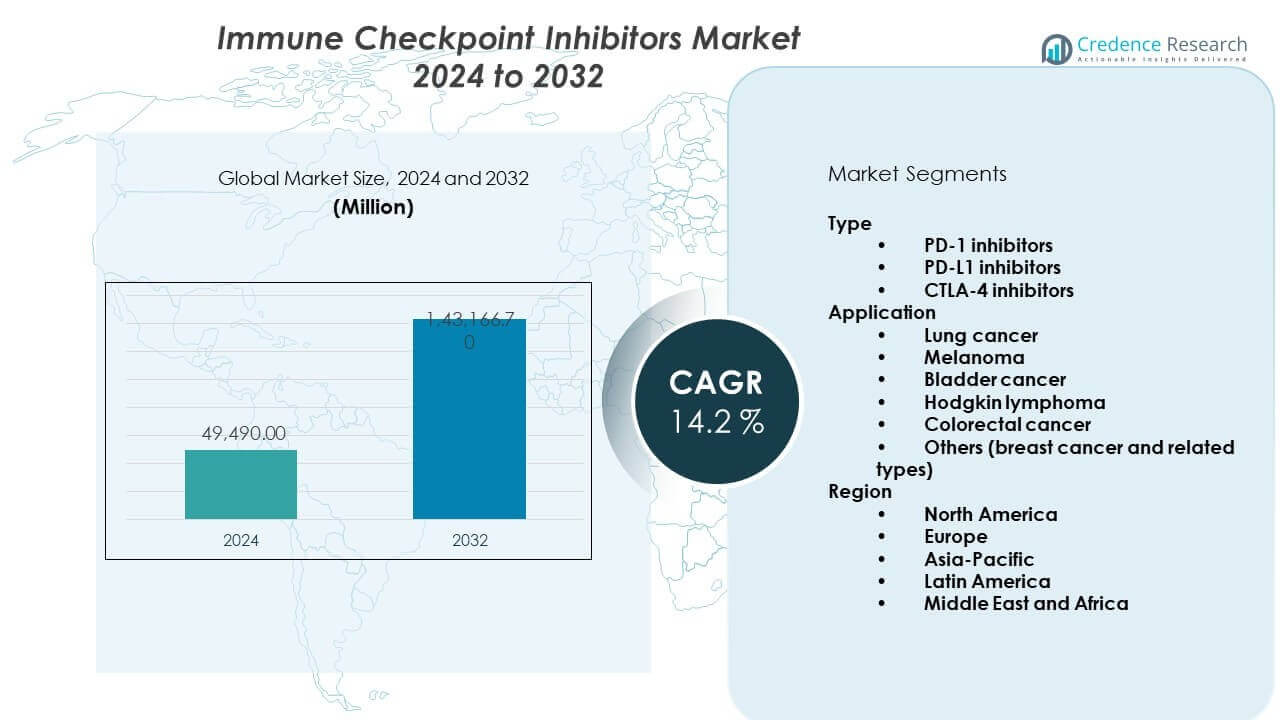
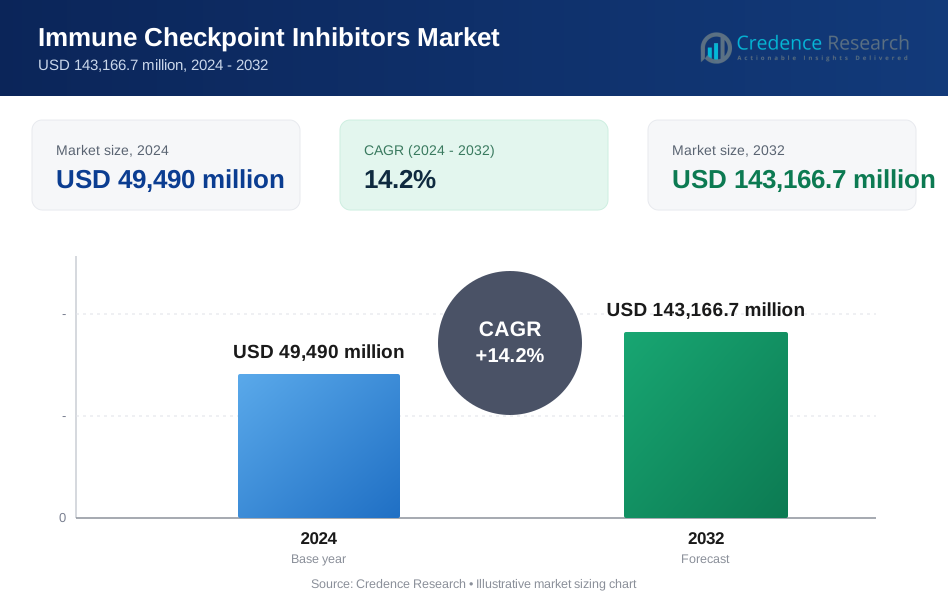
The Immune Checkpoint Inhibitors Market is projected to grow from USD 49,490 million in 2024 to USD 143,166.7 million by 2032. The market will expand at a CAGR of 14.2% from 2024 to 2032.
| REPORT ATTRIBUTE | DETAILS |
|---|---|
| Historical Period | 2020-2023 |
| Base Year | 2024 |
| Forecast Period | 2025-2032 |
| Immune Checkpoint Inhibitors Market Size 2024 | USD 49,490 million |
| Immune Checkpoint Inhibitors Market, CAGR | 14.2% |
| Immune Checkpoint Inhibitors Market Size 2032 | USD 143,166.7 million |
Cancer prevalence continues to rise across aging populations worldwide. Physicians favor immune checkpoint inhibitors due to durable response rates. Expanded indications increase use beyond melanoma and lung cancer. Combination therapies improve outcomes across complex tumor types. Faster regulatory approvals support quicker market entry. Growing biomarker testing enables better patient selection. Hospital oncology centers invest in immunotherapy infrastructure. Reimbursement support improves treatment access in developed healthcare systems. Continuous clinical trials sustain long-term confidence among oncologists.
North America leads due to advanced oncology care and strong drug approvals. The United States drives adoption through high clinical trial activity. Europe follows with steady uptake across Germany, France, and the UK. Asia Pacific emerges rapidly due to rising cancer burden. China and Japan expand immunotherapy access through local approvals. South Korea supports innovation with strong research funding. Latin America shows gradual growth with improving oncology infrastructure. Middle East regions invest in specialty cancer centers.
Market Insights:
- The market reached USD 49,490 million in 2024 and is projected to hit USD 143,166.7 million by 2032, expanding at a CAGR of 14.2%, driven by strong oncology adoption and pipeline depth.
- North America leads with about 45% share due to advanced cancer care and reimbursement, Europe follows with nearly 30% from strong public healthcare systems, and Asia-Pacific holds around 18% due to rising cancer burden.
- Asia-Pacific is the fastest-growing region with an 18% share, supported by expanding hospital networks, local drug approvals, and rising oncology investment in China and Japan.
- By type, PD-1 inhibitors account for roughly 65% share due to broad approvals, while PD-L1 and CTLA-4 inhibitors together hold about 35% driven by combination use.
- By application, lung cancer contributes nearly 40% share, melanoma holds around 20%, and remaining cancers together represent about 40% with gradual clinical integration.
Market Drivers:
Rising Global Cancer Burden And Expanding Oncology Treatment Demand
The Immune Checkpoint Inhibitors Market gains momentum from rising cancer incidence worldwide. Oncology centers report higher patient inflow across solid tumors. Lung cancer, melanoma, and renal cancers drive therapy demand. Physicians prioritize immunotherapy for durable clinical response. Treatment guidelines increasingly favor checkpoint inhibitors. The market benefits from long treatment cycles. It supports steady revenue flow for manufacturers. Cancer screening programs also increase early diagnosis rates.
- For instance, Merck’s KEYNOTE-189 trial showed a 52% reduction in mortality risk in metastatic non-small cell lung cancer patients receiving pembrolizumab with chemotherapy compared to chemotherapy alone.
Strong Clinical Efficacy And Improved Patient Survival Outcomes
The Immune Checkpoint Inhibitors Market benefits from proven survival benefits. Clinical trials confirm long-term remission in selected patients. Physicians value improved quality of life outcomes. Reduced relapse rates strengthen clinical confidence. Combination regimens enhance response durability. It supports wider adoption across oncology specialties. Hospitals expand immunotherapy units. Clinical success sustains physician trust and prescribing growth.
- For instance, Bristol-Myers Squibb reported a 5-year overall survival rate of 52% for advanced melanoma patients treated with nivolumab plus ipilimumab in the CheckMate-067 study.
Expanding Regulatory Approvals Across Multiple Cancer Indications
The Immune Checkpoint Inhibitors Market advances through broader regulatory approvals. Authorities approve therapies for earlier treatment lines. New indications expand patient eligibility pools. Accelerated approval pathways reduce launch timelines. It supports faster market penetration. Regulatory clarity improves investment confidence. Pharma companies scale global commercialization. Approval momentum sustains long-term market growth.
Rising Healthcare Spending And Improved Access To Advanced Therapies
The Immune Checkpoint Inhibitors Market benefits from higher oncology spending. Public health systems allocate larger cancer budgets. Private insurers expand reimbursement coverage. It improves patient affordability. Specialty hospitals invest in advanced infusion facilities. Oncology workforce training supports safe administration. Healthcare reforms strengthen access in urban centers. Spending growth sustains treatment adoption levels.
Market Trends:
Rapid Growth Of Combination Immunotherapy Treatment Protocols
The Immune Checkpoint Inhibitors Market shows strong movement toward combination therapy use. Oncologists combine checkpoint inhibitors with chemotherapy. Targeted therapy combinations gain clinical acceptance. Dual immunotherapy regimens improve response depth. It supports treatment personalization strategies. Clinical trial pipelines focus on combination efficacy. Pharma partnerships accelerate co-development programs. Combination use reshapes treatment algorithms globally.
- For instance, Roche’s IMpower150 trial demonstrated a median overall survival improvement of 4.5 months when atezolizumab was combined with bevacizumab and chemotherapy in metastatic lung cancer.
Rising Focus On Biomarker-Based Patient Selection Strategies
The Immune Checkpoint Inhibitors Market aligns with precision oncology trends. Biomarker testing guides treatment decisions. PD-L1 expression testing sees wider adoption. Genomic profiling supports patient stratification. It improves treatment success rates. Diagnostic firms expand companion testing solutions. Precision tools reduce trial-and-error therapy use. Biomarker focus strengthens clinical efficiency.
Expansion Of Indications Into Earlier Disease Stages
The Immune Checkpoint Inhibitors Market shifts toward early-stage cancer use. Adjuvant and neoadjuvant settings gain approval. Physicians adopt immunotherapy before surgery. Early intervention improves recurrence prevention. It extends treatment duration per patient. Clinical trials validate early-stage benefits. Oncology guidelines adapt to expanded use. Early-stage focus reshapes market demand patterns.
Growing Investment In Next-Generation Immunotherapy Platforms
The Immune Checkpoint Inhibitors Market reflects rising R&D investment intensity. Companies develop novel checkpoint targets. Bispecific antibodies gain research attention. It supports innovation beyond PD-1 pathways. Research centers expand immuno-oncology programs. Venture funding accelerates pipeline diversity. Innovation focus ensures long-term market sustainability. Advanced platforms enhance competitive differentiation.
Market Challenges Analysis:
High Treatment Costs And Budget Pressure On Healthcare Systems
The Immune Checkpoint Inhibitors Market faces cost-related barriers. Treatment courses remain expensive for many patients. Public payers face reimbursement strain. Private insurers enforce strict coverage criteria. It limits patient access in cost-sensitive regions. Budget pressure slows adoption in developing markets. Price negotiations delay therapy rollout. Cost control remains a major restraint.
Clinical Complexity And Risk Of Immune-Related Adverse Events
The Immune Checkpoint Inhibitors Market faces safety management challenges. Immune-related side effects require specialized monitoring. Physicians need advanced training for toxicity control. It increases hospital resource use. Adverse events raise treatment discontinuation risks. Patient selection remains critical for safety. Clinical uncertainty limits use in frail populations. Risk management affects physician confidence.
Market Opportunities:
Expanding Penetration Across Emerging Oncology Markets
The Immune Checkpoint Inhibitors Market holds strong potential in emerging regions. Cancer incidence rises in Asia and Latin America. Governments invest in oncology infrastructure. It supports gradual immunotherapy adoption. Local manufacturing reduces cost barriers. Regulatory pathways mature across developing markets. Medical tourism supports therapy uptake. Emerging regions offer long-term growth prospects.
Development Of Novel Checkpoint Targets And Personalized Therapies
The Immune Checkpoint Inhibitors Market offers opportunity through innovation. New immune targets expand therapeutic scope. Personalized regimens improve response consistency. It supports precision-driven treatment models. Pharma firms invest in differentiated pipelines. Academic collaborations accelerate discovery programs. Advanced diagnostics enable tailored therapy use. Innovation creates future revenue pathways.
Market Segmentation Analysis:
Type
The Immune Checkpoint Inhibitors Market shows clear differentiation by therapy type. PD-1 inhibitors lead due to broad approvals and strong physician preference. These therapies support durable response across multiple tumors. PD-L1 inhibitors follow with steady uptake in lung and bladder cancers. Hospitals favor these agents for combination protocols. CTLA-4 inhibitors hold a smaller share due to safety concerns. It supports use mainly in advanced melanoma. Combination use with PD-1 agents sustains relevance.
- For instance, nivolumab achieved objective response rates above 40% in metastatic melanoma, while ipilimumab monotherapy reported rates near 19% in late-stage studies.
Application
Lung cancer represents the largest application segment. High disease prevalence supports sustained therapy demand. Immunotherapy improves survival across metastatic and early-stage cases. Melanoma remains a core segment due to early clinical success. It shows high response durability in advanced disease. Bladder cancer adoption rises with expanding approvals. Hodgkin lymphoma shows strong outcomes in relapsed patients. Colorectal cancer use remains selective with biomarker focus. Other cancers show gradual integration across oncology care.
- For instance, nivolumab achieved a 69% overall response rate in relapsed Hodgkin lymphoma patients in the CheckMate-205 trial, supporting strong adoption in hematologic oncology.
Segmentation:
Type
- PD-1 inhibitors
- PD-L1 inhibitors
- CTLA-4 inhibitors
Application
- Lung cancer
- Melanoma
- Bladder cancer
- Hodgkin lymphoma
- Colorectal cancer
- Others (breast cancer and related types)
Region
- North America
- The U.S.
- Canada
- Mexico
- Europe
- Germany
- France
- The U.K.
- Italy
- Spain
- Rest of Europe
- Asia Pacific
- China
- Japan
- India
- South Korea
- South-east Asia
- Rest of Asia Pacific
- Latin America
- Brazil
- Argentina
- Rest of Latin America
- Middle East & Africa
- GCC Countries
- South Africa
- Rest of Middle East and Africa
Regional Analysis:
North America And Europe
The Immune Checkpoint Inhibitors Market shows strong dominance in North America, which holds nearly 45% market share. The United States leads due to high therapy adoption and strong reimbursement support. Advanced oncology infrastructure supports rapid uptake. Clinical trial density strengthens physician confidence. Europe accounts for about 30% market share. Germany, France, and the UK drive regional demand. Public healthcare coverage supports steady treatment access across major countries.
Asia-Pacific
Asia-Pacific represents around 18% market share and shows fast expansion. China leads due to rising cancer incidence and domestic drug approvals. Japan supports adoption through strong regulatory frameworks. South Korea invests heavily in immuno-oncology research. Expanding hospital networks improve access to advanced therapies. Regional manufacturers strengthen local supply chains. Growing awareness supports higher diagnosis and treatment rates across urban centers.
Latin America And Middle East And Africa
Latin America and the Middle East and Africa together hold nearly 7% market share. Brazil and Mexico lead adoption in Latin America. Private oncology centers support therapy use. Public reimbursement remains limited in several countries. Middle East markets grow through investment in specialty cancer hospitals. Gulf countries adopt advanced immunotherapy faster than Africa. Infrastructure gaps limit wider regional penetration.
Key Player Analysis:
- Merck & Co., Inc.
- Bristol-Myers Squibb Company
- Hoffmann-La Roche Ltd.
- AstraZeneca PLC
- Regeneron Pharmaceuticals Inc.
- BeiGene Ltd.
- GlaxoSmithKline PLC
- Sanofi
Competitive Analysis:
The Immune Checkpoint Inhibitors Market features strong competition among global pharmaceutical leaders. Major players focus on broad oncology portfolios and strong clinical pipelines. Companies invest heavily in late-stage trials to expand indications. Brand strength and physician trust shape prescribing patterns. It benefits firms with early approvals and wide geographic reach. Strategic pricing and reimbursement access support competitive positioning. Firms pursue lifecycle management through combination regimens. Continuous innovation sustains long-term leadership in this market.
Recent Developments:
- In June 2025, Bristol-Myers Squibb announced a global strategic partnership with BioNTech to co-develop and co-commercialize BNT327, a next-generation bispecific antibody candidate targeting PD-L1 and VEGF-A. BNT327 has been evaluated in multiple ongoing trials with more than 1,000 patients treated, including global Phase 3 trials with registrational potential in extensive-stage small cell lung cancer (ES-SCLC) and non-small cell lung cancer (NSCLC). A triple-negative breast cancer (TNBC) trial is planned to start by the end of 2025, with more than 20 clinical trials currently ongoing or planned to evaluate BNT327 across more than 10 solid tumor indications.
- In February 2025, Bristol-Myers Squibb announced that the Phase 3 RELATIVITY-098 trial evaluating Opdualag (nivolumab and relatlimab-rmbw) for adjuvant treatment of patients with completely resected stage III-IV melanoma did not meet its primary endpoint of recurrence-free survival. However, Opdualag remains the standard of care in the first-line treatment of unresectable or metastatic melanoma, as approved by the FDA in 2022.
Report Coverage:
The research report offers an in-depth analysis based on Type and Application segments. It details leading market players, providing an overview of their business, product offerings, investments, revenue streams, and key applications. Additionally, the report includes insights into the competitive environment, SWOT analysis, current market trends, as well as the primary drivers and constraints. Furthermore, it discusses various factors that have driven market expansion in recent years. The report also explores market dynamics, regulatory scenarios, and technological advancements that are shaping the industry. It assesses the impact of external factors and global economic changes on market growth. Lastly, it provides strategic recommendations for new entrants and established companies to navigate the complexities of the market.
Future Outlook:
- Immunotherapy adoption will expand into earlier stages of cancer treatment across major indications.
- Combination regimens will increasingly define standard oncology treatment protocols.
- Biomarker-guided therapy selection will improve clinical precision and response consistency.
- Emerging markets will enhance patient access through oncology infrastructure expansion.
- Next-generation immune checkpoint targets will strengthen long-term innovation pipelines.
- Local manufacturing capabilities will help reduce supply chain and cost pressures.
- Regulatory agencies will continue to support faster approvals for novel therapies.
- Oncology centers will expand infusion and monitoring capacity for immunotherapies.
- Personalized cancer care will gain priority across hospital and specialty settings.
- Strategic partnerships will remain central to pipeline expansion and market leadership.=
Request a Free Sample
Fill in your details and we'll send you a free sample report.
- Sample data tables & charts
- Research methodology
Need a Custom Version of This Report?
Tailor the scope, geography, or segments to your exact requirements.
- Custom geography or segment scope
- Direct access to our analyst team
Frequently Asked Questions
What is the current market size for Immune Checkpoint Inhibitors Market, and what is its projected size in 2032?
At what Compound Annual Growth Rate is the Immune Checkpoint Inhibitors Market projected to grow between 2025 and 2032?
Which Immune Checkpoint Inhibitors Market segment held the largest share in 2024?
What are the primary factors fueling the growth of the Immune Checkpoint Inhibitors Market?
Which region commanded the largest share of the Immune Checkpoint Inhibitors Market in 2024?
Table of Content
Chapter 1. Report Introduction
- 1.1 Report Description & Purpose
- 1.1.1 Report Title & Market Definition
- 1.1.2 Unique Selling Propositions (USP) & Key Differentiators
- 1.1.3 Value Proposition for Stakeholders
- 1.2 Research Objectives
- 1.2.1 Market Sizing Objectives (Volume & Revenue)
- 1.2.2 Segmentation Objectives
- 1.2.3 Competitive Intelligence Objectives
- 1.2.4 Forecast & Scenario Objectives
- 1.3 Report Scope
- 1.3.1 Immune Checkpoint Inhibitors Scope – Types & Subtypes Covered
- 1.3.2 Geographic Scope – Regions & Countries Covered
- 1.3.3 Historical Period, Base Year & Forecast Period (2024; forecast to 2032)
- 1.3.4 Inclusions & Exclusions
- 1.4 HS Code & Classification Framework
- 1.5 Currency, Units & Pricing Basis
- 1.6 Target Stakeholders
- 1.7 Limitations & Assumptions
Chapter 2. Executive Summary
- 2.1 Global Immune Checkpoint Inhibitors Market Snapshot
- 2.1.1 Market Size – Historical (2024) & Forecast (2024-2032) (2024: USD 49,490 million → 2032: USD 143,166.7 million)
- 2.1.2 Volume & Revenue – Global Totals
- 2.1.3 Key Market Highlights – Top Five Facts
- 2.2 Immune Checkpoint Inhibitors Market Segmentation Snapshot
- 2.2.1 Market Split by Region – 2024 vs. 2032
- 2.3 Competitive Snapshot
- 2.3.1 Top 10 Players by Revenue Share – 2024
- 2.3.2 Top 10 Players by Volume Share – 2024
- 2.3.3 Recent Strategic Developments (18-Month Summary)
- 2.4 Key Investment Highlights & Strategic Conclusions
Chapter 3. Immune Checkpoint Inhibitors Market Dynamics & Industry Analysis
- 3.1 Market Overview & Context
- 3.1.1 Immune Checkpoint Inhibitors Market Position in the Broader Automotive Value Chain
- 3.1.2 OEM vs. Replacement Market Dynamics
- 3.1.3 Market Maturity & Development Stage by Region
- 3.2 Immune Checkpoint Inhibitors Market Drivers
- 3.3 Immune Checkpoint Inhibitors Market Restraints & Challenges
- 3.4 Immune Checkpoint Inhibitors Market Opportunities
- 3.5 Porter's Five Forces Analysis
- 3.5.1 Threat of New Entrants
- 3.5.2 Bargaining Power of Suppliers
- 3.5.3 Bargaining Power of Buyers
- 3.5.4 Threat of Substitutes
- 3.5.5 Competitive Rivalry – Intensity Assessment
- 3.6 Immune Checkpoint Inhibitors Value Chain Analysis
- 3.6.1 Upstream – Raw Material/Input Suppliers
- 3.6.1.1 Raw Material/Input 1
- 3.6.1.2 Raw Material/Input 2
- 3.6.1.3 Raw Material/Input 3
- 3.6.2 Midstream – Production/Manufacturing/Service Delivery
- 3.6.2.1 Production/Process Overview
- 3.6.2.2 Key Facility Locations & Capacity by Manufacturer
- 3.6.3 Downstream – Distribution & End Consumer
- 3.6.3.1 Primary Channel – B2B/OEM
- 3.6.3.2 Secondary Channels – Dealer, Retail, Online, Direct
- 3.6.4 Value Chain Profitability Analysis
- 3.6.1 Upstream – Raw Material/Input Suppliers
- 3.7 PESTEL Analysis
- 3.7.1 Political Factors
- 3.7.2 Economic Factors
- 3.7.3 Social Factors
- 3.7.4 Technological Factors
- 3.7.5 Environmental Factors
- 3.7.6 Legal Factors
- 3.8 Immune Checkpoint Inhibitors Supply Chain Analysis
- 3.8.1 Raw Material/Input Supply Risk Assessment
- 3.8.2 Manufacturing Concentration Risk (Geographic Exposure)
- 3.8.3 Trade Disruption Impact Analysis
- 3.9 Regulatory & Policy Landscape
Note: The regulatory and policy landscape section covers regulations based on their applicability to the market, Immune Checkpoint Inhibitors category, geography, and scope of the study. Only regulatory frameworks with a material impact on operations, compliance, trade, sustainability, or market access are analyzed in detail.
Chapter 4. Key Investment Pockets & Opportunity Analysis
- 4.1 Immune Checkpoint Inhibitors Market Attractiveness Analysis
- 4.1.1 By Region – Investment Attractiveness Matrix (Volume × CAGR)
- 4.2 Absolute Revenue Growth Opportunity
- 4.2.1 By Region – Absolute USD Growth Through 2032
- 4.3 Incremental Volume Opportunity
- 4.3.1 By Region – Incremental Volume Through 2032
- 4.3.2 Segment – Incremental Volume
- 4.4 Emerging Submarket Opportunity Deep Dive (Subject to Applicability)
- 4.5 Emerging Market Opportunity Scorecards
- 4.5.1 United States
- 4.5.2 Europe
- 4.5.3 Asia
- 4.5.4 Middle East & Africa
Note: Emerging Market Opportunity Scorecards will be included based on relevance and strategic importance. Regions listed are indicative and may vary depending on data availability and market dynamics.
Chapter 5. Immune Checkpoint Inhibitors Import-Export Analysis & Trade Flows
- 5.1 Global Trade Overview
- 5.1.1 Global Export Value by Country (2024)
- 5.1.2 Global Export Volume by Country (2024)
- 5.1.3 Global Import Value by Country (2024)
- 5.1.4 Global Import Volume by Country (2024)
- 5.1.5 Net Trade Balance by Country (2024)
- 5.2 Export Analysis – Segment
- 5.2.1 Type 1 (HS Code)
- 5.2.2 Type 2 (HS Code)
- 5.2.3 Type 3 (HS Code)
- 5.2.4 Type 4 (HS Code)
- 5.2.5 Type 5 (HS Code)
- 5.3 Import Analysis – Segment
- 5.3.1 Type 1 (HS Code)
- 5.3.2 Type 2 (HS Code)
- 5.3.3 Type 3 (HS Code)
- 5.3.4 Type 4 (HS Code)
- 5.3.5 Type 5 (HS Code)
- 5.4 Average Unit Trade Prices
- 5.4.1 Average Export Price – Segment & Country
- 5.4.2 Average Import Price – Segment & Source Country
- 5.4.3 Price Trends (2024)
- 5.5 Key Trade Route Analysis
- 5.5.1 Trade Route 1
- 5.5.2 Trade Route 2
- 5.5.3 Trade Route 3
- 5.5.4 Trade Route 4
- 5.5.5 Trade Route 5
- 5.6 Trade Policy Impact Assessment
- 5.6.1 US Anti-Dumping & Section 301 Tariffs
- 5.6.2 EU Customs Union Impact
- 5.6.3 Major Free Trade Agreements
- 5.6.4 USMCA Rules of Origin
Note: Trade policy analysis will be included only where relevant to the Immune Checkpoint Inhibitors market.
Chapter 6. Competitive Landscape & Company Benchmarking
- 6.1 Immune Checkpoint Inhibitors Market Concentration & Structure
- 6.1.1 Herfindahl-Hirschman Index (HHI) – vs. 2024
- 6.1.2 Tier 1, Tier 2 & Tier 3 Market Structure
- 6.1.3 Global, Regional & Local Player Dynamics
- 6.2 Immune Checkpoint Inhibitors Market Share Analysis – 2024
- 6.2.1 Global Revenue Share by Company
- 6.2.2 Global Volume Share by Company
- 6.2.3 Regional Revenue Share
- 6.2.4 Market Share Evolution ( vs. 2024)
- 6.2.5 OEM Segment Share by Company
- 6.2.6 Replacement Segment Share by Company
- 6.3 Production/Delivery Capacity & Facility Analysis
- 6.3.1 Global Installed Capacity
- 6.3.2 Capacity Utilization Rates
- 6.3.3 Production/Output Volume
- 6.3.4 Facility Locations & Capacity Map
- 6.3.5 Planned Capacity Additions
- 6.4 Immune Checkpoint Inhibitors Competitive Benchmarking Matrix
- 6.4.1 Revenue, Volume, CAGR & Profitability Comparison
- 6.4.2 Channel Revenue Mix
- 6.4.3 Geographic Revenue Exposure
- 6.4.4 R&D Intensity
- 6.4.5 Sustainability Maturity
- 6.5 Strategic Developments in Immune Checkpoint Inhibitors (Last 24 Months)
- 6.5.1 Mergers, Acquisitions & Divestments
- 6.5.2 New Immune Checkpoint Inhibitors Launches
- 6.5.3 Facility Expansions
- 6.5.4 Strategic Alliances, Joint Ventures & Partnerships
- 6.5.5 Distribution Expansion & Market Entry
- 6.5.6 Sustainability & ESG Initiatives
- 6.6 Competitive Strategy Mapping
- 6.6.1 Leader, Challenger, Follower & Niche Classification
- 6.6.2 Pricing Strategy Comparison
- 6.6.3 Channel Strategy Matrix
Note: Strategic developments are included based on their materiality and the availability of reliable information.
Chapter 7. Global Immune Checkpoint Inhibitors Market – By Distribution Channel
- 7.1 Segment Overview
- 7.1.1 Volume & Revenue Split by Channel (2024 & 2032)
- 7.1.2 Channel Mix Evolution (2024-2032)
Chapter 8. Regional Market Analysis – Global Overview
- 8.1 Global Regional Overview
- 8.1.1 Regional Volume Share
- 8.1.2 Regional Revenue Share
- 8.1.3 Regional Volume by Region
- 8.1.4 Regional Revenue by Region
- 8.1.5 Regional Forecast Through 2032
- 8.2 Cross-Regional Segment Analysis
- 8.2.1 By Distribution Channel
- 8.2.2 By Brand/Price Tier
Chapter 9. North America Immune Checkpoint Inhibitors Market
- 9.1 United States
- 9.2 Canada
- 9.3 Mexico
Chapter 10. Europe Immune Checkpoint Inhibitors Market
- 10.1 Germany
- 10.2 France
- 10.3 Italy
- 10.4 United Kingdom
- 10.5 Spain
- 10.6 Poland
- 10.7 Russia
- 10.8 Netherlands
- 10.9 Belgium
- 10.10 Sweden
- 10.11 Denmark
- 10.12 Norway
- 10.13 Rest of Europe
Chapter 11. Asia Pacific Immune Checkpoint Inhibitors Market
- 11.1 China
- 11.2 India
- 11.3 Japan
- 11.4 South Korea
- 11.5 Thailand
- 11.6 Indonesia
- 11.7 Vietnam
- 11.8 Malaysia
- 11.9 Australia
- 11.10 Rest of Asia Pacific
Chapter 12. Latin America Immune Checkpoint Inhibitors Market
- 12.1 Brazil
- 12.2 Argentina
- 12.3 Colombia
- 12.4 Chile
- 12.5 Rest of Latin America
Chapter 13. Middle East Immune Checkpoint Inhibitors Market
- 13.1 Saudi Arabia
- 13.2 United Arab Emirates
- 13.3 Turkey
- 13.4 Israel
- 13.5 Iran
- 13.6 Rest of the Middle East
Chapter 14. Africa Immune Checkpoint Inhibitors Market
- 14.1 South Africa
- 14.2 Egypt
- 14.3 Nigeria
- 14.4 Morocco
- 14.5 Rest of Africa
Chapter 15. Immune Checkpoint Inhibitors Company Profiles
- 15.1 [Company 01]
- 15.1.1 Company Overview
- 15.1.2 Key Management Personnel
- 15.1.3 Products & Services Portfolio
- 15.1.4 Financial Performance
- 15.1.5 Key Market Focus & Geographic Presence
- 15.1.6 Recent Developments & Strategic Initiatives
Note: The company profile list is preliminary and may change based on research findings, market developments, data availability, and client requirements.
Chapter 16. Appendices
- Appendix A – List of Abbreviations & Acronyms
- Appendix B – Industry Classification Code Reference – Full Series
- Appendix C – Production & Capacity Data Tables
- Appendix D – End-Use & Demand Base Tables
- Appendix E – Consumption & Replacement Rate Assumptions
- Appendix F – ASP Reference Tables
- Appendix G – Manufacturing & Facility Database
- Appendix H – Import-Export Data Tables
- Appendix I – Regulatory Summary Tables
- Appendix J – Primary Research Participant List (Anonymized)
- Appendix K – Primary Research Questionnaire Framework
- Appendix L – Data Sources & Bibliography
- Appendix M – Market Size Divergence & Source Comparison
Chapter 17. Research Methodology
- 17.1 Research Framework & Philosophy
- 17.2 Secondary Research – Sources, Hierarchy & Data Extraction
- 17.3 Data Modeling – Bottom-Up & Top-Down Market Sizing
- 17.4 Primary Research – Stakeholder Framework, LOI & Sample Sizes
- 17.5 Forecast Methodology – Regression, Scenario & Sensitivity Analysis
- 17.6 Quality Control – Four-Layer Validation Framework
- 17.7 Limitations & Standard Assumptions
- 17.8 Disclaimer
