| REPORT ATTRIBUTE |
DETAILS |
| Historical Period |
2020-2023 |
| Base Year |
2024 |
| Forecast Period |
2025-2032 |
| Intravitreal Injectables Market Size 2024 |
USD 11,058.85 million |
| Intravitreal Injectables Market, CAGR |
7.42% |
| Intravitreal Injectables Market Size 2032 |
USD 19,512.06 million |
Market Overview
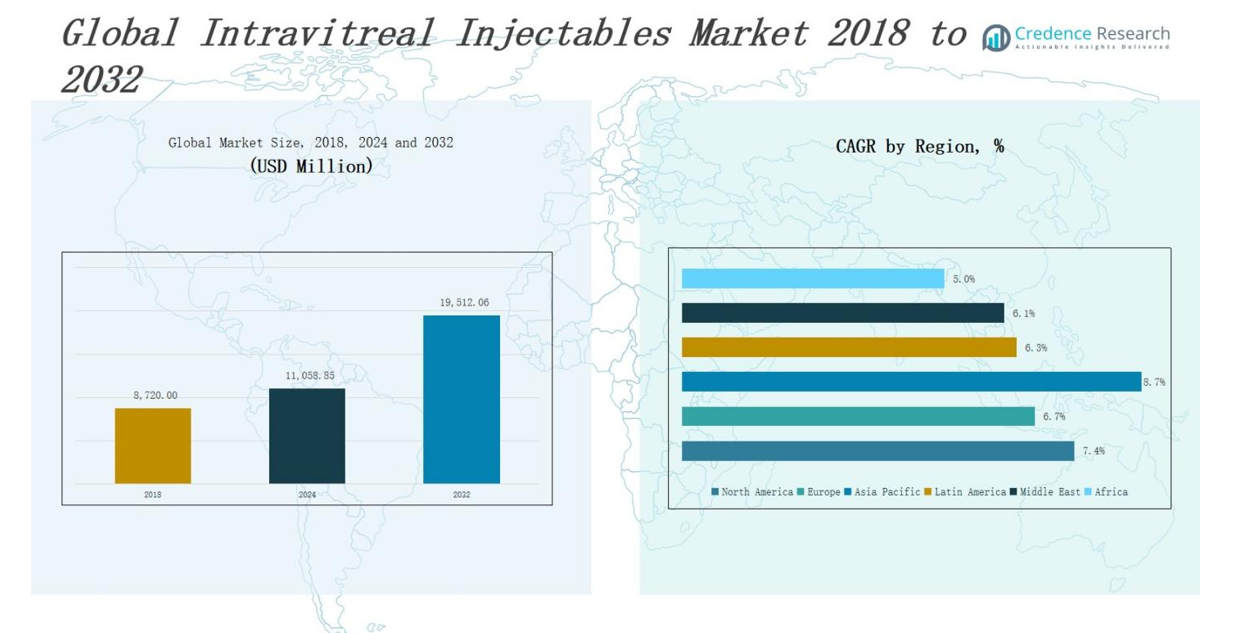
The Intravitreal Injectables Market size was valued at USD 8,720.00bmillion in 2018 to USD 11,058.85 million in 2024 and is anticipated to reach USD 19,512.06 million by 2032, at a CAGR of 7.42% during the forecast period.
The Intravitreal Injectables Market is driven by the increasing global prevalence of retinal diseases such as age-related macular degeneration (AMD), diabetic macular edema (DME), and retinal vein occlusion. The expanding geriatric population and rising incidence of diabetes significantly contribute to a larger patient base requiring intravitreal therapies. Market growth is further fueled by advancements in biologics, sustained-release drug delivery systems, and the development of novel anti-VEGF agents that offer improved efficacy and extended dosing intervals. Growing awareness among patients and healthcare providers, coupled with improved access to specialized ophthalmic care, supports market expansion. A notable trend includes the shift toward personalized treatment regimens and combination therapies aimed at enhancing therapeutic outcomes. Additionally, increasing clinical trials and regulatory approvals for pipeline drugs indicate a strong innovation landscape. The integration of digital tools for remote monitoring and follow-up care is also gaining traction, improving patient compliance and long-term disease management. These factors collectively sustain market momentum across developed and emerging economies.
The Intravitreal Injectables Market shows strong geographical diversity, with North America leading due to advanced healthcare infrastructure and high prevalence of retinal disorders. Europe holds the second-largest share, supported by structured reimbursement and aging demographics. Asia Pacific is the fastest-growing region, driven by rising diabetes cases, expanding healthcare access, and growing awareness. Latin America and the Middle East are witnessing moderate growth, fueled by urbanization, healthcare investments, and increasing adoption of anti-VEGF therapies. Africa represents an emerging market with untapped potential, hindered by access and affordability challenges. Key players operating globally include Roche, Novartis, Regeneron Pharmaceuticals, Bayer AG, Allergan (AbbVie), Alimera Sciences, Santen Pharmaceutical, Bausch Health, Genentech, Ocular Therapeutix, Kodiak Sciences, and REGENXBIO, among others. These companies are expanding presence across regions through innovation, partnerships, and targeted distribution strategies.
Market Insights
- The Intravitreal Injectables Market was valued at USD 11,058.85 million in 2024 and is projected to reach USD 19,512.06 million by 2032, growing at a CAGR of 7.42%.
- Market growth is driven by the rising global incidence of retinal diseases such as AMD, DME, and retinal vein occlusion, supported by the expanding geriatric and diabetic population.
- Advancements in anti-VEGF biologics, sustained-release implants, and extended-dosing therapies are improving treatment outcomes and patient adherence.
- Patient compliance remains a challenge due to procedural discomfort and frequent injections, while high treatment costs limit access in low- and middle-income countries.
- North America leads the market with strong infrastructure and high awareness, followed by Europe, while Asia Pacific is the fastest-growing region due to healthcare expansion.
- Latin America and the Middle East are showing moderate growth supported by urbanization and increased public-private healthcare initiatives.
- Africa remains an emerging market with untapped potential, where improvements in outreach programs and diagnosis are slowly expanding market presence.
Access crucial information at unmatched prices!
Request your sample report today & start making informed decisions powered by Credence Research Inc.!
Download Sample
Market Drivers
Rising Prevalence of Retinal Disorders
The Intravitreal Injectables Market is experiencing strong growth due to the increasing global burden of retinal disorders such as age-related macular degeneration (AMD), diabetic retinopathy, and retinal vein occlusion. These conditions are becoming more common due to aging populations and the global diabetes epidemic. With more individuals developing these chronic eye diseases, demand for effective, localized treatments continues to rise. Intravitreal injectables offer targeted therapy directly to the retina, reducing systemic side effects. Healthcare providers are increasingly adopting these treatments for their proven efficacy and precision. The surge in diagnostic rates and improved screening technologies also support higher treatment uptake. The market benefits from ongoing initiatives to raise awareness of early intervention in vision-threatening retinal conditions.
- For instance, aflibercept biosimilar injections improved best-corrected visual acuity from 0.53 to 0.26 logMAR and reduced central retinal thickness from 422.4 μm to 281.0 μm in diabetic macular edema patients over six months.
Advancements in Drug Formulations and Delivery
Technological innovation plays a crucial role in driving the Intravitreal Injectables Market forward. Pharmaceutical companies are investing in the development of long-acting formulations that reduce injection frequency while maintaining therapeutic efficacy. These innovations aim to improve patient adherence and reduce the burden on ophthalmology clinics. It supports better disease management by minimizing the risk of missed doses and subsequent vision loss. Biologics such as anti-VEGF agents have set the standard in this field, and newer agents are showing promise in extending dosing intervals. Companies are also exploring biodegradable implants and refillable delivery systems. Such advancements position the market to attract broader adoption across diverse clinical settings.
- For instance, Allergan’s Ozurdex implant uses a biodegradable polymer to deliver dexamethasone over several months, offering sustained therapeutic effects for retinal vein occlusion and diabetic macular edema.
Expanding Geriatric Population and Lifestyle Diseases
The aging global population is significantly contributing to the growth of the Intravitreal Injectables Market. Elderly individuals are more susceptible to retinal conditions, particularly AMD and diabetic macular edema. It strengthens the demand for effective ophthalmic therapeutics that can preserve vision and improve quality of life. The rise in lifestyle diseases like diabetes further expands the treatment base, especially in developing economies where prevalence is accelerating. Governments and healthcare systems are increasingly allocating resources to address age-related vision impairment. With growing life expectancy, the need for sustained eye care interventions will continue to expand. This demographic shift ensures steady market demand over the long term.
Growing Adoption of Minimally Invasive Treatments
The preference for minimally invasive procedures is boosting demand in the Intravitreal Injectables Market. These treatments offer a safer alternative to systemic therapies and surgical interventions. It provides localized drug delivery, reducing the risk of complications and enhancing patient outcomes. Ophthalmologists prefer intravitreal injections for their ability to deliver consistent and measurable therapeutic effects. As clinical expertise improves and patient trust grows, procedure volumes are increasing globally. The outpatient nature of the treatment also makes it cost-effective and accessible. With further training, infrastructure, and awareness, adoption is likely to increase even in rural or underserved regions.
Market Trends
Shift Toward Long-Acting and Sustained-Release Therapies
The Intravitreal Injectables Market is witnessing a strong shift toward long-acting and sustained-release therapies aimed at reducing treatment burden. Frequent injections remain a major challenge for patients and providers. In response, pharmaceutical companies are focusing on developing agents with extended dosing intervals. Therapies such as faricimab and investigational implants are showing potential in maintaining efficacy while minimizing injection frequency. This trend supports improved patient adherence and clinic efficiency. It is also encouraging broader adoption among those hesitant about monthly procedures. As more of these therapies enter the market, treatment models are evolving.
- For instance, the Susvimo™ ocular implant, also developed by Genentech, delivers ranibizumab continuously for up to six months, reducing the frequency of clinic visits for patients.
Integration of Digital Monitoring and AI Tools
Technological integration is redefining clinical workflows within the Intravitreal Injectables Market. AI-driven imaging platforms and home-based monitoring devices are helping ophthalmologists track disease progression with greater precision. These tools support timely intervention and personalized treatment plans. It enhances patient outcomes by identifying changes earlier than standard clinical visits. Healthcare providers benefit from better data, while patients experience more proactive care. This trend aligns with the growing emphasis on tele-ophthalmology and decentralized follow-ups. It is transforming how providers manage chronic retinal conditions with injectable therapies.
- For instance, RetinaLyze’s AI platform analyzes OCT images to monitor retinal disease progression and supports personalized treatment plans.
Increasing Focus on Combination and Adjunctive Therapies
The emergence of combination and adjunctive therapies is shaping the future of the Intravitreal Injectables Market. Researchers are investigating dual-target agents that address multiple pathways involved in retinal diseases. This approach has the potential to improve efficacy and durability of response. Adjunctive therapies, including gene therapy and corticosteroids, are being explored to complement anti-VEGF agents. It signals a growing preference for comprehensive treatment strategies. Clinical trials are expanding to validate these new combinations. With promising early data, combination therapies are expected to diversify treatment protocols.
Growing Pipeline and Regulatory Momentum
The expanding drug pipeline and favorable regulatory environment are accelerating innovation in the Intravitreal Injectables Market. Several late-stage candidates are progressing through clinical trials, offering novel mechanisms of action and extended durability. Regulatory bodies are prioritizing breakthrough designations and fast-track reviews for promising therapies. This momentum supports quicker time-to-market and stronger investor confidence. It also helps address unmet needs across patient segments. The influx of new entrants and increasing collaboration between biotech firms and large pharmaceutical companies is intensifying R&D activity. The market is positioning for a new phase of therapeutic advancement.
Market Challenges Analysis
Patient Compliance and Procedural Discomfort
The Intravitreal Injectables Market faces a significant challenge in maintaining patient compliance due to the invasive nature of the treatment. Many patients require monthly or bi-monthly injections, which can lead to discomfort, anxiety, and appointment fatigue. This limits adherence, particularly among elderly populations or those with transportation barriers. It affects clinical outcomes and increases the risk of disease progression. The psychological and physical burden of frequent intraocular injections remains a key obstacle despite proven efficacy. Enhancing patient experience through better pain management and communication is critical for sustained treatment success.
High Treatment Costs and Limited Access
The high cost of intravitreal therapies presents another major challenge for the Intravitreal Injectables Market. Branded anti-VEGF drugs are expensive, placing financial strain on both patients and healthcare systems, especially in low- and middle-income regions. Insurance coverage disparities further restrict access, even in developed markets. It creates inequality in care delivery and limits early intervention opportunities. Generic competition remains limited due to complex manufacturing and regulatory pathways. Addressing affordability is essential to expanding market reach and reducing vision loss globally.
Market Opportunities
Expansion in Emerging Markets
Emerging economies present a strong growth opportunity for the Intravitreal Injectables Market. Rising incidence of diabetes and increased life expectancy are contributing to a growing population at risk of retinal diseases in regions such as Asia-Pacific, Latin America, and the Middle East. Governments and private players are investing in expanding ophthalmic care infrastructure and access to diagnostics. It creates favorable conditions for the introduction of advanced intravitreal therapies. As awareness of early vision care improves, demand for effective treatment options is expected to rise. Companies that offer affordable, scalable solutions can gain a competitive edge in these underpenetrated markets.
Innovation in Drug Delivery Technologies
Advancements in drug delivery systems offer significant opportunities to enhance the value proposition of the Intravitreal Injectables Market. Biodegradable implants, refillable reservoirs, and microneedle-based injectables are being developed to reduce the frequency of treatments and improve patient comfort. These innovations support better compliance and clinical outcomes. It can attract a broader patient base and reduce overall healthcare burden. Strategic partnerships between biotech firms and device manufacturers are accelerating the pace of innovation. Companies that successfully commercialize next-generation delivery platforms can transform treatment models and capture long-term market share.
Market Segmentation Analysis:
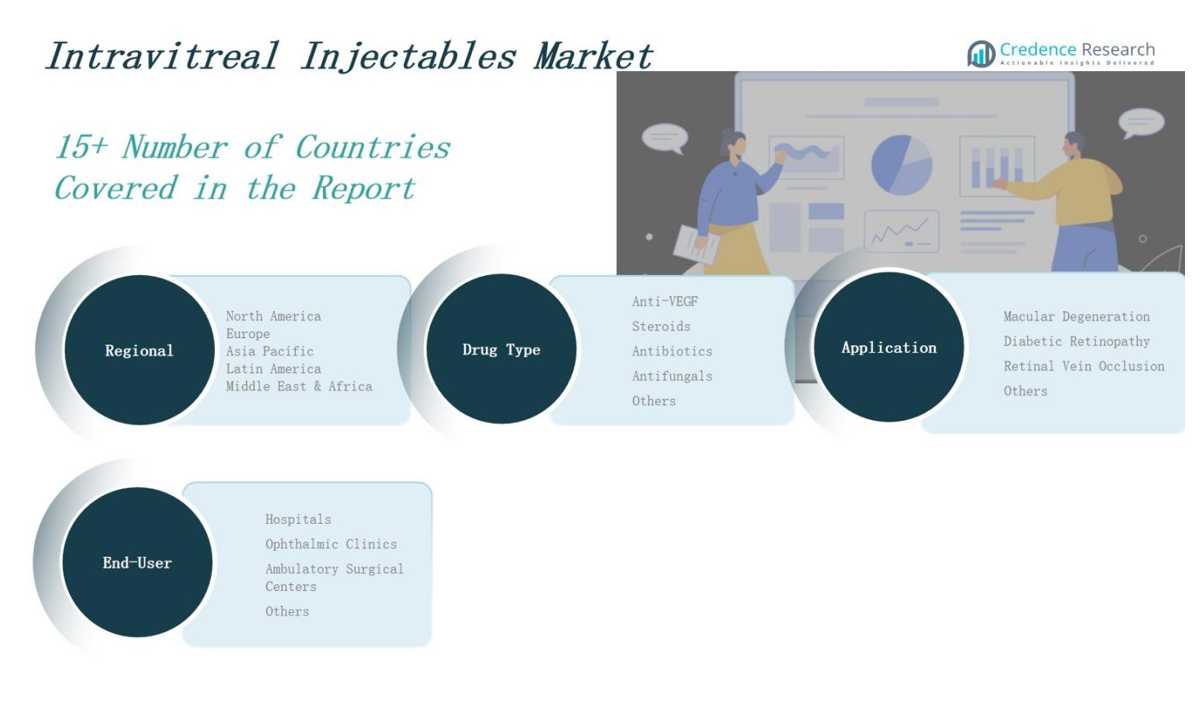
By Drug Type
The Intravitreal Injectables Market is dominated by the anti-VEGF segment due to its established efficacy in treating retinal diseases such as macular degeneration and diabetic retinopathy. Anti-VEGF drugs like ranibizumab and aflibercept hold a significant share owing to their widespread use and clinical outcomes. Steroids are gaining ground for inflammatory retinal conditions and serve as alternative treatments when anti-VEGF resistance occurs. Antibiotics and antifungals address infectious retinal disorders, though they occupy a smaller niche. The “Others” category includes emerging biologics and biosimilars, which are expected to increase competition and affordability.
- For instance, dexamethasone intravitreal implants are used as steroid treatments for inflammatory retinal diseases, especially in patients resistant to anti-VEGF therapy.
By Application
Macular degeneration leads the Intravitreal Injectables Market application segment due to its high global prevalence among the aging population. Diabetic retinopathy follows closely, driven by rising diabetes cases worldwide. Retinal vein occlusion represents a growing area of focus, with new therapies entering the pipeline. The “Others” category includes uveitis and infectious retinitis, contributing to market diversification. It benefits from broadening therapeutic indications and expanding clinical research efforts.
- For instance, intravitreal injections of anti-VEGF drugs are a standard treatment for diabetic retinopathy and its complications, such as diabetic macular edema, which are increasingly common as global diabetes prevalence rises.
By End-User
Hospitals account for the largest share in the Intravitreal Injectables Market, supported by advanced infrastructure and access to specialized care. Ophthalmic clinics represent a growing segment, driven by convenience and outpatient service models. Ambulatory surgical centers are expanding due to faster procedures and reduced treatment costs. The “Others” category includes academic institutes and vision research centers. It supports innovation and trial-based therapy adoption in controlled clinical settings.
Segments:
Based on Drug Type
- Anti-VEGF
- Steroids
- Antibiotics
- Antifungals
- Others
Based on Application
- Macular Degeneration
- Diabetic Retinopathy
- Retinal Vein Occlusion
- Others
Based on End-User
- Hospitals
- Ophthalmic Clinics
- Ambulatory Surgical Centers
- Others
Based on Region
- North America
- Europe
- Germany
- France
- U.K.
- Italy
- Spain
- Rest of Europe
- Asia Pacific
- China
- Japan
- India
- South Korea
- South-east Asia
- Rest of Asia Pacific
- Latin America
- Brazil
- Argentina
- Rest of Latin America
- Middle East & Africa
- GCC Countries
- South Africa
- Rest of the Middle East and Africa
Regional Analysis
North America
The North America Intravitreal Injectables Market size was valued at USD 3,182.80 million in 2018 to USD 3,987.76 million in 2024 and is anticipated to reach USD 7,026.33 million by 2032, at a CAGR of 7.4% during the forecast period. North America holds the largest market share in the Intravitreal Injectables Market, driven by the high prevalence of age-related macular degeneration and diabetic retinopathy. Strong healthcare infrastructure, advanced diagnostic capabilities, and early adoption of novel therapies support market growth. The U.S. dominates the regional landscape, supported by major pharmaceutical players and well-established reimbursement systems. Clinical trials and R&D investment remain strong, propelling drug innovation and faster regulatory approvals. It benefits from a growing elderly population and high awareness about vision care, maintaining North America’s lead in global market share.
Europe
The Europe Intravitreal Injectables Market size was valued at USD 2,306.44 million in 2018 to USD 2,811.96 million in 2024 and is anticipated to reach USD 4,687.82 million by 2032, at a CAGR of 6.7% during the forecast period. Europe is the second-largest regional market, holding a significant share in the Intravitreal Injectables Market due to robust public health systems and widespread access to ophthalmology services. Germany, France, and the UK are key contributors, supported by aging populations and rising incidence of retinal disorders. Regulatory bodies such as the EMA continue to streamline approvals, encouraging innovation. It sees steady uptake of anti-VEGF and corticosteroid treatments across both public and private settings. The market benefits from established clinical guidelines and a focus on early-stage retinal disease management.
Asia Pacific
The Asia Pacific Intravitreal Injectables Market size was valued at USD 2,207.90 million in 2018 to USD 2,920.04 million in 2024 and is anticipated to reach USD 5,668.27 million by 2032, at a CAGR of 8.7% during the forecast period. Asia Pacific is the fastest-growing region in the Intravitreal Injectables Market, driven by expanding healthcare access and a growing diabetic population. China, India, and Japan are key growth engines, supported by increasing investments in eye care infrastructure and growing demand for advanced treatments. Rising awareness of age-related vision issues and diabetic eye disease is accelerating diagnosis and treatment rates. It offers substantial growth potential for global and regional pharmaceutical companies entering underserved markets. Local manufacturing capabilities are improving, which enhances affordability and distribution efficiency.
Latin America
The Latin America Intravitreal Injectables Market size was valued at USD 498.78 million in 2018 to USD 625.82 million in 2024 and is anticipated to reach USD 1,015.99 million by 2032, at a CAGR of 6.3% during the forecast period. Latin America is witnessing gradual growth in the Intravitreal Injectables Market, led by Brazil, Mexico, and Argentina. Rising awareness about diabetic complications and government initiatives to improve access to vision care are key drivers. The region faces challenges in affordability and infrastructure, but urban centers show increasing adoption of anti-VEGF and corticosteroid therapies. It is experiencing growing involvement from international players through partnerships and education campaigns. Public-private collaborations are helping expand screening and treatment capacity in ophthalmology.
Middle East
The Middle East Intravitreal Injectables Market size was valued at USD 339.21 million in 2018 to USD 403.58 million in 2024 and is anticipated to reach USD 644.01 million by 2032, at a CAGR of 6.1% during the forecast period. The Middle East holds a modest but growing share of the Intravitreal Injectables Market, driven by rising cases of diabetes-related retinal disorders and government investments in healthcare modernization. GCC countries, especially Saudi Arabia and the UAE, are leading in adoption due to better infrastructure and specialist availability. The market is supported by efforts to enhance ophthalmic care and attract international pharmaceutical companies. It is seeing increased patient awareness and access to newer therapies, particularly in private healthcare facilities. Efforts to localize treatment and improve diagnostic services support long-term market expansion.
Africa
The Africa Intravitreal Injectables Market size was valued at USD 184.86 million in 2018 to USD 309.69 million in 2024 and is anticipated to reach USD 469.64 million by 2032, at a CAGR of 5.0% during the forecast period. Africa represents a small but emerging region in the Intravitreal Injectables Market, with South Africa, Egypt, and Nigeria leading adoption. Limited access to specialized care and affordability barriers continue to restrict widespread use. However, international aid programs and regional health initiatives are improving early diagnosis and treatment capacity. It holds long-term potential due to rising life expectancy and growing recognition of diabetic eye disease. Training programs and mobile clinics are enhancing outreach and improving coverage in underserved areas. Gradual market development is expected as infrastructure and awareness continue to improve.
Shape Your Report to Specific Countries or Regions & Enjoy 30% Off!
Key Player Analysis
- Roche
- Novartis
- Regeneron Pharmaceuticals
- Bayer AG
- Allergan (AbbVie)
- Alimera Sciences
- Santen Pharmaceutical
- Bausch Health Companies
- ThromboGenics
- Adverum Biotechnologies
- Graybug Vision
- Kodiak Sciences
- Ocular Therapeutix
- Clearside Biomedical
- EyePoint Pharmaceuticals
- Genentech
- Ohr Pharmaceutical
- Opthea Limited
- PanOptica
- REGENXBIO
- KUBOTA Corporation
Competitive Analysis
The Intravitreal Injectables Market is highly competitive, led by established pharmaceutical companies with strong ophthalmology portfolios. Roche, Novartis, and Regeneron dominate the landscape with blockbuster drugs such as Lucentis, Beovu, and Eylea, respectively. Bayer AG supports global distribution of Eylea outside the U.S., strengthening its position. Allergan (AbbVie) and Alimera Sciences maintain presence with corticosteroid-based therapies like Ozurdex and Iluvien. Emerging players such as Kodiak Sciences, Adverum Biotechnologies, and Graybug Vision are developing long-acting injectables that aim to disrupt existing treatment protocols. Companies like Ocular Therapeutix, EyePoint Pharmaceuticals, and Clearside Biomedical are advancing sustained-release delivery platforms, expanding innovation. The market shows active investment in R&D, partnerships, and clinical trials, targeting extended dosing intervals and improved patient compliance. It continues to evolve with biosimilars, combination therapies, and AI-integrated treatment models. Competitive intensity remains high due to the potential for market expansion across developed and emerging regions.
Recent Developments
- In May 2025, Roche (via Genentech) received FDA approval for Susvimo® to treat diabetic retinopathy, expanding its retinal disease portfolio.
- In March 2025, ANI Pharmaceuticals announced FDA approval for the expanded label of Iluvien, allowing its use in chronic non-infectious posterior uveitis (NIU‑PS).
- In July 2024, Merck completed its acquisition of EyeBio, gaining access to its late-stage intravitreal candidate Restoret™ for DME and neovascular AMD.
- In February 2025, Astellas Pharma received FDA approval to extend the dosing interval of Izervay™ for treating geographic atrophy secondary to dry AMD, enhancing patient convenience.
Market Concentration & Characteristics
The Intravitreal Injectables Market is moderately concentrated, with a few major players holding a significant share due to their established portfolios and clinical efficacy. Companies such as Roche, Novartis, and Regeneron dominate with flagship therapies like Lucentis, Beovu, and Eylea. It features high entry barriers due to complex regulatory pathways, biologic development costs, and the need for long-term clinical validation. The market is characterized by strong brand loyalty among ophthalmologists, a growing preference for long-acting formulations, and increasing focus on patient-centric drug delivery systems. Competitive differentiation often hinges on dosing frequency, treatment durability, and safety profile. It also reflects a trend toward innovation, with emerging players investing in gene therapy and biodegradable implants. Strategic partnerships, licensing agreements, and robust clinical pipelines shape competitive behavior. Pricing pressure and access challenges persist in developing markets, influencing localized strategies. The market maintains steady growth potential through demographic shifts, technological advances, and global disease burden expansion.
Report Coverage
The research report offers an in-depth analysis based on Drug Type, Application, End-User and Region. It details leading market players, providing an overview of their business, product offerings, investments, revenue streams, and key applications. Additionally, the report includes insights into the competitive environment, SWOT analysis, current market trends, as well as the primary drivers and constraints. Furthermore, it discusses various factors that have driven market expansion in recent years. The report also explores market dynamics, regulatory scenarios, and technological advancements that are shaping the industry. It assesses the impact of external factors and global economic changes on market growth. Lastly, it provides strategic recommendations for new entrants and established companies to navigate the complexities of the market.
Future Outlook
- Demand for intravitreal injectables will rise due to the increasing global burden of retinal diseases like AMD and diabetic macular edema.
- Development of long-acting therapies will reduce injection frequency and improve patient adherence.
- Advances in sustained-release drug delivery systems will enhance treatment outcomes and clinical efficiency.
- Innovation in personalized and combination therapies will support more effective disease management.
- Integration of digital tools and remote monitoring will improve follow-up care and compliance.
- Market penetration will grow in emerging economies through improved healthcare infrastructure and awareness.
- Regulatory approvals for new biologics and gene therapies will expand treatment options.
- Strategic partnerships and acquisitions will strengthen product pipelines and geographic reach.
- Price sensitivity and reimbursement policies will influence market strategies in cost-conscious regions.
- Increasing clinical research investment will accelerate innovation across anti-VEGF and non-VEGF segments.


