Market Overview
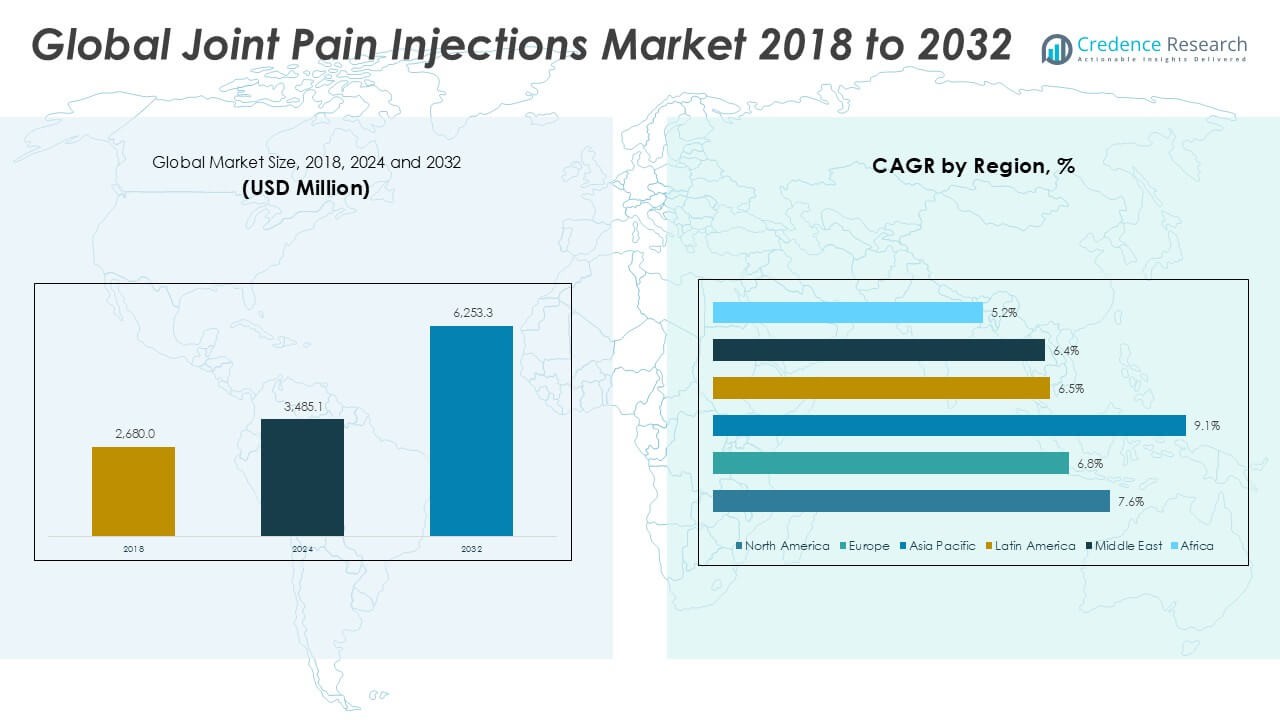
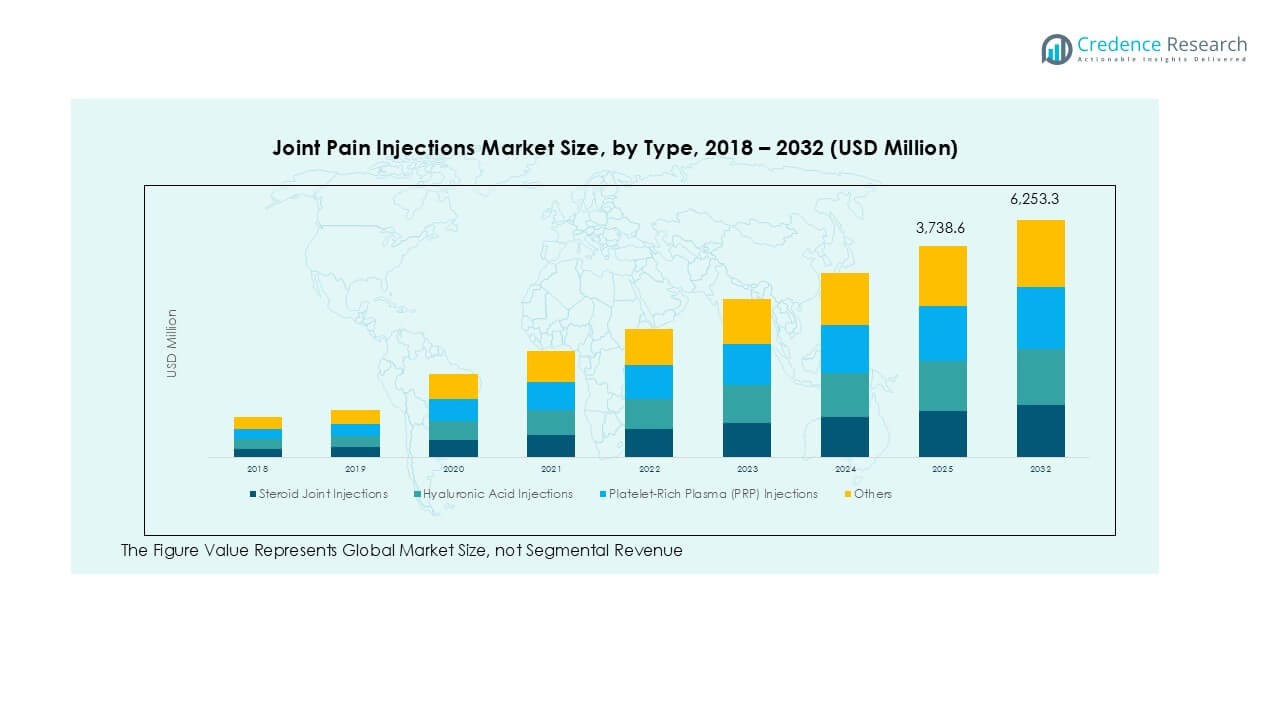
The Joint Pain Injections market size was valued at USD 2,680.0 million in 2018 to USD 3,485.1 million in 2024 and is anticipated to reach USD 6,253.3 million by 2032, at a CAGR of 7.63% during the forecast period.
| REPORT ATTRIBUTE |
DETAILS |
| Historical Period |
2020-2023 |
| Base Year |
2024 |
| Forecast Period |
2025-2032 |
| Joint Pain Injections Market Size 2024 |
USD 3,485.1 Million |
| Joint Pain Injections Market, CAGR |
7.63% |
| Joint Pain Injections Market Size 2032 |
USD 6,253.3 Million |
The joint pain injections market is led by global players such as Anika Therapeutics, Arthrex, Bioventus, Pacira BioSciences (Flexion), Pfizer, Sanofi, Stryker Corporation, and Zimmer Biomet Holdings. These companies hold strong portfolios in corticosteroid, hyaluronic acid, and biologic-based injections, supported by strategic investments in R&D and clinical trials for advanced regenerative therapies. North America emerged as the leading region in 2024, commanding a 40.9% market share, driven by high adoption of minimally invasive treatments, strong reimbursement frameworks, and well-established healthcare infrastructure. Europe followed with a 24.1% share, supported by aging demographics and favorable insurance systems. Asia Pacific, with 23.0% share and the fastest growth rate, is poised to become a major future hub, propelled by rising healthcare access, growing prevalence of osteoarthritis, and expanding medical tourism.
Access crucial information at unmatched prices!
Request your sample report today & start making informed decisions powered by Credence Research Inc.!
Download Sample
Market Insights
- The Joint Pain Injections market was valued at USD 3,485.1 million in 2024 and is projected to reach USD 6,253.3 million by 2032, expanding at a CAGR of 7.63%.
- Rising prevalence of osteoarthritis and rheumatoid arthritis, combined with growing demand for minimally invasive pain management solutions, drives market expansion across both developed and developing regions.
- Key trends include increasing adoption of platelet-rich plasma (PRP) and biologic injections, alongside technological advancements in guided delivery methods that improve precision and treatment outcomes.
- The competitive landscape features strong players such as Anika Therapeutics, Arthrex, Bioventus, Pfizer, Sanofi, Stryker, and Zimmer Biomet, with smaller firms focusing on niche biologics and affordable viscosupplementation therapies to capture regional demand.
- North America leads with 40.9% share, followed by Europe at 24.1% and Asia Pacific at 23.0%, while knee and ankle applications dominate with nearly 45% share, highlighting the central role of osteoarthritis in shaping demand patterns.
Market Segmentation Analysis:
By Type
Steroid joint injections dominated the market in 2024 with over 40% share, owing to their widespread use for immediate pain relief and inflammation reduction in osteoarthritis and rheumatoid arthritis patients. Their low cost, proven efficacy, and easy availability through healthcare facilities further strengthen adoption. Hyaluronic acid injections are gaining steady traction as viscosupplementation therapies, particularly for knee osteoarthritis. Platelet-rich plasma (PRP) injections are expanding in demand due to regenerative benefits, while the “Others” category, including biologics, remains a niche but emerging segment driven by innovation in advanced pain therapies.
- For instance, Depo-Medrol (methylprednisolone acetate) is a product manufactured by Pfizer and is used for various conditions, including joint pain therapy. The company distributes this drug internationally.
By Application
Knee and ankle applications accounted for the largest share of the joint pain injections market in 2024, representing nearly 45%. High prevalence of knee osteoarthritis among the aging population and sports-related ankle injuries fuel demand. Shoulder and elbow injections are also widely used for athletes and patients with repetitive stress injuries. Spinal joint injections, though smaller in share, show growth due to increasing cases of chronic back pain. The “Others” category, covering small joints, reflects niche use but highlights future opportunities as broader musculoskeletal conditions are targeted.
- For instance, Flexion Therapeutics developed ZILRETTA (extended-release triamcinolone acetonide) for knee OA; in its Phase 3 trial, patients reported pain relief sustained through 12 weeks and some through 16 weeks post injection.
By Distribution Channel
Hospital pharmacies held the dominant share of more than 50% in 2024, reflecting patient reliance on hospital-based treatments and prescribed therapies for joint pain. Their leadership is supported by specialist consultations, availability of advanced injections, and insurance coverage in many regions. Retail pharmacies follow, catering to patients seeking convenient access for refills. Online pharmacies are emerging as a fast-growing channel, particularly in developed economies, driven by digital healthcare expansion and home delivery services. The “Others” category includes specialty clinics and rehabilitation centers, adding to distribution diversity.
Key Growth Drivers
Rising Prevalence of Osteoarthritis and Chronic Joint Disorders
The increasing prevalence of osteoarthritis, rheumatoid arthritis, and sports-related joint injuries stands as the leading driver of the joint pain injections market. According to global health estimates, osteoarthritis affects millions of aging adults worldwide, leading to significant functional limitations and demand for effective pain management. Steroid and hyaluronic acid injections are widely adopted as first-line non-surgical interventions, reducing inflammation and improving mobility. Growing awareness of early treatment options, coupled with rising life expectancy and sedentary lifestyles, continues to boost patient volumes. In emerging economies, improved diagnostic rates and expansion of healthcare access further accelerate demand for intra-articular injections.
- For instance, Anika Therapeutics reported that its Cingal® (hyaluronic acid + triamcinolone hexacetonide) resulted in a 70% improvement from baseline in WOMAC pain scores at 12 weeks, in a randomized trial of 368 patients with knee osteoarthritis.
Shift Toward Minimally Invasive and Regenerative Therapies
Growing preference for minimally invasive pain management solutions is driving adoption of joint pain injections. Patients increasingly opt for injections over surgical interventions due to shorter recovery times, lower risks, and cost advantages. Platelet-rich plasma (PRP) injections are gaining traction as regenerative therapies, offering tissue-healing potential and long-term relief for athletes and elderly patients alike. Clinical evidence supporting Visco supplementation with hyaluronic acid in knee osteoarthritis adds further credibility. Demand is also propelled by technological advancements in guided injection techniques, including ultrasound and fluoroscopy, which improve precision and efficacy. This shift highlights a long-term trend toward safer, innovative treatment solutions.
- For example, in a specific 2021 study involving 70 patients with early knee osteoarthritis, PRP injections resulted in a significant increase in the mean IKDC score from a baseline of 38.99 to 63.86 at 6 months.
Expansion of Healthcare Infrastructure and Insurance Coverage
The growing accessibility of healthcare services, supported by infrastructure expansion and favorable reimbursement policies, fuels market growth. In developed regions, insurance coverage for corticosteroid and hyaluronic acid injections encourages higher adoption rates among patients seeking affordable care. Hospital pharmacies play a major role, ensuring consistent access to advanced therapies under physician supervision. In developing regions, public health programs are increasingly emphasizing musculoskeletal health and pain management, boosting awareness of injection-based treatments. Combined with rising disposable incomes and investments in healthcare modernization, these factors create a supportive environment for sustained market growth across diverse patient populations.
Key Trends & Opportunities
Technological Advancements in Biologic and Next-Generation Therapies
Emerging biologic therapies, including stem-cell-based injections and advanced PRP formulations, are reshaping the competitive landscape. These treatments focus not only on symptom relief but also on repairing damaged tissues and slowing disease progression. With ongoing clinical trials and regulatory approvals, next-generation joint pain injections are expected to expand therapeutic options, especially for patients unresponsive to conventional treatments. Strategic collaborations between biotech firms and medical device companies further accelerate innovation. This trend creates opportunities for players to differentiate their portfolios and capture high-value segments within the growing regenerative medicine field.
- For instance, CartiHeal’s Agili-C™ implant, evaluated in a pivotal IDE trial of 251 patients, showed 80% responder rates in knee osteoarthritis at 24 months, outperforming microfracture techniques.
Growth Potential in Emerging Economies
Developing markets in Asia-Pacific, Latin America, and the Middle East present significant untapped opportunities. Rising urbanization, increasing life expectancy, and greater incidence of lifestyle-related joint disorders are fueling demand. At the same time, governments are investing in healthcare infrastructure and expanding insurance systems, making advanced therapies more accessible. Local players are also entering the market, providing cost-effective joint injection solutions that appeal to price-sensitive patients. This creates a dual opportunity: multinational companies can expand footprints through partnerships, while regional manufacturers can scale affordable alternatives. Collectively, these dynamics strengthen growth prospects in emerging economies.
Key Challenges
High Cost of Advanced Biologic and Regenerative Therapies
Despite growing demand, affordability remains a major barrier, particularly for biologic and regenerative injections like PRP and stem-cell therapies. These treatments are often priced significantly higher than conventional corticosteroid or hyaluronic acid injections, limiting accessibility for middle- and low-income populations. Insurance coverage is inconsistent, with many plans excluding advanced therapies, further restricting adoption. The high cost of research, clinical validation, and regulatory compliance also inflates pricing, preventing widespread availability. Unless pricing models and reimbursement frameworks evolve, adoption of next-generation injections may remain restricted to premium patient segments in developed markets.
Regulatory and Clinical Validation Challenges
Regulatory hurdles and limited long-term clinical evidence present another challenge in the joint pain injections market. While corticosteroid and hyaluronic acid injections are well established, newer options like PRP and stem-cell therapies face stricter scrutiny. Inconsistent guidelines across regions create uncertainty for manufacturers and healthcare providers. Additionally, the lack of large-scale, randomized clinical trials hinders broader acceptance among physicians and payers. Safety concerns and varying efficacy outcomes also contribute to hesitation in adoption. Addressing these challenges requires stronger clinical evidence, harmonized regulatory pathways, and transparent communication of therapeutic benefits to ensure trust and broader adoption.
Regional Analysis
North America
North America led the joint pain injections market in 2024 with a 40.9% share, valued at USD 1,424.70 million, up from USD 1,107.38 million in 2018. The region is projected to reach USD 2,553.23 million by 2032, registering a 7.6% CAGR. Strong adoption of corticosteroid and hyaluronic acid injections, robust healthcare infrastructure, and favorable reimbursement policies drive this dominance. The prevalence of osteoarthritis among the aging population further strengthens demand, while ongoing clinical trials for regenerative injections, including PRP and biologics, add to the region’s long-term growth potential.
Europe
Europe accounted for 24.1% of the global market in 2024, reaching USD 839.12 million, compared with USD 672.68 million in 2018. The market is expected to grow to USD 1,417.95 million by 2032 at a 6.8% CAGR. Growth is driven by an increasing elderly population, rising osteoarthritis prevalence, and wider access to viscosupplementation therapies. Countries like Germany, France, and the UK remain major markets due to established insurance systems. While regulatory approvals for regenerative injections are slower, strong clinical adoption of established corticosteroid injections sustains Europe’s competitive position in the global landscape.
Asia Pacific
Asia Pacific held 23.0% of the global market in 2024, valued at USD 800.00 million, rising from USD 586.12 million in 2018. The market is forecasted to nearly double to USD 1,600.85 million by 2032, expanding at the fastest regional CAGR of 9.1%. Rapid urbanization, increasing life expectancy, and higher incidences of joint disorders drive demand. Expanding healthcare infrastructure, coupled with rising medical tourism in countries like India and Thailand, supports adoption. Additionally, cost-effective manufacturing and growing acceptance of regenerative therapies position Asia Pacific as a high-growth region with significant long-term opportunities for both global and local players.
Latin America
Latin America contributed 5.4% of the global market in 2024, generating USD 188.16 million, compared with USD 146.33 million in 2018. By 2032, the market is anticipated to reach USD 309.35 million, growing at a 6.5% CAGR. Demand is supported by an expanding middle-class population, greater healthcare investments, and increasing awareness of joint pain management solutions. Brazil and Mexico remain key growth hubs, offering both private and public sector opportunities. However, limited reimbursement for advanced biologic injections remains a barrier, though rising uptake of corticosteroid therapies ensures consistent demand across the region.
Middle East
The Middle East represented 3.9% of the global market in 2024, valued at USD 134.50 million, rising from USD 109.88 million in 2018. The market is forecasted to reach USD 219.53 million by 2032, reflecting a 6.4% CAGR. Rising cases of lifestyle-related joint conditions, coupled with growing adoption of advanced orthopedic care in countries like Saudi Arabia and the UAE, support demand. Increasing investments in hospital infrastructure and the rise of medical tourism further drive market expansion. Despite higher costs of regenerative therapies, established corticosteroid and hyaluronic acid injections maintain steady adoption across the region.
Africa
Africa accounted for the smallest share at 2.8% in 2024, reaching USD 98.64 million, up from USD 57.62 million in 2018. By 2032, the market is projected to grow to USD 152.39 million, recording a 5.2% CAGR. Growth is driven by rising awareness of musculoskeletal disorders and gradual expansion of healthcare access. South Africa remains the largest contributor, followed by Nigeria and Egypt, where urban populations are increasingly adopting non-surgical pain management solutions. However, limited affordability and lack of insurance coverage for advanced biologics continue to hinder wider adoption, leaving corticosteroid injections as the primary treatment option.
Market Segmentations:
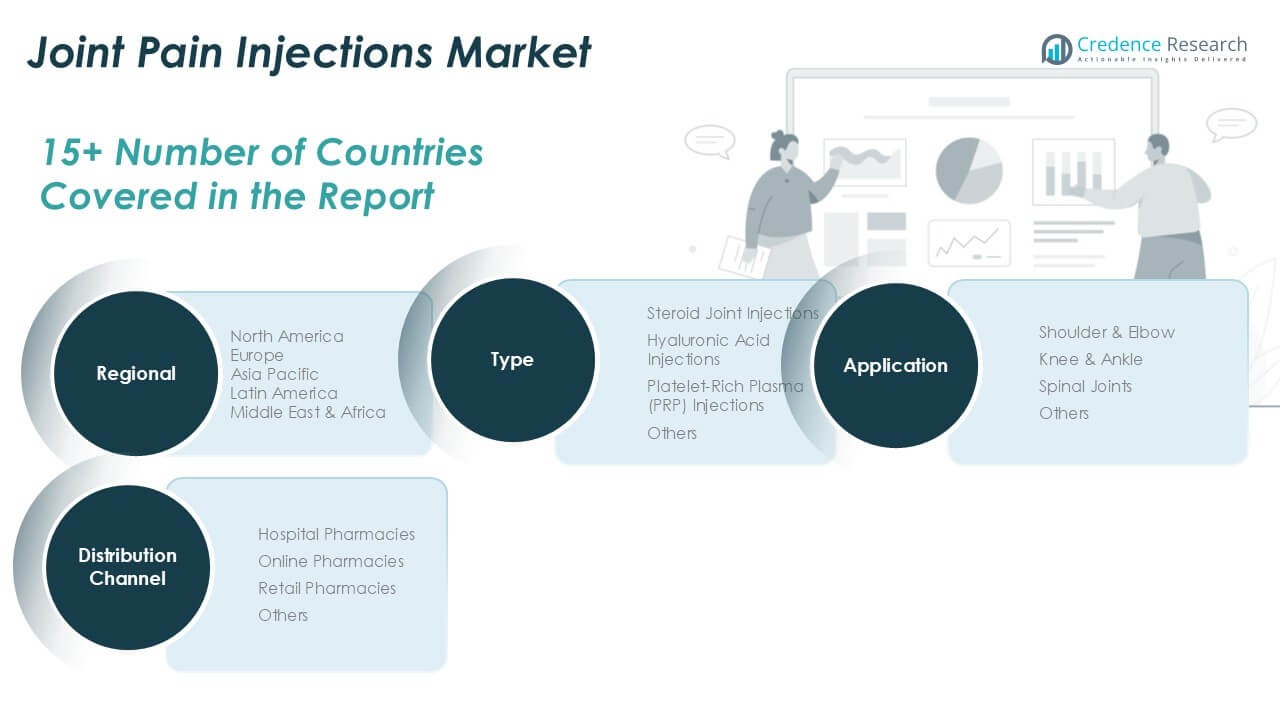
By Type
- Steroid Joint Injections
- Hyaluronic Acid Injections
- Platelet-Rich Plasma (PRP) Injections
- Others
By Application
- Shoulder & Elbow
- Knee & Ankle
- Spinal Joints
- Others
By Distribution Channel
- Hospital Pharmacies
- Online Pharmacies
- Retail Pharmacies
- Others
By Geography
- North America
- Europe
- Asia Pacific
- Latin America
- Middle East
- Africa
Competitive Landscape
The joint pain injections market is moderately consolidated, with leading players focusing on innovation, strategic collaborations, and geographic expansion to strengthen their positions. Key companies such as Anika Therapeutics, Arthrex, Bioventus, Pacira BioSciences (Flexion), Pfizer, Sanofi, Stryker, and Zimmer Biomet dominate through extensive product portfolios spanning corticosteroid, hyaluronic acid, and biologic injections. These players invest heavily in clinical research and regulatory approvals, particularly for platelet-rich plasma (PRP) and next-generation regenerative therapies, to address growing demand for minimally invasive solutions. Mid-sized companies like Emcyte, OrthogenRx, and Lifecore Biomedical compete by offering niche biologics and cost-effective viscosupplementation products, while Ferring B.V. strengthens its presence with global partnerships. Market competition is also shaped by pricing strategies, distribution networks, and reimbursement coverage, especially in North America and Europe. Emerging players in Asia-Pacific and Latin America focus on affordability, providing opportunities for regional expansion. Overall, innovation, clinical validation, and accessibility remain key competitive differentiators across the market.
Shape Your Report to Specific Countries or Regions & Enjoy 30% Off!
Key Player Analysis
Recent Developments
- In December 2023, Bioventus agreed to a nationwide contract with Aetna Medicare Advantage plans, wherein over 3 million Aetna Medicare Advantage plan members will have access to DUROLANE, single-injection hyaluronic acid (HA)-based joint-fluid treatment, to treat knee osteoarthritis (OA).
- In November 2022, Anika Therapeutics, Inc. announced that its product Cingal demonstrated positive results in phase III clinical trials and is planning to proceed further for the U.S. FDA approval.
- In March 2022, Sanofi collaborated with IGM Biosciences Inc. to develop, manufacture, and introduce potential therapeutics in the fields of immunology and inflammation.
- In January 2022, SEIKAGAKU CORPORATION announced the establishment of a new company in Canada, SEIKAGAKU NORTH AMERICA CORPORATION, with an aim to expand its geographical presence.
Report Coverage
The research report offers an in-depth analysis based on Type, Application, Distribution Channel and Geography. It details leading market players, providing an overview of their business, product offerings, investments, revenue streams, and key applications. Additionally, the report includes insights into the competitive environment, SWOT analysis, current market trends, as well as the primary drivers and constraints. Furthermore, it discusses various factors that have driven market expansion in recent years. The report also explores market dynamics, regulatory scenarios, and technological advancements that are shaping the industry. It assesses the impact of external factors and global economic changes on market growth. Lastly, it provides strategic recommendations for new entrants and established companies to navigate the complexities of the market.
Future Outlook
- The market will expand steadily with rising cases of osteoarthritis and joint disorders.
- Demand for minimally invasive treatments will increase over surgical alternatives.
- Platelet-rich plasma and biologic injections will gain wider clinical acceptance.
- Hyaluronic acid injections will remain important for knee osteoarthritis therapies.
- North America will continue to lead due to advanced healthcare and reimbursement.
- Asia Pacific will grow fastest, supported by medical tourism and infrastructure development.
- Online pharmacies will rise as a preferred channel for patient convenience.
- Regulatory clarity will shape adoption of next-generation regenerative therapies.
- Competition will intensify as global and regional players diversify portfolios.
- Affordability and broader insurance coverage will decide access in emerging markets.


