| REPORT ATTRIBUTE |
DETAILS |
| Historical Period |
2020-2023 |
| Base Year |
2024 |
| Forecast Period |
2025-2032 |
| Bridge Expansion Joints Market Size 2024 |
USD 1,548.48Million |
| Bridge Expansion Joints Market, CAGR |
6.13% |
| Bridge Expansion Joints Market Size 2032 |
USD 2,481.31 Million |
Market Overview:
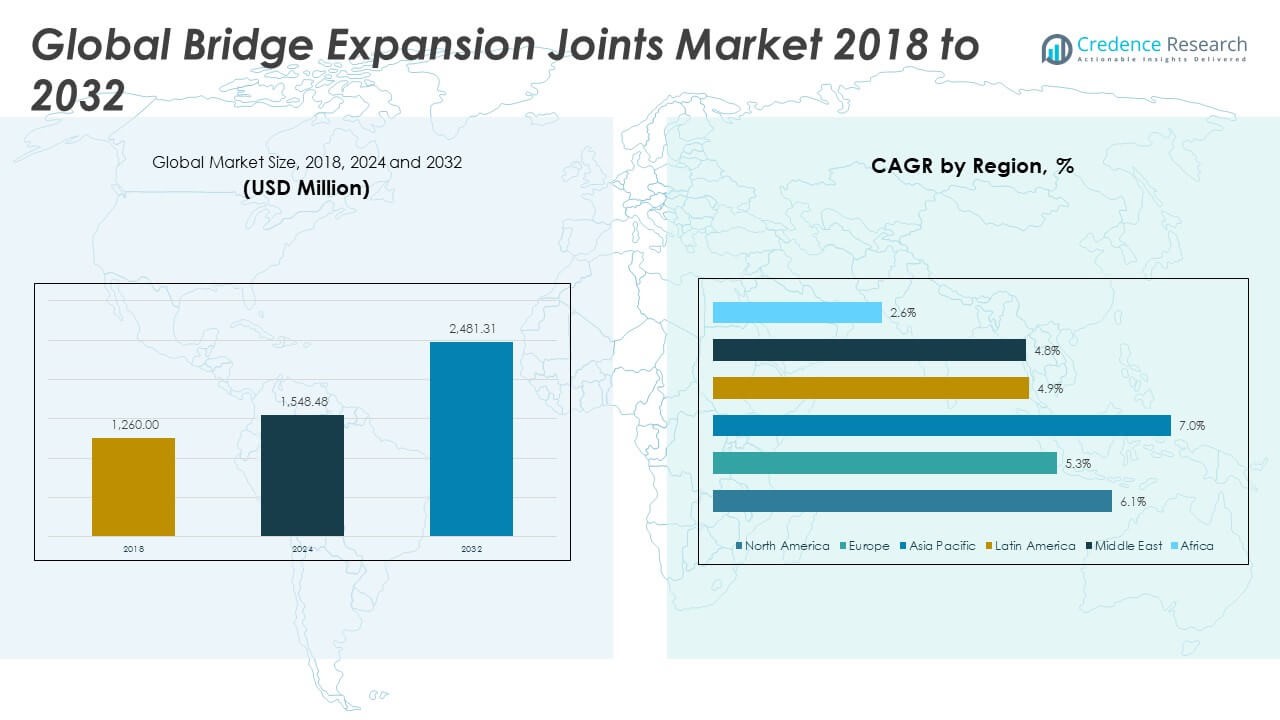
The Bridge Expansion Joints Market size was valued at USD 1,260.00 million in 2018 to USD 1,548.48 million in 2024 and is anticipated to reach USD 2,481.31 million by 2032, at a CAGR of 6.13% during the forecast period.
The Bridge Expansion Joints Market is primarily driven by the global expansion of transportation infrastructure, particularly roadways and railways. Rapid urbanization, especially in developing countries, is pushing governments to build new bridges and upgrade existing ones, which fuels consistent demand for high-performance expansion joints. Aging bridge infrastructure in developed regions further adds to replacement needs, making refurbishment projects a major growth area. Technological innovations in joint materials and configurations—such as elastomeric, modular, and strip seal joints—are gaining traction for their ability to withstand heavy traffic loads, seismic activity, and extreme temperatures. Moreover, sustainability and long-term durability are becoming procurement priorities, prompting the adoption of advanced corrosion-resistant materials like stainless steel and polymer composites. Regulatory standards for safety and load-bearing capacity are also increasing, compelling contractors and governments to invest in modernized, compliant joint solutions. These factors collectively position bridge expansion joints as critical components in infrastructure lifecycle planning.
Asia-Pacific dominates the Bridge Expansion Joints Market due to robust infrastructure development in countries like China, India, Indonesia, and Vietnam. Massive investments in expressways, metro rail systems, and long-span bridges are driving large-scale procurement of expansion joints. China, for instance, is undertaking several mega bridge projects under its Belt and Road Initiative, while India is expanding its national highway network, both contributing to strong market growth. In North America, aging infrastructure and the push for modernization under federal programs such as the U.S. Infrastructure Investment and Jobs Act are leading to widespread bridge rehabilitation, particularly across state and interstate highways. This is stimulating demand for durable, retrofit-compatible expansion joints. Europe is witnessing moderate yet steady growth, backed by stringent safety norms and urban renewal projects across countries like Germany, France, and the UK. Meanwhile, Latin America and the Middle East are emerging markets, benefiting from international infrastructure funding and cross-border connectivity projects.
Access crucial information at unmatched prices!
Request your sample report today & start making informed decisions powered by Credence Research Inc.!
Download Sample
Market Insights:
- The Bridge Expansion Joints Market was valued at USD 1,548.48 million in 2024 and is projected to reach USD 2,481.31 million by 2032, growing at a CAGR of 6.13%.
- Rapid urbanization and large-scale infrastructure development in countries like China and India are driving consistent demand for high-performance expansion joints.
- Aging bridges in North America and Europe require urgent rehabilitation, boosting demand for retrofit-compatible and long-lasting joint systems.
- Engineers are adopting modular, elastomeric, and polymer-based joints that meet seismic, thermal, and load-bearing standards for modern construction needs.
- High installation and maintenance costs in budget-constrained regions limit the adoption of advanced joint solutions, impacting project scope and quality.
- Lack of skilled labor and inconsistent regulatory standards across markets often compromise product performance and increase failure risks.
- Asia-Pacific leads global market share, while North America, Europe, and emerging regions like Latin America and the Middle East are witnessing steady to strong growth driven by ongoing investments in bridge infrastructure.
Market Drivers:
Surging Infrastructure Development Accelerates Global Demand
The Bridge Expansion Joints Market is experiencing strong momentum due to large-scale infrastructure development across emerging and developed economies. Governments are investing heavily in roadways, highways, and metro rail systems to improve connectivity and economic growth. Bridge construction is a central part of these projects, requiring high-quality expansion joints to accommodate structural movement and environmental stress. Projects such as China’s Belt and Road Initiative and India’s Bharatmala scheme are generating consistent demand. Expansion joints ensure durability and long-term service life of bridges in these high-traffic corridors. The rise in public-private partnerships further increases procurement volumes for bridge components, including joints.
- For example, modular expansion joints, such as Steelflex® Modular Expansion Joint Systems by D.S. Brown, can accommodate longitudinal bridge movements exceeding 2 meters while maintaining watertight integrity and fatigue resistance, crucial for projects like China’s Belt and Road Initiative and India’s Bharatmala scheme.
Aging Bridge Stock Creates Steady Retrofit Opportunities
Many regions, especially in North America and Europe, face aging infrastructure that requires urgent repair and rehabilitation. The Bridge Expansion Joints Market benefits from the need to replace outdated or damaged joints that compromise structural integrity. Governments are allocating significant budgets for maintenance programs, which prioritize safety and compliance. Frequent inspections and stricter regulatory norms increase demand for modern joint systems with better performance and longevity. Retrofit-friendly expansion joints support ease of installation and reduce operational downtime, which appeals to contractors and public agencies. This replacement cycle contributes significantly to market growth.
Evolving Construction Standards Drive Material Innovation
The market is influenced by evolving performance and regulatory standards in the construction industry. Engineers and contractors now prefer joints that meet seismic resilience, thermal flexibility, and load-bearing criteria. The Bridge Expansion Joints Market has responded with advanced solutions such as modular joints, strip seals, and polymer-based alternatives. These products offer improved fatigue resistance, corrosion protection, and maintenance efficiency. Material innovation also addresses sustainability targets by extending service life and reducing the frequency of replacements. Demand continues to grow for joints that balance compliance, cost-effectiveness, and long-term durability.
- For instance, recent modular joint designs by Mageba SA and others, specifically developed for the seismic-prone Asia-Pacific region, feature seismic fuse boxes able to accommodate up to ±400 mm longitudinal and ±100 mm transverse movement in a single unit, with lab-verified compliance to EN 1998-2 (Eurocode 8) seismic standards.
Urbanization and Traffic Density Boost Product Adoption
Rapid urbanization is increasing traffic density on city bridges and elevated highways, creating higher stress loads on structures. The Bridge Expansion Joints Market sees growing demand for systems that can absorb constant vibrations and heavy loads without failure. In densely populated regions, safety and operational efficiency become critical considerations for transportation planners. High-traffic bridges require expansion joints that minimize noise, prevent water leakage, and withstand variable climate conditions. Manufacturers are focusing on engineering solutions that match the complex load and movement profiles of modern bridge systems. This urban infrastructure challenge presents an ongoing growth opportunity for the market.
Market Trends:
Growing Preference for Modular Expansion Joint Systems in Complex Bridge Designs
Engineers are increasingly opting for modular expansion joints to address the challenges posed by longer spans and complex bridge geometries. These systems accommodate multi-directional movements, higher loads, and seismic activity, making them suitable for large-scale or multi-span structures. The Bridge Expansion Joints Market is shifting toward modular solutions due to their flexibility and adaptability in diverse construction environments. It helps simplify installation and ensures structural continuity across multiple lanes and deck sections. Advancements in modular joint technology also enable easier inspection and maintenance, reducing life cycle costs. This trend reflects a broader movement toward standardized, high-capacity solutions in modern bridge engineering.
Integration of Smart Sensors for Structural Health Monitoring
The integration of smart sensors into expansion joints is gaining traction, particularly in regions adopting digital infrastructure frameworks. These sensors monitor joint behavior in real time, capturing data on displacement, vibration, and temperature fluctuations. The Bridge Expansion Joints Market is gradually embracing this technology to enhance predictive maintenance and avoid unexpected failures. It supports asset management systems by providing actionable insights that improve safety and extend structural lifespan. The trend aligns with growing interest in smart city initiatives and IoT-enabled infrastructure monitoring. Developers and public agencies are exploring ways to embed intelligence into traditional bridge components for enhanced performance.
- For example, the Vibrating Wire Displacement Transducers used (e.g., by Geokon) maintain signal fidelity over distances of up to 3 kilometers without amplification, and are housed in easily installed enclosures (30cm x 30cm x 15cm)
Increased Adoption of Low-Noise and Vibration-Reducing Joint Solutions
Noise and vibration pollution from bridge expansion joints is becoming a growing concern, particularly in urban settings and residential areas. Manufacturers are responding by developing joint systems that offer quieter operation without compromising structural integrity. The Bridge Expansion Joints Market is seeing a shift toward elastomeric and hybrid joints with acoustic dampening properties. It enables smoother vehicular transitions while reducing discomfort for commuters and nearby residents. Municipal regulations and community feedback are accelerating the need for silent joint technologies in city bridge projects. This shift represents an effort to balance infrastructure function with environmental and social considerations.
Use of Custom-Engineered Joints for Architectural and Aesthetic Integration
Bridge designs are evolving to include not only structural performance but also visual appeal, especially in landmark or pedestrian bridges. Custom-engineered expansion joints now support aesthetic integration with varying surface materials, shapes, and colors. The Bridge Expansion Joints Market is responding to architect-driven demand by offering customizable joint covers and finishes. It enables better visual harmony between the joint system and the bridge deck, without compromising function. Urban planners and architects prioritize seamless design integration in high-visibility infrastructure. This trend reflects a growing intersection of structural engineering and architectural design in bridge construction.
- For example, Construction Specialties offers made-to-order joint covers that match the bridge’s surface material, profile, and color scheme. Their systems can accommodate widths up to approximately 1.5 meters to meet unique structural design needs.
Market Challenges Analysis:
High Installation and Maintenance Costs Limit Adoption in Budget-Constrained Projects
Bridge expansion joints involve substantial upfront and lifecycle costs due to material requirements, engineering precision, and labor-intensive installation. In many developing economies, limited public infrastructure budgets restrict the ability to invest in premium joint systems. The Bridge Expansion Joints Market often faces procurement delays or scope reductions in such environments, where cost takes priority over performance. It becomes challenging for contractors to justify high-end modular or seismic joints when budgets favor basic or temporary solutions. Maintenance costs further add to the burden, especially when joints are installed in difficult-to-access locations or extreme climates. These financial pressures discourage timely replacement or upgrades, raising long-term safety and operational risks.
Lack of Standardization and Skilled Workforce Affects Product Performance
Variations in bridge design codes, material standards, and climate conditions across regions create inconsistencies in joint specifications. Manufacturers must frequently customize solutions, which leads to longer lead times, higher production costs, and increased complexity in logistics. The Bridge Expansion Joints Market faces setbacks when untrained personnel install joints improperly or use incompatible materials. It undermines product lifespan and increases failure risk under load or temperature shifts. In some markets, the shortage of experienced installation teams or certified inspectors delays commissioning and impacts bridge durability. This gap between product design and field execution continues to pose a serious challenge to market reliability and reputation.
Market Opportunities:
Expansion of Smart Infrastructure Unlocks New Product Potential
Smart infrastructure initiatives are creating a pathway for advanced bridge components that integrate digital monitoring and predictive maintenance. Expansion joints embedded with sensors can deliver real-time data on stress, movement, and wear, supporting safer and more efficient asset management. The Bridge Expansion Joints Market can capitalize on this shift by aligning its offerings with smart city frameworks. It allows governments and contractors to improve inspection cycles, reduce manual intervention, and extend structural life. Growing demand for resilient infrastructure in seismic or high-traffic zones strengthens the case for such intelligent systems. This creates a significant opportunity for manufacturers that invest in sensor-enabled, data-capable joint technologies.
Urban Redevelopment and Mega Projects Drive Long-Term Demand
Rising investments in urban redevelopment and large-scale transportation projects open new avenues for expansion joint applications. Governments are prioritizing long-span bridges, elevated corridors, and multi-level interchanges, all requiring high-performance joint systems. The Bridge Expansion Joints Market stands to benefit from this surge in infrastructure modernization. It can offer tailored solutions that meet evolving architectural, environmental, and structural requirements. These mega projects demand products with long service life, reduced maintenance, and adaptability to complex designs. The scale and diversity of such developments provide consistent and long-term growth potential.
Market Segmentation Analysis:
The Bridge Expansion Joints Market is segmented
By material type into steel, rubber, and polymer concrete. Steel expansion joints hold the largest revenue share due to their superior strength, load-bearing capacity, and suitability for heavy-duty bridges and high-traffic corridors. Rubber joints are widely used in short-span and secondary bridges for their flexibility, cost efficiency, and vibration-damping properties. Polymer concrete joints are gaining traction in specialized applications where corrosion resistance and minimal maintenance are critical, particularly in coastal or chemically exposed environments. This material diversification supports varying performance and budget requirements across regions and project scales.
- For example, D.S. Brown’s Steelflex® Elastomeric Joints use chloroprene rubber with steel reinforcement to absorb movements up to ±80 mm, offering a continuous, vibration-dampening riding surface. They are suited for short-span bridges and have been installed on high-traffic routes like Florida’s I-95 Interchange.
By movement capacity, the market is divided into small, medium, and large movement segments. Small movement joints are common in pedestrian and short-span bridges where structural shifts are minimal. Medium movement joints dominate in standard roadway and urban bridges that require moderate flexibility under dynamic loads. Large movement joints serve long-span bridges and seismic zones, offering multi-directional flexibility and high expansion tolerance. The Bridge Expansion Joints Market continues to align product development with evolving infrastructure demands across each segment.
- For example, Mageba’s TENSA‑GRIP RS single-seal joints accommodate movements of up to 80 mm, with the RS‑LS variant extending capacity to 100 mm thanks to sinusoidal plates. These modular steel joints feature robust edge profiles and replaceable elastomeric seals, ensuring durability and watertight performance in heavy-traffic bridge applications.

Segments
By Material Type:
- Steel
- Rubber
- Polymer Concrete
By Movement Capacity:
- Small Movement
- Medium Movement
- Large Movement
By Region:
- North America
- Europe
- Asia Pacific
- Latin America
- Middle East & Africa
Regional Analysis:
North America
The North America Bridge Expansion Joints Market size was valued at USD 385.06 million in 2018 to USD 466.39 million in 2024 and is anticipated to reach USD 746.13 million by 2032, at a CAGR of 6.1% during the forecast period. North America accounts for nearly 22% of the global market share, driven by widespread bridge rehabilitation and infrastructure modernization efforts. The U.S. leads regional demand, supported by federal programs targeting aging transportation networks and structurally deficient bridges. It benefits from well-established construction standards and high adoption of modular and seismic-resistant expansion joints. Growing investment in smart infrastructure is also encouraging integration of sensor-equipped systems. Contractors in the region prioritize long-term durability and regulatory compliance, increasing demand for premium joint solutions. The Bridge Expansion Joints Market continues to expand in North America due to a strong retrofit cycle and sustained public infrastructure funding.
Europe
The Europe Bridge Expansion Joints Market size was valued at USD 296.86 million in 2018 to USD 348.98 million in 2024 and is anticipated to reach USD 524.43 million by 2032, at a CAGR of 5.3% during the forecast period. Europe contributes around 17% of the global market, with steady growth supported by bridge upgrades, tunnel expansions, and urban redevelopment. Countries like Germany, France, and the UK maintain consistent infrastructure investment focused on safety, noise control, and environmental performance. It reflects a mature regulatory framework, where performance standards and lifecycle planning guide procurement decisions. Increasing use of low-noise and corrosion-resistant joints is notable in residential and urban projects. Sustainability targets are pushing adoption of long-lasting, low-maintenance solutions. The Bridge Expansion Joints Market benefits from these evolving construction trends across both new and retrofit applications.
Asia Pacific
The Asia Pacific Bridge Expansion Joints Market size was valued at USD 451.08 million in 2018 to USD 571.15 million in 2024 and is anticipated to reach USD 980.86 million by 2032, at a CAGR of 7.0% during the forecast period. Asia Pacific holds the largest share globally at approximately 32%, driven by extensive infrastructure development in China, India, and Southeast Asia. Regional governments are prioritizing mega bridge and expressway projects under economic growth and connectivity agendas. It experiences high demand for cost-effective, durable joints that support extreme weather and seismic conditions. Urbanization and rapid industrialization continue to fuel demand for elevated corridors and smart transport networks. The Bridge Expansion Joints Market in this region benefits from high construction volumes and growing awareness of long-term infrastructure integrity.
Latin America
The Latin America Bridge Expansion Joints Market size was valued at USD 61.61 million in 2018 to USD 74.78 million in 2024 and is anticipated to reach USD 108.61 million by 2032, at a CAGR of 4.9% during the forecast period. Latin America holds around 4% of the global share, with growth driven by roadway development and interregional bridge projects. Brazil and Mexico lead in adoption, with efforts to improve transportation links and reduce congestion. It faces challenges related to budget limitations and inconsistent maintenance, which affect project timelines and joint quality. Government initiatives and foreign investment are gradually improving access to high-performance components. Urban growth in select metro areas increases the need for reliable expansion joints in elevated structures. The Bridge Expansion Joints Market in this region is expected to expand steadily with improved regulatory frameworks.
Middle East
The Middle East Bridge Expansion Joints Market size was valued at USD 49.01 million in 2018 to USD 56.51 million in 2024 and is anticipated to reach USD 81.90 million by 2032, at a CAGR of 4.8% during the forecast period. The region accounts for nearly 3% of the global market, with growth centered on large-scale infrastructure and smart city initiatives. Countries like the UAE and Saudi Arabia are investing in iconic bridges, causeways, and elevated roadways to support tourism and logistics. It requires joints that perform under high temperatures and withstand sand abrasion. Rising focus on premium infrastructure and architectural aesthetics also drives demand for custom-engineered solutions. The Bridge Expansion Joints Market in the Middle East benefits from strategic urban planning and strong project pipelines.
Africa
The Africa Bridge Expansion Joints Market size was valued at USD 16.38 million in 2018 to USD 30.67 million in 2024 and is anticipated to reach USD 39.38 million by 2032, at a CAGR of 2.6% during the forecast period. Africa currently contributes less than 2% of global revenue but holds long-term growth potential. Economic development and cross-border trade agreements are increasing investment in regional road networks and transport corridors. It faces limitations related to product availability, local manufacturing capacity, and workforce training. However, international partnerships and donor-backed infrastructure projects are improving access to modern bridge technologies. Demand is growing in Nigeria, Kenya, and South Africa for durable, low-cost expansion joints. The Bridge Expansion Joints Market is expected to gain momentum as infrastructure funding and institutional capacity expand.
Shape Your Report to Specific Countries or Regions & Enjoy 30% Off!
Key Player Analysis:
- Watson Bowman Acme (A BASF Company)
- Mageba SA
- RJ Watson, Inc.
- Metal Engineering & Treatment Co. Pvt. Ltd.
- Canam Group Inc.
- Ekspan
- Freyssinet
- Granor Rubber & Engineering
- Gumba GmbH & Co. KG
- KantaFlex Pvt. Ltd.
Competitive Analysis:
The Bridge Expansion Joints Market is moderately fragmented, with several global and regional players competing on product durability, customization, and technological innovation. Key companies such as Mageba SA, Watson Bowman Acme Corp. (BASF), Trelleborg AB, and D.S. Brown Company hold strong positions through advanced material offerings and broad project portfolios. It rewards firms that invest in R&D to develop joints with enhanced load capacity, corrosion resistance, and noise control. Local manufacturers compete by offering cost-effective solutions for standard applications, especially in price-sensitive regions. Strategic partnerships with infrastructure developers and governments are expanding market access. The Bridge Expansion Joints Market is witnessing rising competition from companies that integrate smart monitoring features or offer modular systems for faster installation. Competitive differentiation depends on meeting diverse regional standards and addressing lifecycle cost expectations, which influence procurement decisions in both new construction and retrofitting segments.
Recent Developments:
- In July 2025, the Washington State Department of Transportation began replacing bridge expansion joints along westbound I‑90 in Issaquah. Contractor crews will close the roadway to one lane over up to ten weekends, performing joint replacements alongside pavement and waterproofing work on five bridges. The project timeline spans from late July 2025 through spring 2026.
Market Concentration & Characteristics:
The Bridge Expansion Joints Market exhibits moderate market concentration, with a mix of global leaders and regional specialists catering to diverse project requirements. It features a blend of standardized and custom-engineered products, shaped by regional regulations, environmental conditions, and project scale. Major players focus on high-performance systems that offer long service life, while regional manufacturers often address cost-sensitive demand with basic configurations. The market favors companies with strong technical expertise, supply chain reliability, and after-sales support. It is also characterized by long project cycles, strict compliance requirements, and a growing shift toward modular and smart-enabled joint systems. Demand varies across regions, driven by infrastructure age, urbanization rates, and public investment priorities.
Report Coverage:
The research report offers an in-depth analysis based on Material Type and Movement Capacity. It details leading market players, providing an overview of their business, product offerings, investments, revenue streams, and key applications. Additionally, the report includes insights into the competitive environment, SWOT analysis, current market trends, as well as the primary drivers and constraints. Furthermore, it discusses various factors that have driven market expansion in recent years. The report also explores market dynamics, regulatory scenarios, and technological advancements that are shaping the industry. It assesses the impact of external factors and global economic changes on market growth. Lastly, it provides strategic recommendations for new entrants and established companies to navigate the complexities of the market.
Future Outlook:
- Rising investments in transportation infrastructure will continue to drive demand for advanced expansion joint systems.
- Increasing focus on seismic resilience will promote adoption of modular and multi-directional joint designs.
- Integration of smart sensors into joints will expand opportunities in predictive maintenance and structural health monitoring.
- Urbanization and smart city projects will boost installation in elevated corridors and high-traffic flyovers.
- Demand for noise- and vibration-reducing joints will grow in residential and urban bridge applications.
- Expansion of public-private partnerships will create steady procurement pipelines for large infrastructure projects.
- Innovations in corrosion-resistant and sustainable materials will improve lifecycle performance.
- Retrofit and rehabilitation projects will contribute significantly to long-term market revenue.
- Emerging markets in Asia, the Middle East, and Africa will present strong growth potential due to rising infrastructure spending.
- Regulatory emphasis on safety and durability will drive technological upgrades across product lines.


