
Prosthetic Joint Infections Market: USD 742.6 million in 2025, Driven by Rising Joint Replacement Volumes
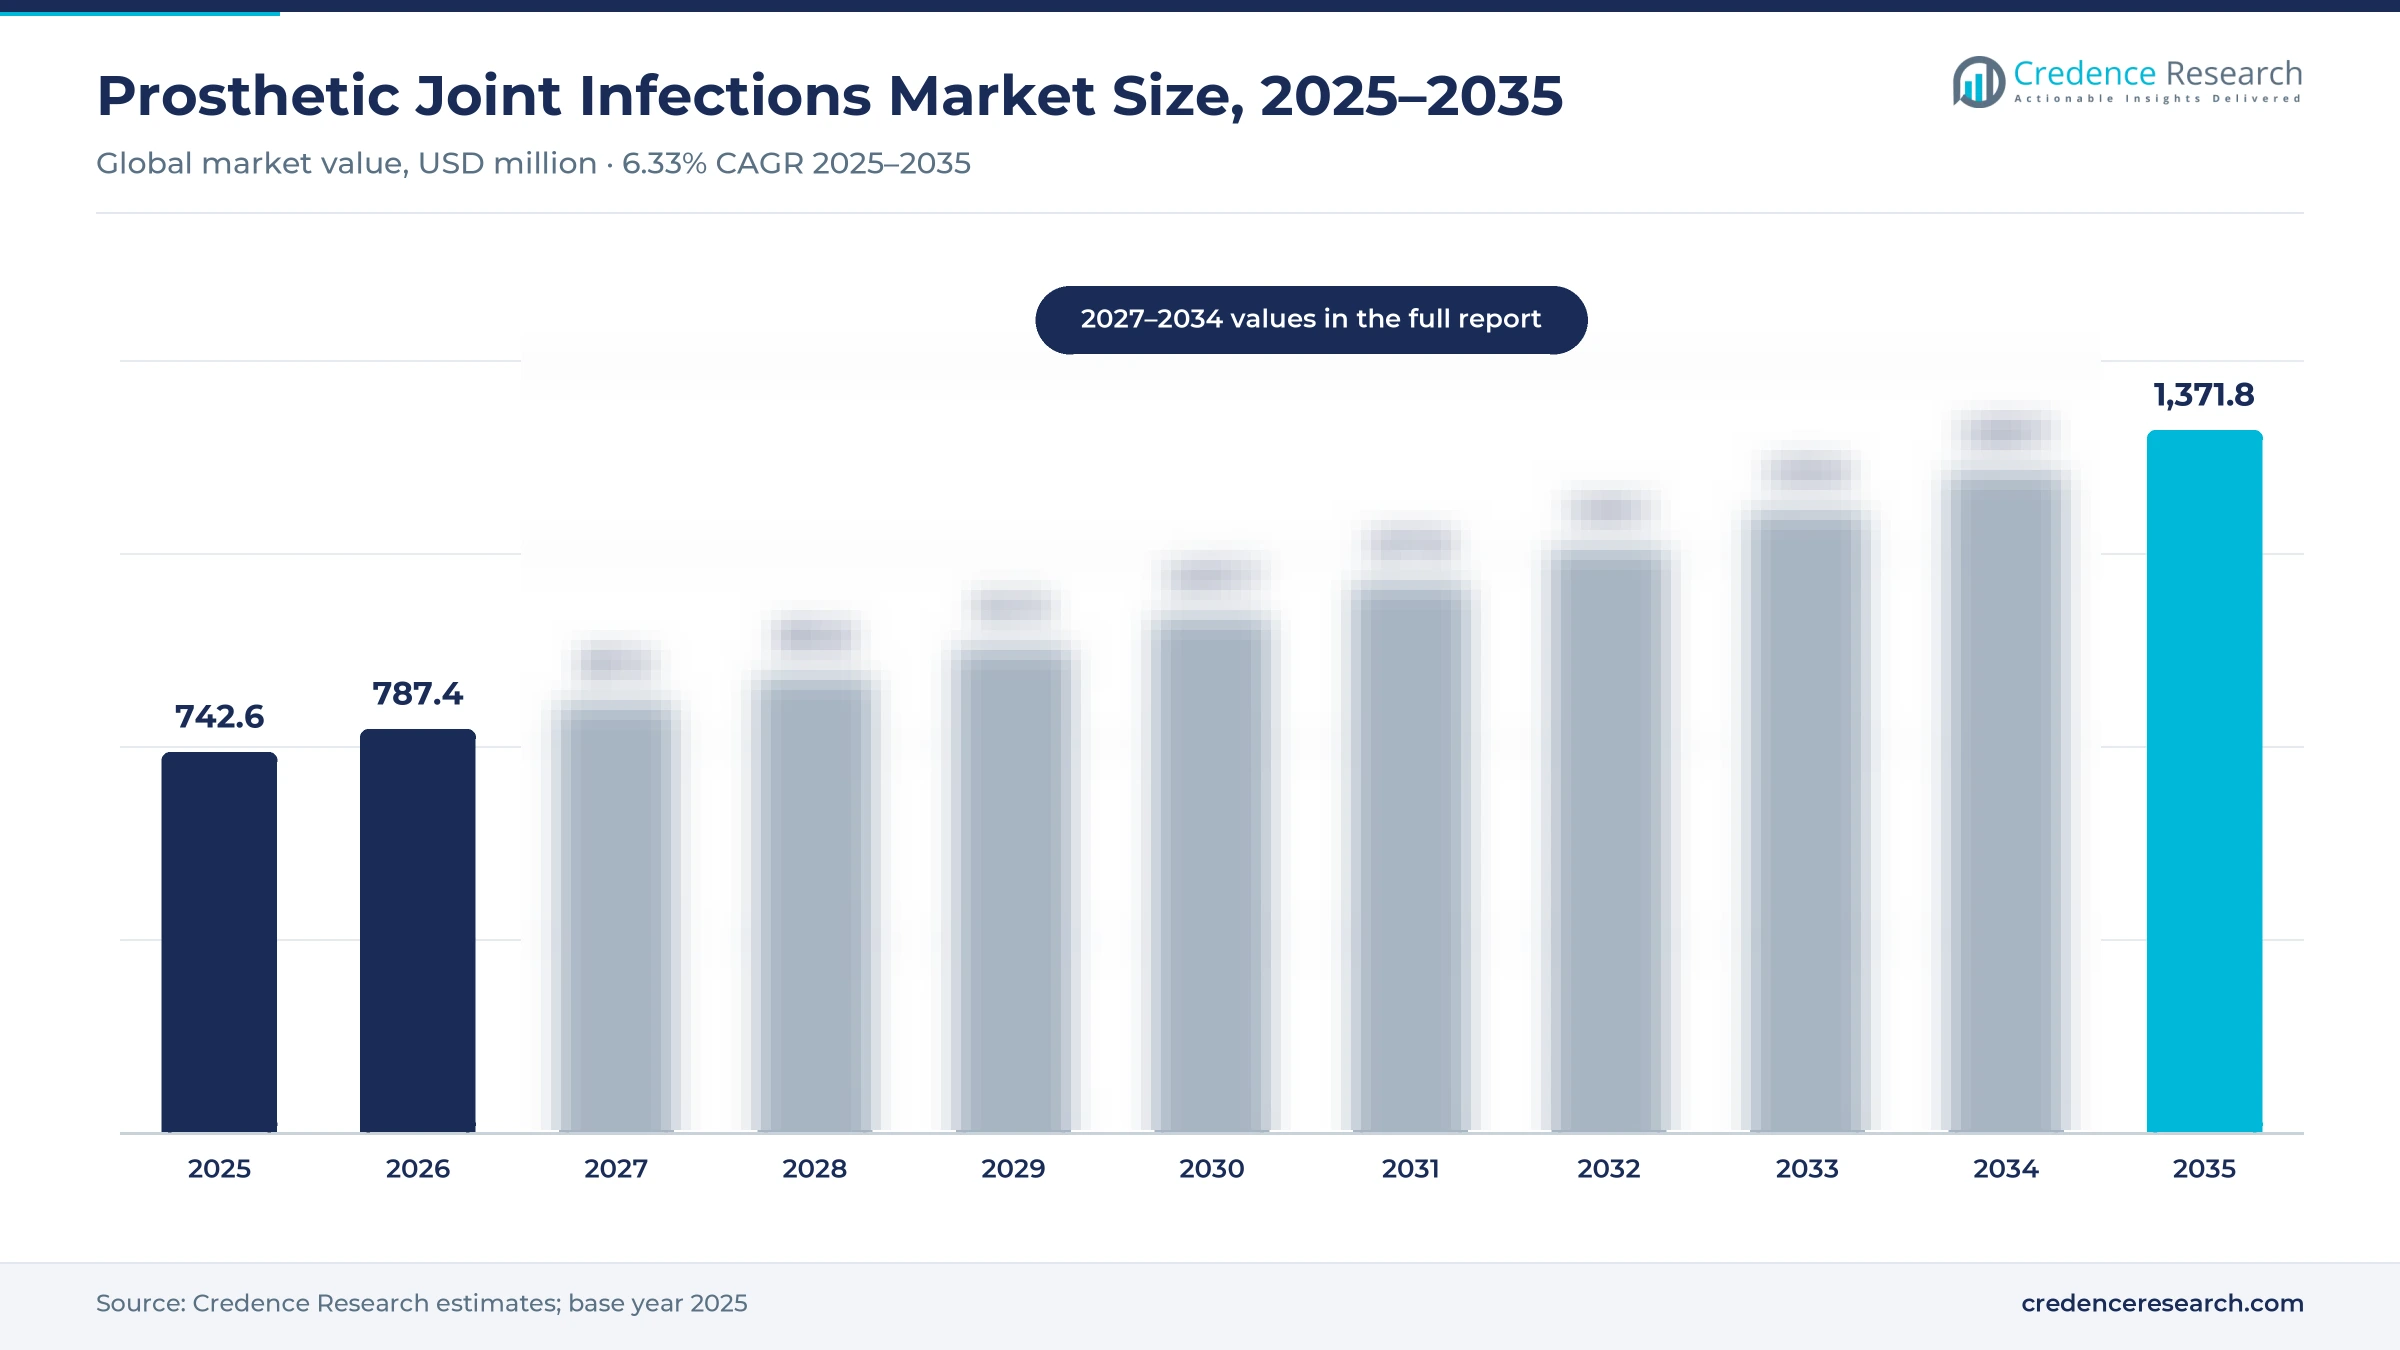
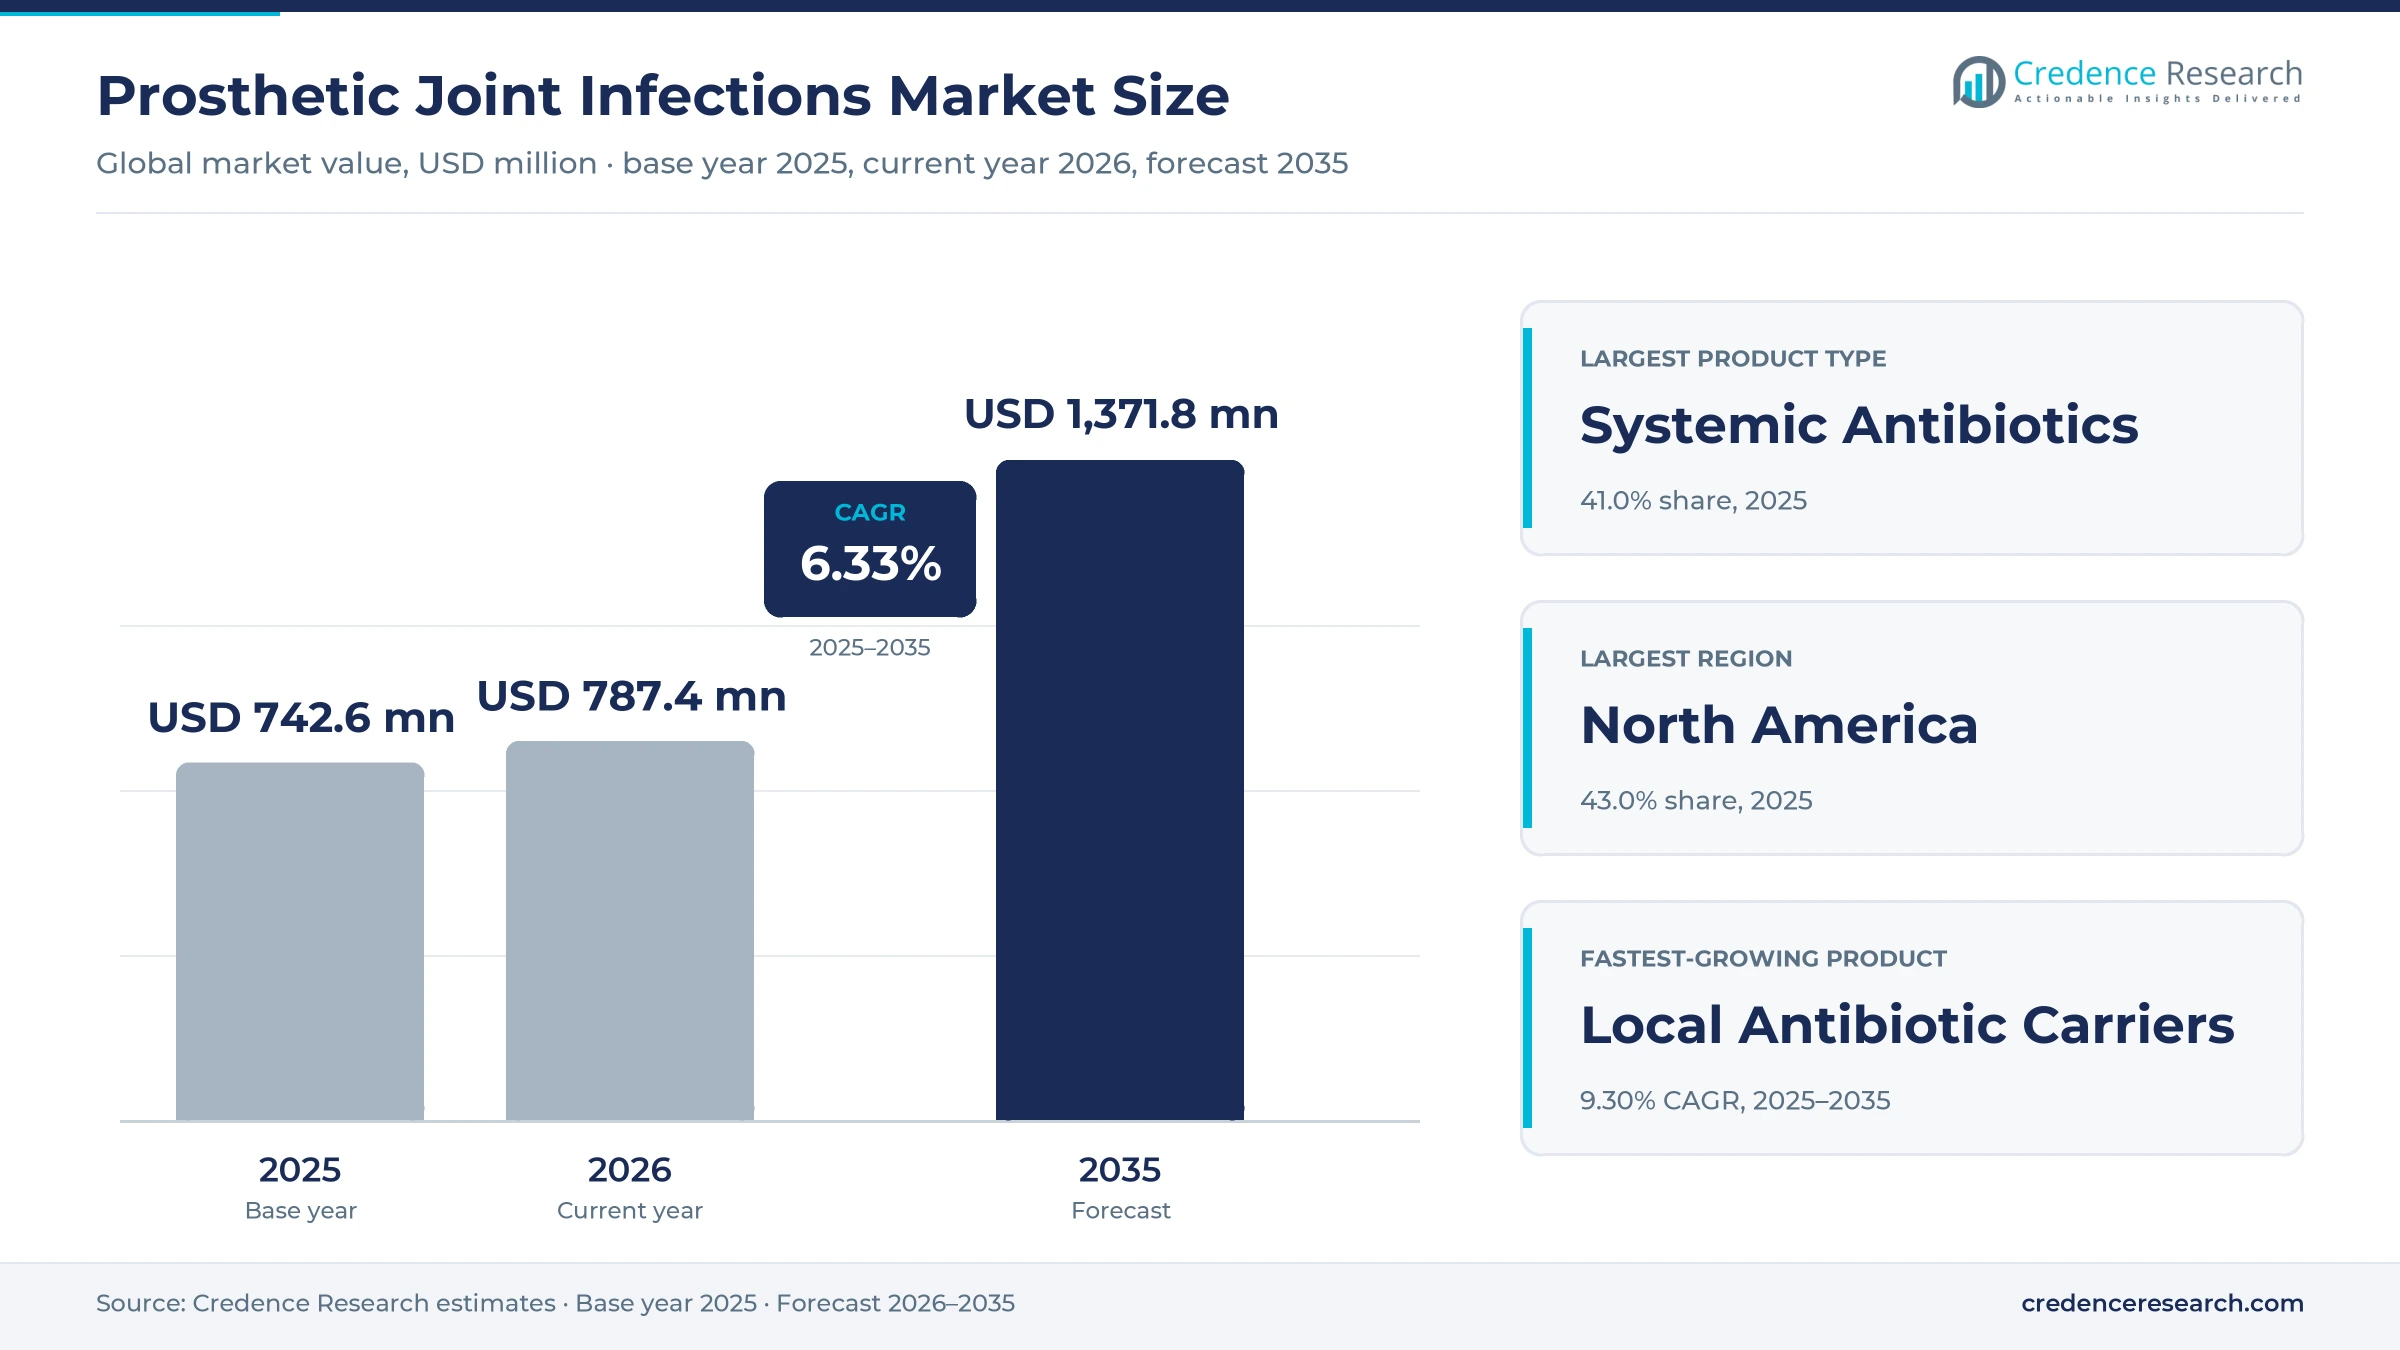
Hospitals and payers worldwide spent USD 742.6 million in 2025 on the products used to diagnose and treat infected joint implants, which is how we size the market for prosthetic joint infections, or PJI. Ageing patients and a growing stock of artificial hips and knees lift that to USD 1,371.8 million by 2035, a CAGR of 6.33%, with USD 787.4 million in 2026, the current year.
Our central view: PJI is rare per operation but costly per case, and the pool of people living with an artificial joint grows every year. A US national inpatient analysis of hip and knee PJI found that infection rates and cost per case stayed broadly flat from 2002 to 2017, so spending rises mainly with the number of joint replacements. That makes the market steady, with faster growth coming from better diagnostics and local antibiotic delivery.
Every figure here is our own estimate. We built it from joint replacement volumes, published infection rates and treatment pathways, and the disclosures of device and drug makers; no third-party market study went into it.
Which products and services are in scope?
We count the products used to diagnose and treat infection around a joint implant, valued at the price paid by hospitals and payers. We include:
- Systemic antibiotic therapies given for PJI, a 41.0% share of 2025 value.
- Antibiotic-loaded bone cement and temporary spacers used in staged revision, a 27.0% share.
- Diagnostic tests, such as synovial fluid biomarkers, cultures and molecular panels, a 14.0% share.
- Local antibiotic carriers, a 10.0% share, and irrigation and antiseptic solutions, a 8.0% share.
We leave out:
- Revision implants, which sit in the orthopedic implants market, and surgeon, hospital stay and rehabilitation costs.
- Products used only to prevent infection in routine primary surgery, which we cover under surgical site infection control.
Report Attributes
| Attribute | Details |
|---|---|
| Market size (2025) | USD 742.6 million |
| Market size (2026) | USD 787.4 million |
| Market size (2035) | USD 1,371.8 million |
| CAGR (2025–2035) | 6.33% |
| Base year | 2025 |
| Historical period | 2018–2024 |
| Forecast period | 2026–2035 |
| Largest product type | Systemic Antibiotic Therapies (41.0%) |
| Fastest-growing product type | Local Antibiotic Carriers (9.30% CAGR) |
| Largest joint | Knee (55.0%) |
| Largest region | North America (43.0%) |
| Fastest-growing region | Asia Pacific (8.75% CAGR) |
| Segments covered | Product Type, Joint, Region |
How did we size the market?
We used three lenses. First, an episode build: joint replacement volumes by country, times published infection rates, times the products used in each treatment pathway. Second, a spending check against national inpatient cost studies. Third, a supplier check against the orthopaedic and anti-infective sales that listed makers disclose. The full report sets out the cases, prices and assumptions behind each segment and region.
Prosthetic Joint Infections Market Insights
- The prosthetic joint infections market was USD 742.6 million in 2025; we forecast USD 1,371.8 million by 2035, a 6.33% CAGR.
- We estimate the market at USD 787.4 million in 2026, the current year.
- Systemic antibiotic therapies hold a 41.0% share; local antibiotic carriers grow fastest at 9.30% a year.
- Knee infections hold a 55.0% share of 2025 value.
- North America holds a 43.0% share of 2025 value.
- Asia Pacific is the fastest-growing region at 8.75% a year.
- Zimmer Biomet won FDA Breakthrough Device Designation for an iodine-treated hip system in October 2025.
Antibiotics and Spacers Hold the Value, Diagnostics and Local Carriers Grow Fastest
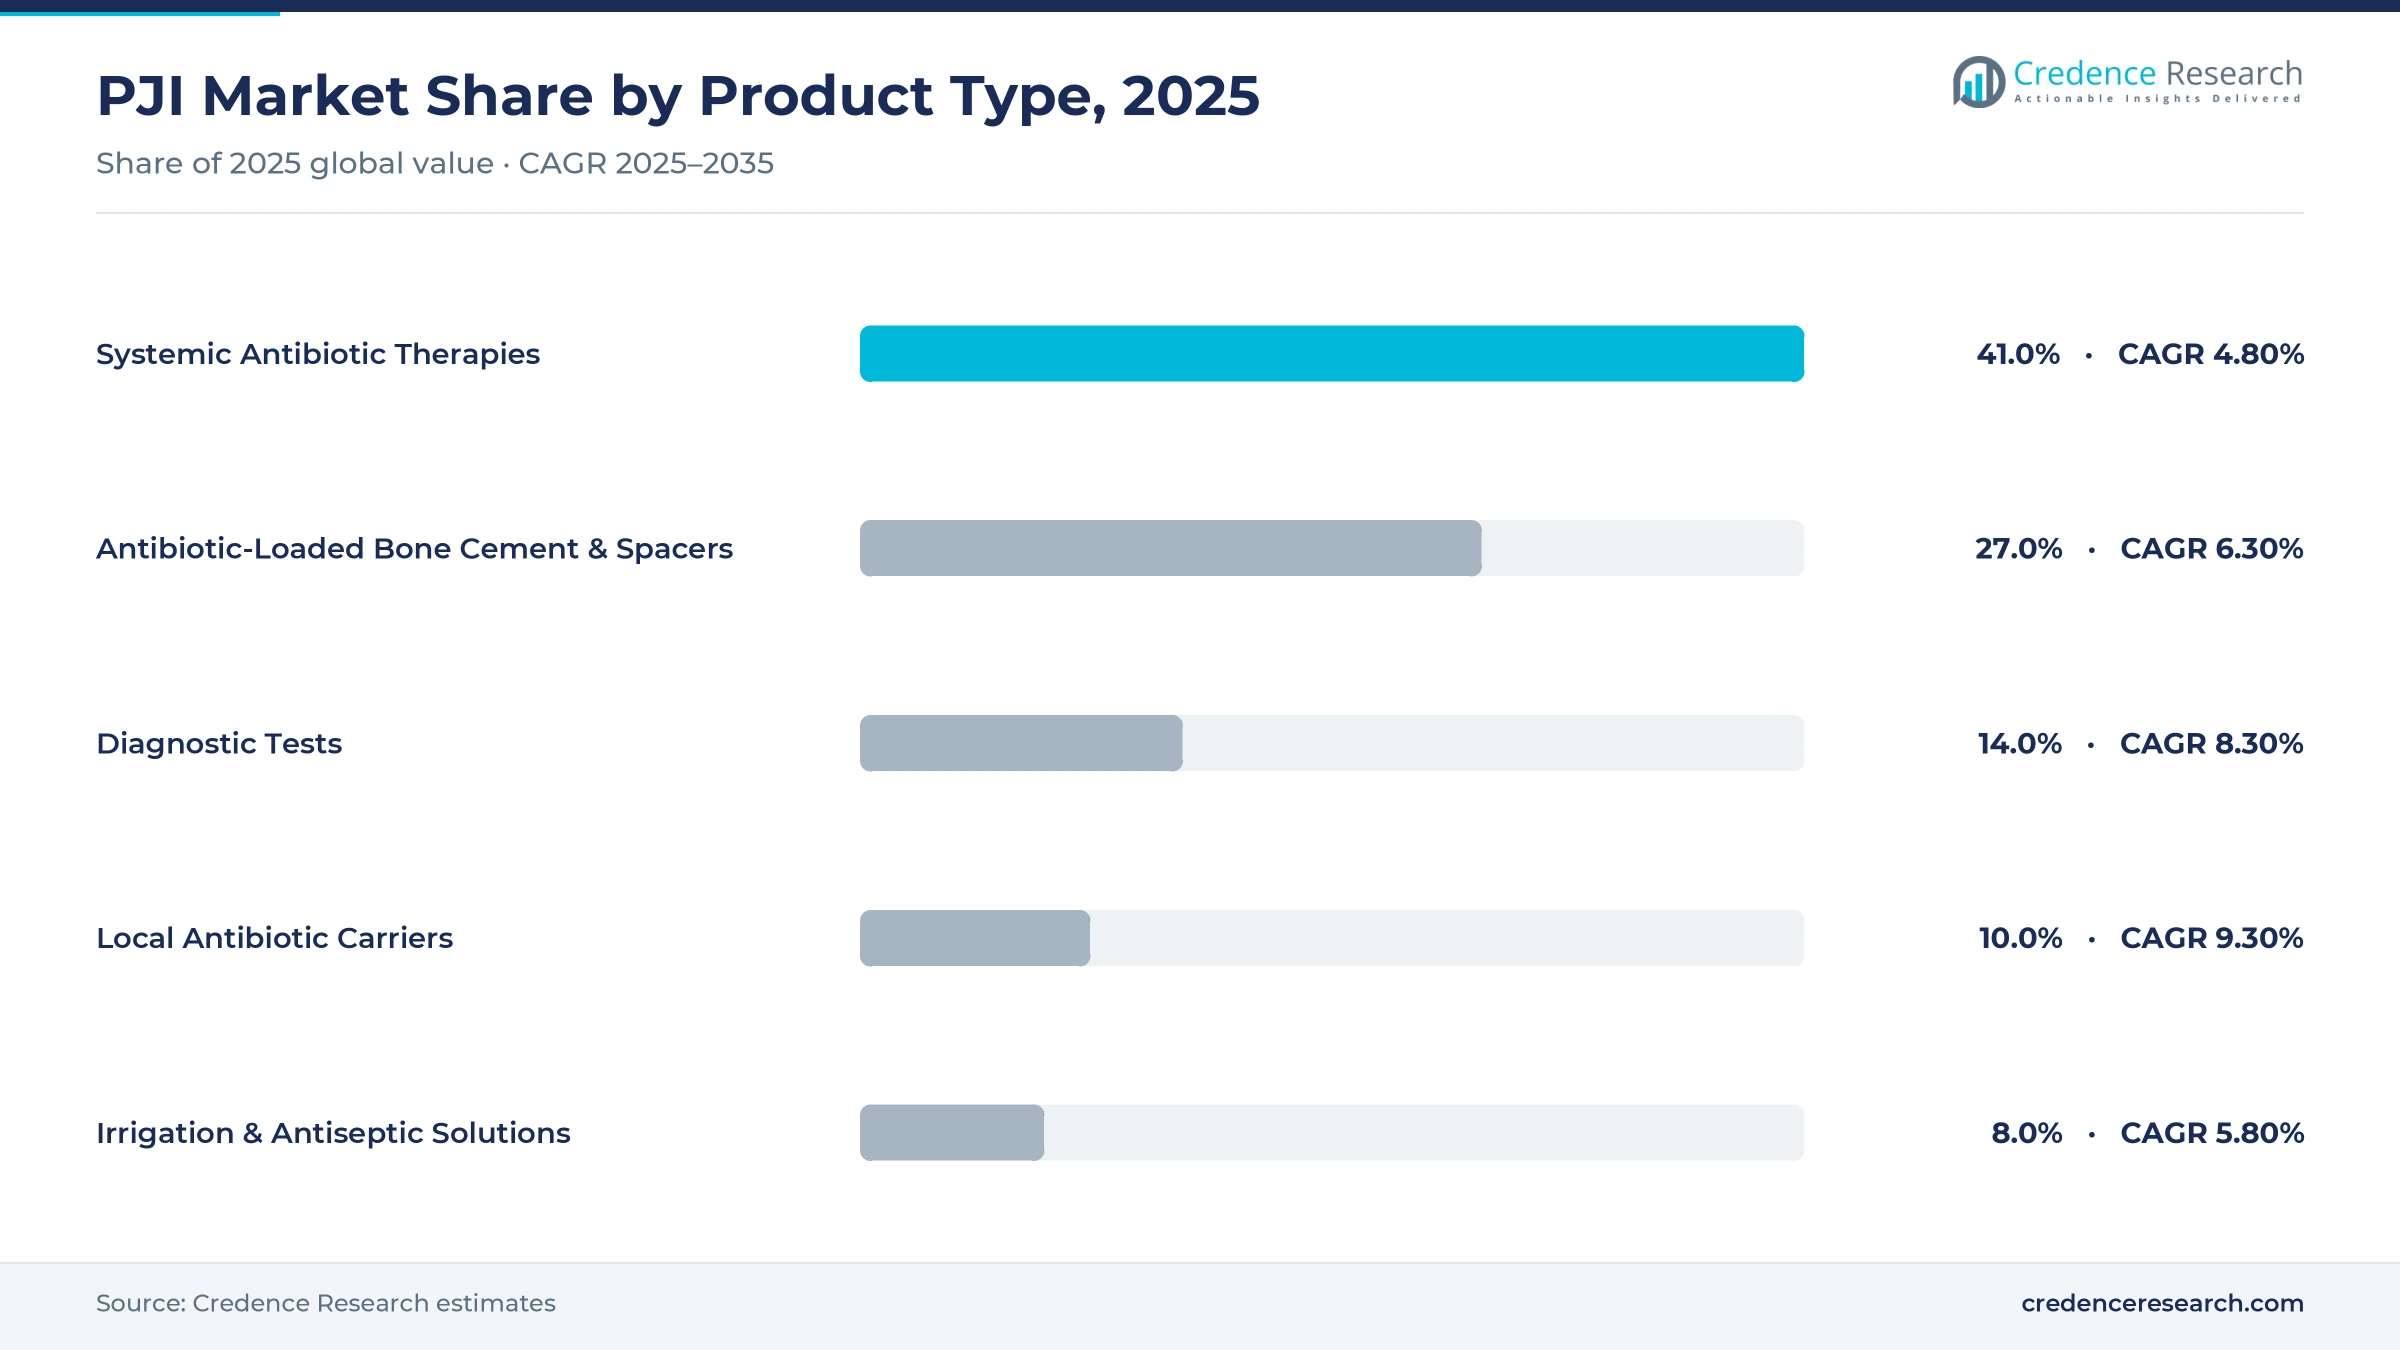
Systemic Antibiotic Therapies is the largest product type, with a 41.0% share of 2025 value. Local Antibiotic Carriers is the fastest-growing at 9.30% a year.
| Product Type | Share 2025 | CAGR 2025–2035 |
|---|---|---|
| Systemic Antibiotic Therapies | 41.0% | 4.80% |
| Antibiotic-Loaded Bone Cement & Spacers | 27.0% | 6.30% |
| Diagnostic Tests | 14.0% | 8.30% |
| Local Antibiotic Carriers | 10.0% | 9.30% |
| Irrigation & Antiseptic Solutions | 8.0% | 5.80% |
Why do systemic antibiotics lead?
Almost every PJI patient receives weeks of intravenous and then oral antibiotics, whatever the surgical approach. Systemic therapies hold a 41.0% share and grow at 4.80% a year, slower than the market, as many drugs are generic.
How large is the spacer and cement segment?
Antibiotic-loaded bone cement and spacers hold a 27.0% share and grow at 6.30% a year. Pre-formed spacers with gentamicin or vancomycin save time in theatre and are gaining over hand-made spacers.
Where do diagnostics, carriers and irrigation fit?
Diagnostic tests hold a 14.0% share and grow at 8.30% a year. Local antibiotic carriers hold 10.0% and grow at 9.30%. Irrigation and antiseptic solutions, used in debridement, hold 8.0% and grow at 5.80% a year.
Which joints account for the most value?
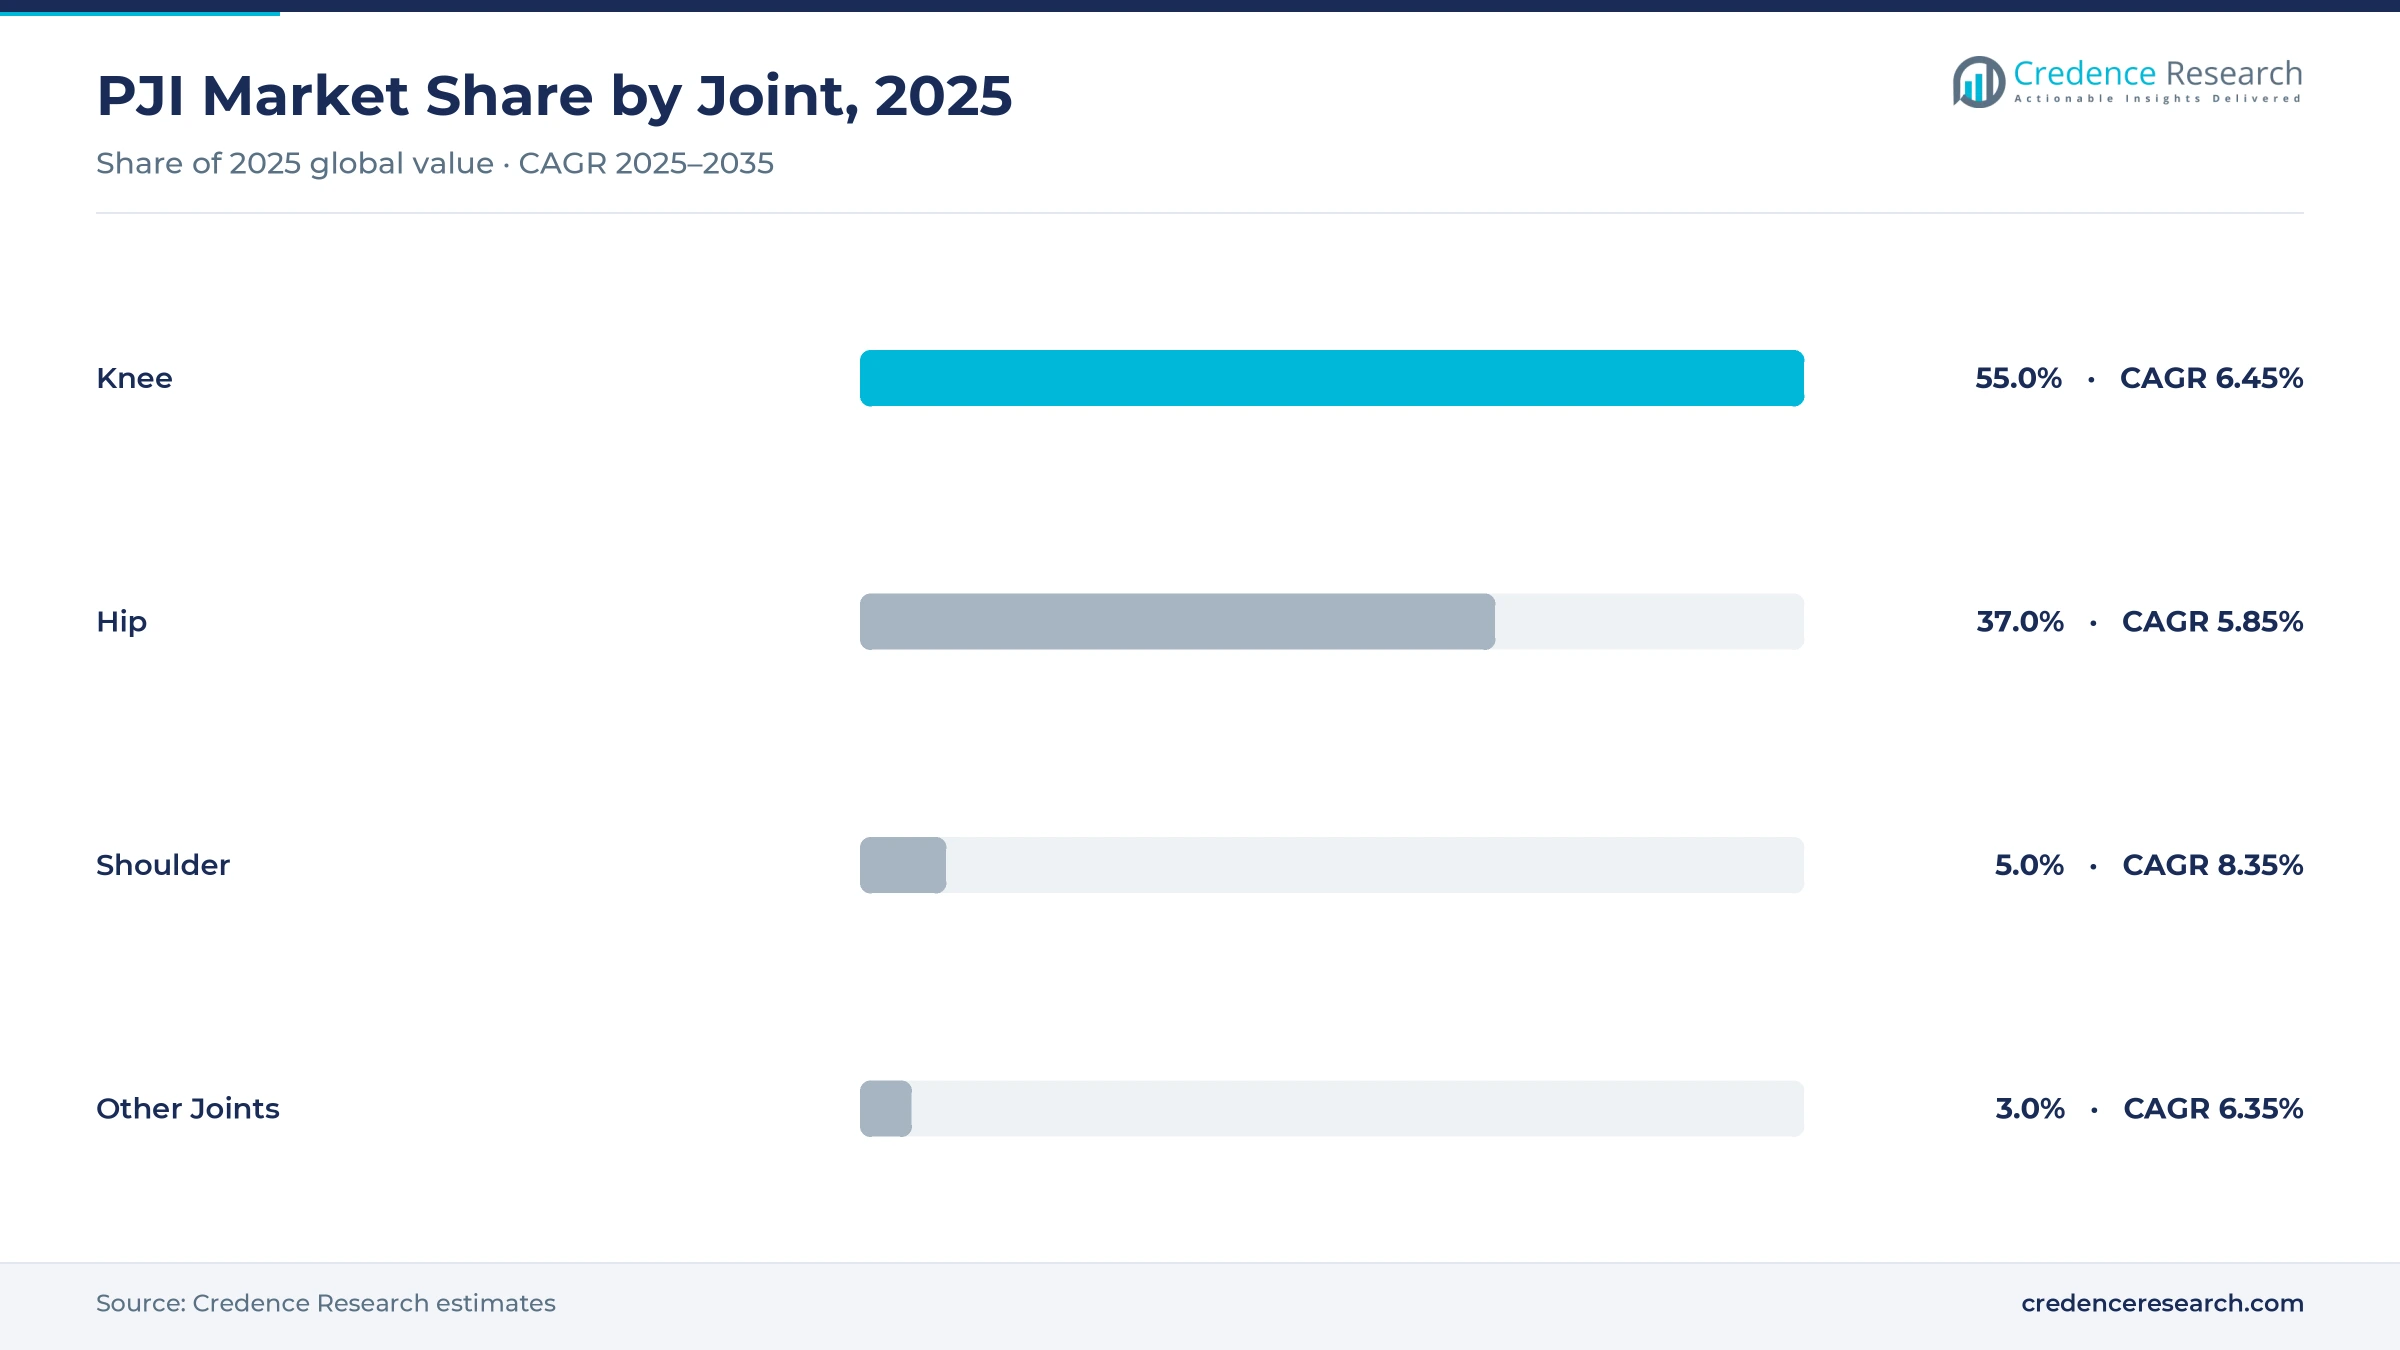
Knee PJI holds a 55.0% share of 2025 value and grows at 6.45% a year. Shoulder grows fastest at 8.35% a year.
| Joint | Share 2025 | CAGR 2025–2035 |
|---|---|---|
| Knee | 55.0% | 6.45% |
| Hip | 37.0% | 5.85% |
| Shoulder | 5.0% | 8.35% |
| Other Joints | 3.0% | 6.35% |
How do hip and shoulder compare?
Hip PJI holds a 37.0% share and grows at 5.85% a year, linked to hip replacement implants. Shoulder PJI holds 5.0% and grows at 8.35%, as shoulder replacement volumes rise quickly. Other joints, such as elbow and ankle, hold 3.0%.
Request a Free Sample
Fill in your details and we'll send you a free sample report.
- Sample data tables & charts
- Research methodology
Why PJI Spending Keeps Rising: More Implants, Older Patients, Costlier Cases
Three forces drive demand for PJI diagnosis and treatment: a growing number of joint replacements, patients who are older and carry more risk factors, and treatment pathways that use more products per case. Together they lift growth above the pace of primary joint surgery.
How do joint replacement volumes feed PJI demand?
Every hip, knee and shoulder replacement adds to the pool of implants that can become infected, often years after surgery. Knee and hip operations keep rising in ageing countries, and the number of people living with an implant grows faster still. Knee PJI holds a 55.0% share of 2025 value, in line with the larger number of knee replacement procedures, while hip PJI holds 37.0%.
Why does patient risk matter?
Obesity, diabetes, smoking and immune-suppressing drugs all raise infection risk. These conditions are more common among joint replacement patients than a decade ago. Higher risk means more infections per thousand operations and more complex cases, with resistant organisms such as MRSA that need costlier antibiotics.
How do treatment pathways raise product use?
Two-stage revision, still the standard in many countries for chronic infection, uses an antibiotic-loaded spacer, weeks of systemic antibiotics and a second operation. Single-stage revision and debridement with implant retention (DAIR) use high-dose local antibiotics and irrigation. Antibiotic-loaded cement and spacers hold a 27.0% share of 2025 value and grow at 6.30% a year.
Why are diagnostics growing faster than the market?
PJI is often hard to confirm, and a missed or wrong diagnosis leads to failed revisions. Synovial fluid biomarker tests, molecular panels and better culture methods help surgeons decide when to operate and which antibiotic to use. Diagnostic tests hold a 14.0% share and grow at 8.30% a year, as hospitals adopt international diagnostic criteria that rely on them.
Do joint registries and quality rules add pressure?
Yes. National joint registries in Europe, Australia and the US publish revision rates by hospital and by implant, and infection is one of the leading reasons for revision. Hospitals that score badly face scrutiny from payers and patients, which pushes them to invest in faster diagnosis and more effective treatment. This steady quality pressure supports demand for tests, spacers and local carriers even where budgets are tight.
From Long Antibiotic Courses to Local Delivery and Implant Surfaces
We track four trends that are changing how PJI is treated.
Trend 1: Local antibiotic delivery is increasing
Surgeons want high antibiotic levels in the joint without the side effects of long systemic courses. Calcium sulphate beads, hydrogels and infusion systems are gaining use. ForCast Orthopedics agreed with KORU Medical Systems in September 2025 to use KORU's pump in a wearable intra-articular infusion system, with a clinical trial expected in 2026. Local carriers grow at 9.30% a year, the fastest product type.
Trend 2: Infection-resistant implant surfaces
Makers are adding antibacterial surfaces to implants. Zimmer Biomet received FDA Breakthrough Device Designation in October 2025 for its iodine-treated hip system, after approval in Japan in September 2025.
Trend 3: Shift toward single-stage revision
More centres in Europe now use single-stage revision for suitable patients. It saves an operation but needs reliable diagnosis and high-dose local antibiotics, which moves value from spacers toward diagnostics and carriers.
Trend 4: Rising antimicrobial resistance
Resistant staphylococci and gram-negative organisms are more common in PJI. This raises demand for newer antibiotics, bacteriophage research and susceptibility testing.
Diagnosis Gaps, Resistance and Thin Evidence Hold the Field Back
Why is diagnosis a barrier?
Low-grade infections can show few symptoms, and cultures are negative in a share of true PJI cases. Diagnostic tests cost money that some hospitals and payers will not cover, so testing rates vary widely by country.
How does antibiotic resistance limit treatment?
Biofilm on an implant protects bacteria from antibiotics, and resistant organisms narrow the drug choice. Failure rates after revision remain high in difficult cases, which limits confidence in less invasive treatment.
Is the evidence base strong enough?
Many products are used off-label or based on small studies. Large randomised trials are rare, which slows reimbursement for new carriers and diagnostics.
What about cost pressure?
Hospitals under bundled payments for joint replacement face pressure to cut costs, which can slow uptake of premium products unless they show fewer readmissions.
Where New PJI Spending Will Concentrate
Which products offer the most new demand?
Local antibiotic carriers and diagnostics together grow faster than the market. New drug-device products in late-stage trials could add a premium segment by the end of the decade.
Which regions offer the best openings?
Asia Pacific is the fastest-growing region at 8.75% a year, as joint replacement volumes rise fast in China, India and South Korea. Middle East and Africa grows at 7.35% a year.
US and European Hospitals Spend the Most, Asia Grows Fastest
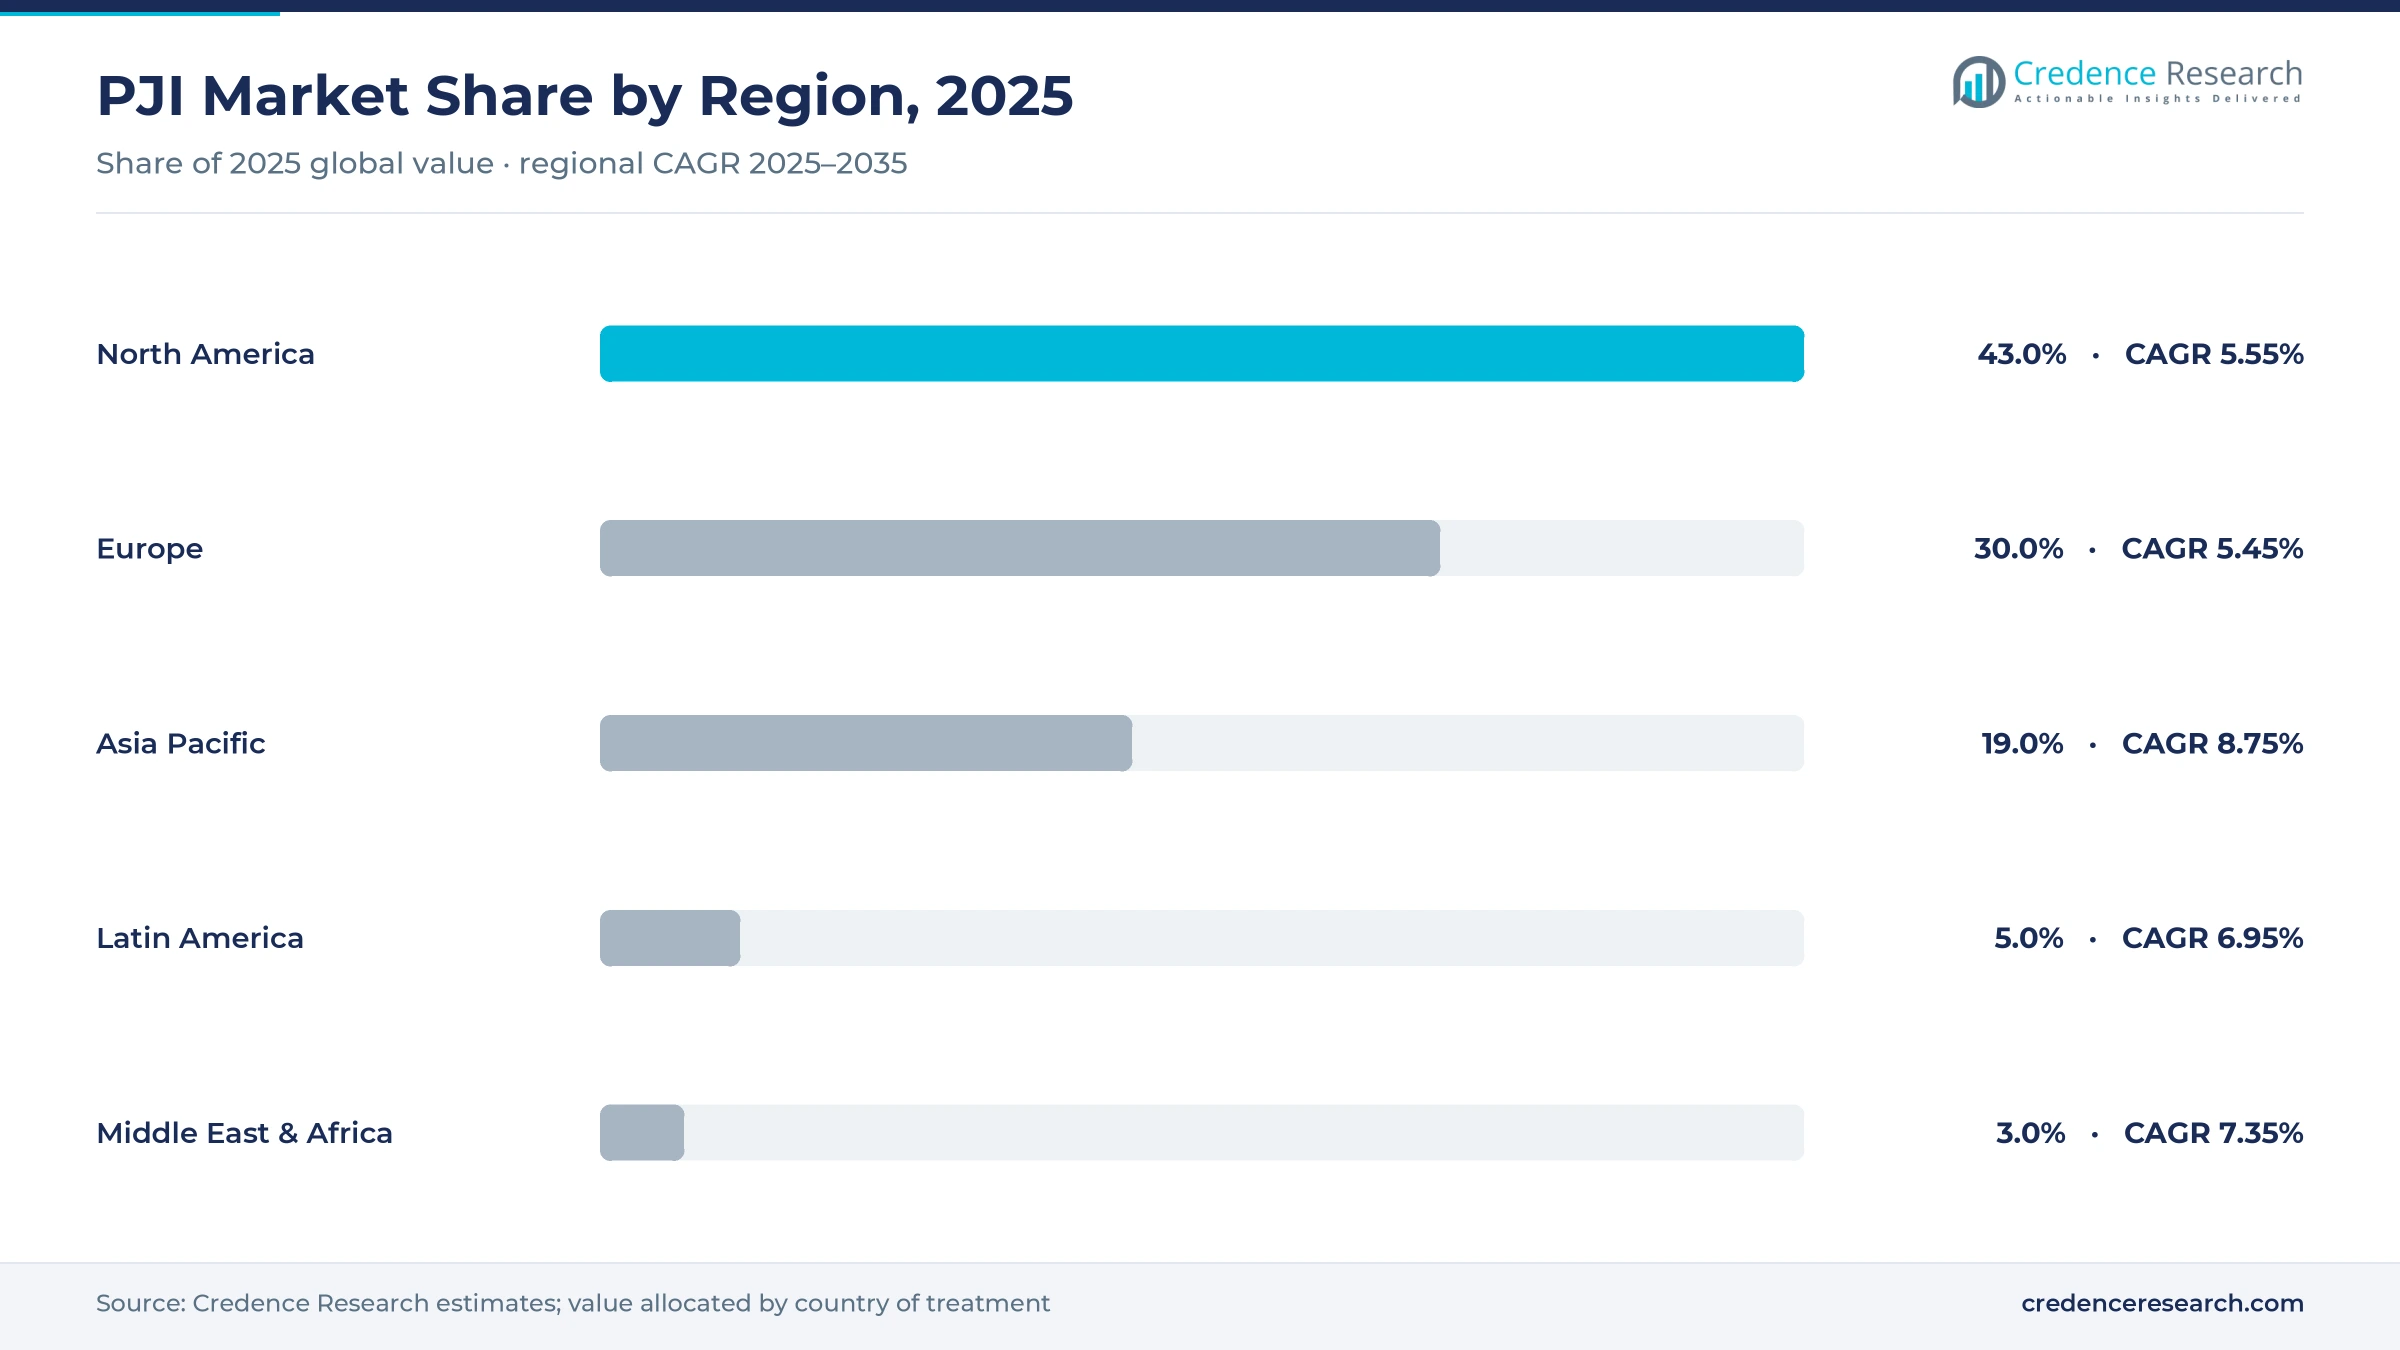
PJI spending follows joint replacement volumes and treatment prices. North America holds a 43.0% share of 2025 value. Asia Pacific is the fastest-growing region at 8.75% a year.
| Region | Share 2025 | CAGR 2025–2035 |
|---|---|---|
| North America | 43.0% | 5.55% |
| Europe | 30.0% | 5.45% |
| Asia Pacific | 19.0% | 8.75% |
| Latin America | 5.0% | 6.95% |
| Middle East & Africa | 3.0% | 7.35% |
North America
North America holds a 43.0% share and grows at 5.55% a year. The United States performs the most hip and knee replacements of any country and pays high prices for revision care.
Europe
Europe holds a 30.0% share and grows at 5.45% a year. Germany, the UK, France, Italy and the Nordic countries run national joint registries that track revision for infection, and several centres lead in single-stage revision.
Asia Pacific
Asia Pacific holds a 19.0% share and grows at 8.75% a year. China, Japan, India, South Korea and Australia are adding joint replacement capacity, which expands the base of implants at risk.
Latin America
Latin America holds a 5.0% share and grows at 6.95% a year, led by Brazil and Mexico.
Middle East & Africa
Middle East and Africa holds a 3.0% share and grows at 7.35% a year, with most spending in Gulf states, Israel, Turkey and South Africa.
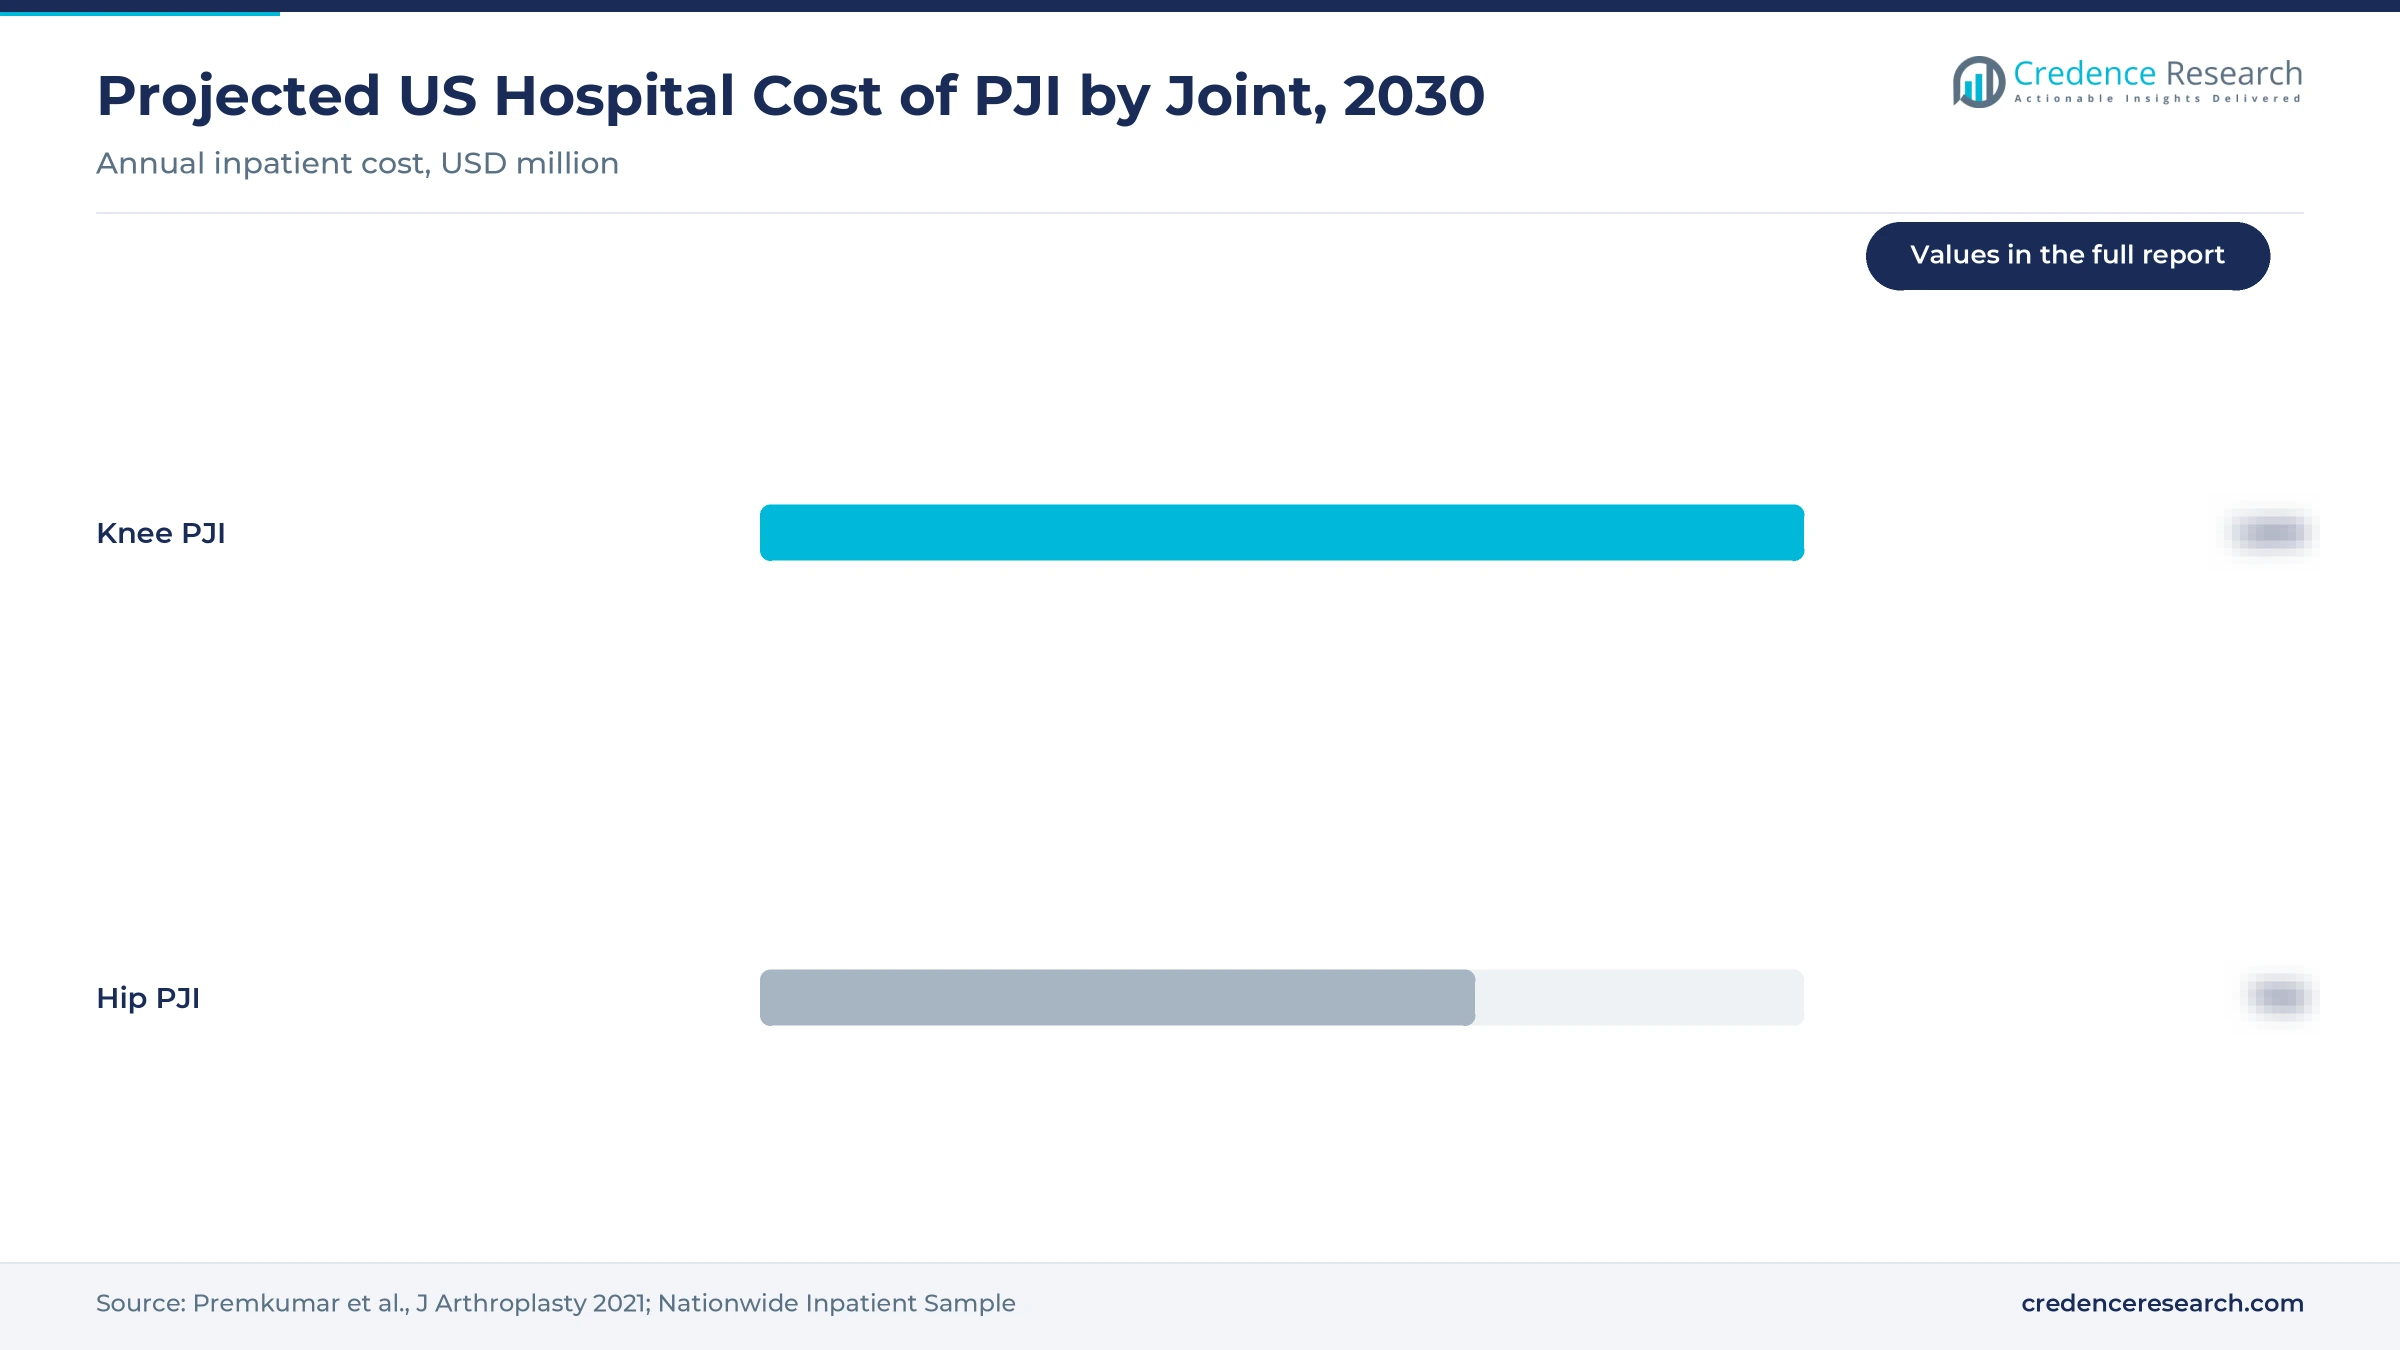
How large is the US hospital cost burden by joint?
US inpatient studies project the hospital cost of PJI separately for knees and hips. Knee infections carry the larger burden because more knees are replaced.
Approvals, Designations and Partnerships in PJI Care, 2025–2026
| Date | Development | Why it matters |
|---|---|---|
| October 2025 | In October 2025, the US FDA granted Breakthrough Device Designation to Zimmer Biomet's iodine-treated total hip system, aimed at reducing PJI. | Brings infection-resistant implant surfaces toward the US market. |
| September 2025 | In September 2025, Japan's PMDA approved the same iodine-treated hip system with an indication for inhibiting bacterial adhesion on the implant surface. | First regulatory approval for the technology. |
| September 2025 | In September 2025, ForCast Orthopedics and KORU Medical Systems agreed to pair KORU's infusion pump with ForCast's wearable intra-articular system for PJI, with a trial expected in 2026. | Advances local antibiotic infusion as a treatment option. |
Need a Custom Version of This Report?
Tailor the scope, geography, or segments to your exact requirements.
- Custom geography or segment scope
- Direct access to our analyst team
Orthopaedic Majors, Cement Specialists and Anti-Infective Innovators
The market splits between large orthopaedic groups that sell spacers and cement, specialists in diagnostics and local delivery, and drug makers. Three groups compete:
- Orthopaedic and cement makers that supply antibiotic-loaded cement and spacers.
- Diagnostics firms that sell synovial fluid and molecular tests.
- Anti-infective developers working on new local and systemic therapies.
Who leads in cement and spacers?
Heraeus Medical makes antibiotic-loaded bone cements and spacer moulds used across Europe and beyond. Zimmer Biomet, Stryker and DePuy Synthes (Johnson & Johnson MedTech) sell cements, spacers and revision systems, and Zimmer Biomet also sells a synovial fluid test for PJI.
Who supplies local carriers and irrigation?
Biocomposites makes calcium sulphate antibiotic carriers. Irrimax and Next Science sell irrigation and antiseptic products used in debridement, and Smith+Nephew supplies revision and wound products.
Who is developing new therapies?
Osteal Therapeutics has completed enrolment in a pivotal trial of its local antibiotic therapy, and ForCast Orthopedics is developing an intra-articular infusion system. Diagnostic firms such as bioMérieux supply molecular panels that identify organisms from joint fluid.
Which recent moves changed the field?
In September 2025, Zimmer Biomet announced that Japan's PMDA had approved its iodine-treated hip system. In October 2025, Zimmer Biomet announced FDA Breakthrough Device Designation for the same system. In September 2025, ForCast Orthopedics signed a partnership with KORU Medical Systems for its infusion system.
How will competition change by 2035?
In our view, products that combine diagnosis with targeted local treatment will win share, because they can cut second operations and readmissions. Large orthopaedic makers will defend their spacer and cement lines and add infection-resistant implant surfaces, while smaller specialists compete on clinical evidence and partnerships with leading revision centres.
Frequently Asked Questions
How big is the prosthetic joint infections market?
What does the prosthetic joint infections market include?
Which product type is largest?
Which joint accounts for most PJI spending?
Which region leads the prosthetic joint infections market?
Who are the leading companies in PJI products?
How was the prosthetic joint infections market sized?
Table of Content
Chapter 1 Market Segmentation
- 1.1 Segmentation Framework
- 1.1.1 Product and Service Classification
- 1.1.2 Application and End-Use Classification
- 1.1.3 Technology and Solution Classification
- 1.1.4 Customer and Distribution Channel Classification
- 1.1.5 Geographic Segmentation
- 1.1.6 Market Segment Definitions and Boundaries
- 1.2 By Product Type
- 1.2.1 Systemic Antibiotic Therapies
- 1.2.2 Antibiotic-Loaded Bone Cement & Spacers
- 1.2.3 Diagnostic Tests
- 1.2.4 Local Antibiotic Carriers
- 1.2.5 Irrigation & Antiseptic Solutions
- 1.3 By Joint
- 1.3.1 Knee
- 1.3.2 Hip
- 1.3.3 Shoulder
- 1.3.4 Other Joints
Chapter 2 Introduction
- 2.1 Report Objectives and Scope
- 2.2 Product Definition and Industry Terminology
- 2.3 Market Inclusions and Exclusions
- 2.4 Research Process
- 2.4.1 Primary Research and Expert Interviews
- 2.4.2 Secondary Research and Source Review
- 2.4.3 Top-Down and Bottom-Up Estimation
- 2.4.4 Data Triangulation and Verification
- 2.5 Market Size Measurement Basis
- 2.5.1 2025: USD 742.6 million → 2035: USD 1,371.8 million
- 2.6 Historical and Forecast Reference Periods
- 2.6.1 Historical Period: 2018-2025
- 2.6.2 Base Year: 2025
- 2.6.3 Forecast Period: 2025-2035
- 2.7 Research Assumptions and Limitations
Chapter 3 Executive Summary
- 3.1 Market Snapshot and Key Findings
- 3.2 Base-Year Market Size, 2025
- 3.3 Forecast Market Size, 2035
- 3.4 Revenue and Volume Growth Outlook
- 3.5 Key Demand and Supply Indicators
- 3.6 Leading Market Segments
- 3.7 Fastest-Growing Market Opportunities
- 3.8 Regional Performance Highlights
- 3.9 Technology and Industry Transformation
- 3.10 Competitive Landscape Summary
- 3.11 Analyst View and Strategic Implications
Chapter 4 Global Prosthetic Joint Infections Market Trends and Developments
- 4.1 Historical Industry Development, 2018-2025
- 4.2 Recent Market Trends and Developments
- 4.3 Demand and Customer Behavior Trends
- 4.4 Technology and Product Innovation
- 4.5 Artificial Intelligence, Automation and Digitalization
- 4.6 Local Manufacturing and Supply Chain Realignment
- 4.7 Industry Partnerships, Mergers and Acquisitions
- 4.8 Sustainability and Circular Economy Developments
- 4.9 Government and Private Sector Investment Trends
- 4.10 Emerging Business Models and Commercialization
- 4.11 Industry Developments and Announcements
Chapter 5 Global Prosthetic Joint Infections Market Production, Supply and Demand Analysis
- 5.1 Demand Trend and Consumption Analysis, 2018-2025
- 5.2 Demand Forecast, 2025-2035
- 5.3 Production and Output Trend, 2018-2025
- 5.4 Production and Output Forecast, 2025-2035
- 5.5 Installed Capacity and Capacity Utilization
- 5.6 Company-Wise Production Plants and Statistics
- 5.6.1 Installed Production Capacity
- 5.6.2 Actual Production
- 5.6.3 Planned Capacity and Expansion Targets
- 5.7 Supply Chain Structure and Procurement Trends
- 5.8 Supply-Demand Gap and Bottlenecks
- 5.9 Import Dependence and Sourcing Structure
- 5.10 Contract Manufacturing and Outsourcing
- 5.11 Regional Supply and Demand Concentration
Chapter 6 Global Prosthetic Joint Infections Market Pricing Analysis
- 6.1 Pricing Structure and Measurement
- 6.2 Historical Pricing Trends, 2018-2025
- 6.3 Pricing Outlook, 2025-2035
- 6.4 Average Selling Price and Unit Economics
- 6.5 Pricing by Product and Market Segment
- 6.6 Geographic Pricing Differences
- 6.7 Key Input, Energy, Labor and Logistics Costs
- 6.8 Contract Pricing and Purchasing Models
- 6.9 Pricing Sensitivity and Competitive Positioning
- 6.10 Price, Margin and Profitability Implications
Chapter 7 Global Prosthetic Joint Infections Market Dynamics
- 7.1 Market Growth Drivers
- 7.1.1 Demand-Side Drivers
- 7.1.2 Technology and Innovation Drivers
- 7.1.3 Infrastructure and Investment Drivers
- 7.1.4 Regulatory and Policy Drivers
- 7.2 Market Restraints
- 7.2.1 Cost and Affordability Constraints
- 7.2.2 Technology and Adoption Barriers
- 7.2.3 Supply Chain and Operational Constraints
- 7.3 Market Challenges
- 7.3.1 Competitive Pressure and Margin Erosion
- 7.3.2 Skills, Infrastructure and Implementation Gaps
- 7.4 Emerging Market Opportunities
- 7.5 Market Dynamics Impact and Time-Horizon Assessment
Chapter 8 Global Prosthetic Joint Infections Value Chain Analysis
- 8.1 Industry Value Chain Overview
- 8.2 Upstream Suppliers and Critical Inputs
- 8.3 Technology and Component Providers
- 8.4 Manufacturing or Service Delivery
- 8.5 Distribution, Channel Partners and Integrators
- 8.6 Downstream Applications and End Users
- 8.7 Value Addition and Profit Pools
- 8.8 Vertical Integration and Outsourcing
- 8.9 Supplier Concentration and Risk
- 8.10 Supply Chain Localization and Resilience
Chapter 9 Global Prosthetic Joint Infections Market Regulations and Policies
- 9.1 Relevant Laws, Standards and Compliance Frameworks
- 9.2 Product, Service, Safety and Quality Requirements
- 9.3 Government Policies, Incentives and Subsidies
- 9.4 Imports, Exports and Trade Barriers
- 9.5 Public Procurement and Local Content Requirements
- 9.6 Environmental and Sustainability Compliance
- 9.7 Upcoming Policy Changes and Market Implications
Chapter 10 Global Prosthetic Joint Infections Market Hotspots and Opportunities
- 10.1 Market Opportunity Mapping and Growth Hotspots
- 10.2 High-Growth Applications and Customer Groups
- 10.3 Underserved Markets and White-Space Opportunities
- 10.4 Emerging Technology and Product Opportunities
- 10.5 New Capacity and Investment Hotspots
- 10.6 Market Entry and Expansion Opportunities
- 10.7 Distribution and Partnership Opportunities
- 10.8 Near-Term and Long-Term Commercial Potential
- 10.9 Opportunity Attractiveness and Execution Risks
Chapter 11 Global Prosthetic Joint Infections Market Outlook, 2025-2035
- 11.1 Market Size and Analysis
- 11.1.1 Revenue (Market Measurement: 2025: USD 742.6 million → 2035: USD 1,371.8 million)
- 11.1.2 Market Volume and Quantity Sold
- 11.1.3 Historical Market Size, 2018-2025
- 11.1.4 Base-Year Market Size, 2025
- 11.2 Market Forecast, 2025-2035
- 11.2.1 Revenue Forecast to 2035
- 11.2.2 Volume Forecast to 2035
- 11.2.3 CAGR and Year-on-Year Growth
- 11.2.4 Incremental Revenue Opportunity
- 11.3 Forecast Assumptions and Scenario Analysis
- 11.3.1 Base-Case Forecast
- 11.3.2 Optimistic and Conservative Scenarios
- 11.3.3 Technology, Pricing and Policy Sensitivities
- 11.4 Market Attractiveness and Growth Outlook
Chapter 12 Global Prosthetic Joint Infections Market Segmentation and Outlook
- 12.1 Segmentation Summary and Market Shares, 2025
- 12.2 Largest and Fastest-Growing Segments
- 12.3 By Product Type - Market Size and Forecast, 2025-2035
- 12.3.1 Segment Definition and Scope
- 12.3.2 Historical Market Size, 2018-2025
- 12.3.3 Revenue Forecast, 2025-2035
- 12.3.4 Volume Forecast, 2025-2035
- 12.3.5 Base-Year Market Share, 2025
- 12.3.6 Segment CAGR and Growth Drivers
- 12.3.7 Subsegment Market Size and Forecast
- 12.3.7.1 Systemic Antibiotic Therapies
- 12.3.7.2 Antibiotic-Loaded Bone Cement & Spacers
- 12.3.7.3 Diagnostic Tests
- 12.3.7.4 Local Antibiotic Carriers
- 12.3.7.5 Irrigation & Antiseptic Solutions
- 12.3.8 Subsegment Pricing and Adoption Trends
- 12.3.9 Leading Suppliers and Competition
- 12.3.10 Regional Demand and Opportunities
- 12.4 By Joint - Market Size and Forecast, 2025-2035
- 12.4.1 Segment Definition and Scope
- 12.4.2 Historical Market Size, 2018-2025
- 12.4.3 Revenue Forecast, 2025-2035
- 12.4.4 Volume Forecast, 2025-2035
- 12.4.5 Base-Year Market Share, 2025
- 12.4.6 Segment CAGR and Growth Drivers
- 12.4.7 Subsegment Market Size and Forecast
- 12.4.7.1 Knee
- 12.4.7.2 Hip
- 12.4.7.3 Shoulder
- 12.4.7.4 Other Joints
- 12.4.8 Subsegment Pricing and Adoption Trends
- 12.4.9 Leading Suppliers and Competition
- 12.4.10 Regional Demand and Opportunities
- 12.5 Segment Growth Comparison
- 12.6 Segment Attractiveness and Priority Matrix
Chapter 13 Global Prosthetic Joint Infections Geographic Market Outlook, 2025-2035
- 13.1 Regional Market Size and Share, 2025
- 13.2 Regional Market Forecast, 2025-2035
- 13.3 Regional Pricing, Production and Demand Differences
- 13.4 North America
- 13.4.1 United States
- 13.4.2 Canada
- 13.4.3 Mexico
- 13.5 Europe
- 13.5.1 Germany
- 13.5.2 France
- 13.5.3 Italy
- 13.5.4 United Kingdom
- 13.5.5 Spain
- 13.5.6 Poland
- 13.5.7 Russia
- 13.5.8 Netherlands
- 13.5.9 Belgium
- 13.5.10 Sweden
- 13.5.11 Denmark
- 13.5.12 Norway
- 13.5.13 Rest of Europe
- 13.6 Asia Pacific
- 13.6.1 China
- 13.6.2 India
- 13.6.3 Japan
- 13.6.4 South Korea
- 13.6.5 Thailand
- 13.6.6 Indonesia
- 13.6.7 Vietnam
- 13.6.8 Malaysia
- 13.6.9 Australia
- 13.6.10 Rest of Asia Pacific
- 13.7 Latin America
- 13.7.1 Brazil
- 13.7.2 Argentina
- 13.7.3 Colombia
- 13.7.4 Chile
- 13.7.5 Rest of Latin America
- 13.8 Middle East
- 13.8.1 Saudi Arabia
- 13.8.2 United Arab Emirates
- 13.8.3 Turkey
- 13.8.4 Israel
- 13.8.5 Iran
- 13.8.6 Rest of the Middle East
- 13.9 Africa
- 13.9.1 South Africa
- 13.9.2 Egypt
- 13.9.3 Nigeria
- 13.9.4 Morocco
- 13.9.5 Rest of Africa
- 13.10 Regional Investment, Policy and Supply Chain Differences
- 13.11 Regional Competitive Landscape
- 13.12 Geographic Growth Hotspots
Chapter 14 Global Prosthetic Joint Infections Technology, Innovation and Sustainability Outlook
- 14.1 Technology Landscape and Maturity
- 14.2 Product, Process and Service Innovation
- 14.3 AI, Automation and Digital Tools in the Industry
- 14.4 Technology Adoption and Performance Benchmarking
- 14.5 Innovation Pipeline and R&D Investment
- 14.6 Patent and Intellectual Property Trends
- 14.7 Energy Efficiency and Resource Management
- 14.8 Sustainability, Recycling and Circularity
- 14.9 Technology Roadmap, 2025-2035
- 14.10 Risks of Obsolescence and Technology Substitution
Chapter 15 Global Prosthetic Joint Infections Market Key Strategic Imperatives
- 15.1 Growth and Market Entry Priorities
- 15.2 High-Return Products and Segments
- 15.3 Pricing, Profitability and Cost Optimization
- 15.4 Technology Investment and Product Differentiation
- 15.5 Supply Chain Localization and Resilience
- 15.6 Distribution and Customer Acquisition
- 15.7 Partnership, Acquisition and Capacity Strategy
- 15.8 Regional Expansion Priorities
- 15.9 Short-, Medium- and Long-Term Actions
Chapter 16 Competition Outlook
- 16.1 Industry Competition Characteristics
- 16.2 Market Structure and Concentration
- 16.3 Market Share and Competitive Positioning, 2025
- 16.4 Company-Wise Revenue and Product Benchmarking
- 16.5 Production and Service Capacity Benchmarking
- 16.6 Technology, Pricing and Differentiation
- 16.7 Regional Footprint and Distribution Strength
- 16.8 Mergers, Acquisitions and Strategic Alliances
- 16.9 New Entrants and Competitive Threats
- 16.10 Porter's Five Forces and Industry Attractiveness
- 16.11 Competitive Outlook, 2025-2035
Chapter 17 Company Profiles
- 17.1 Company Coverage and Selection Criteria
- 17.2 Heraeus Medical
- 17.2.1 Business Description
- 17.2.2 Company Ownership and Geographic Presence
- 17.2.3 Product and Service Portfolio
- 17.2.4 Manufacturing and Operating Footprint
- 17.2.5 Production Capacity and Expansion Plans
- 17.2.6 Financial Performance and Investment
- 17.2.7 Market Share and Competitive Position
- 17.2.8 Technology and Innovation Capabilities
- 17.2.9 Strategic Alliances or Partnerships
- 17.2.10 Recent Developments
- 17.2.11 Growth Strategy and Outlook
- 17.3 Zimmer Biomet
- 17.4 Stryker
- 17.5 DePuy Synthes
- 17.6 Smith+Nephew
- 17.7 Biocomposites
- 17.8 Next Science
- 17.9 bioMérieux
- 17.10 Osteal Therapeutics
- 17.11 ForCast Orthopedics
- 17.12 Other Relevant Market Participants
Note: Every listed company is profiled on the structure shown under the first company. The company list is preliminary and may change based on research findings, market developments, data availability and client requirements.
Chapter 18 Disclaimer
- 18.1 Research and Forecast Disclaimer
- 18.2 Data Source and Estimation Limitations
Note: The depth of individual sections depends on data availability for this market. Volume, capacity, trade and other unit-based metrics are included where applicable.

