
Market Overview
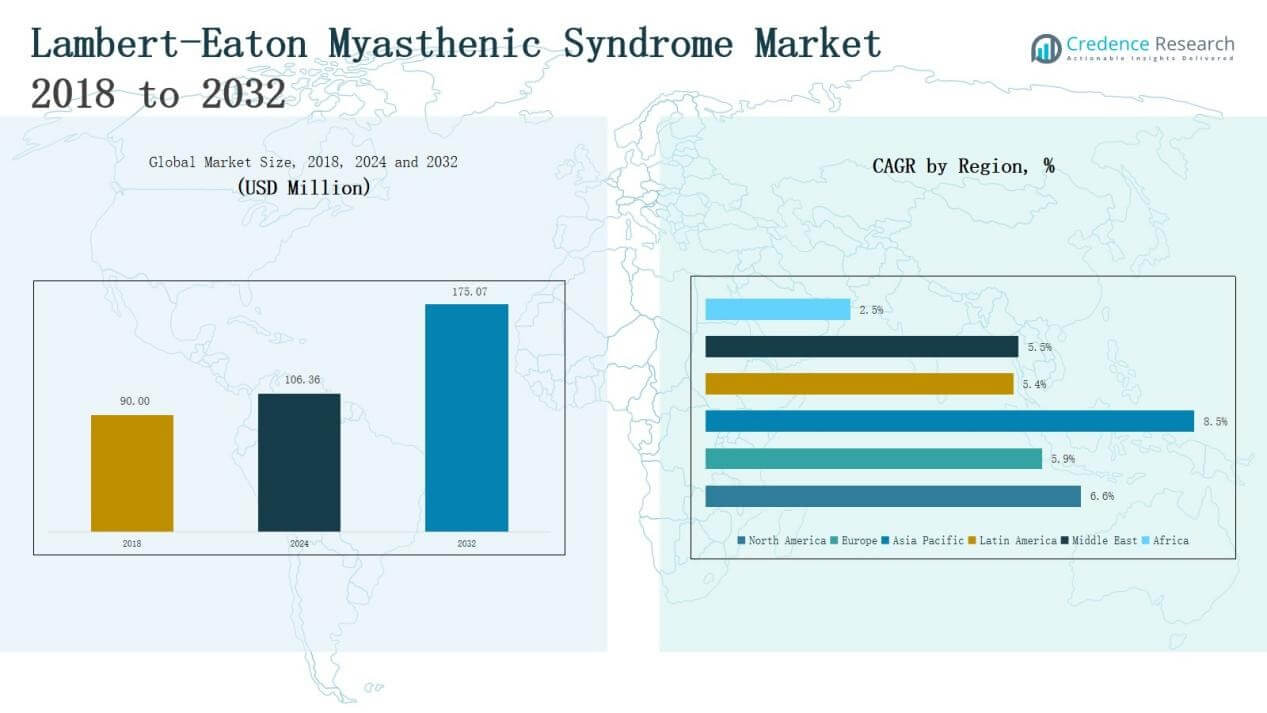
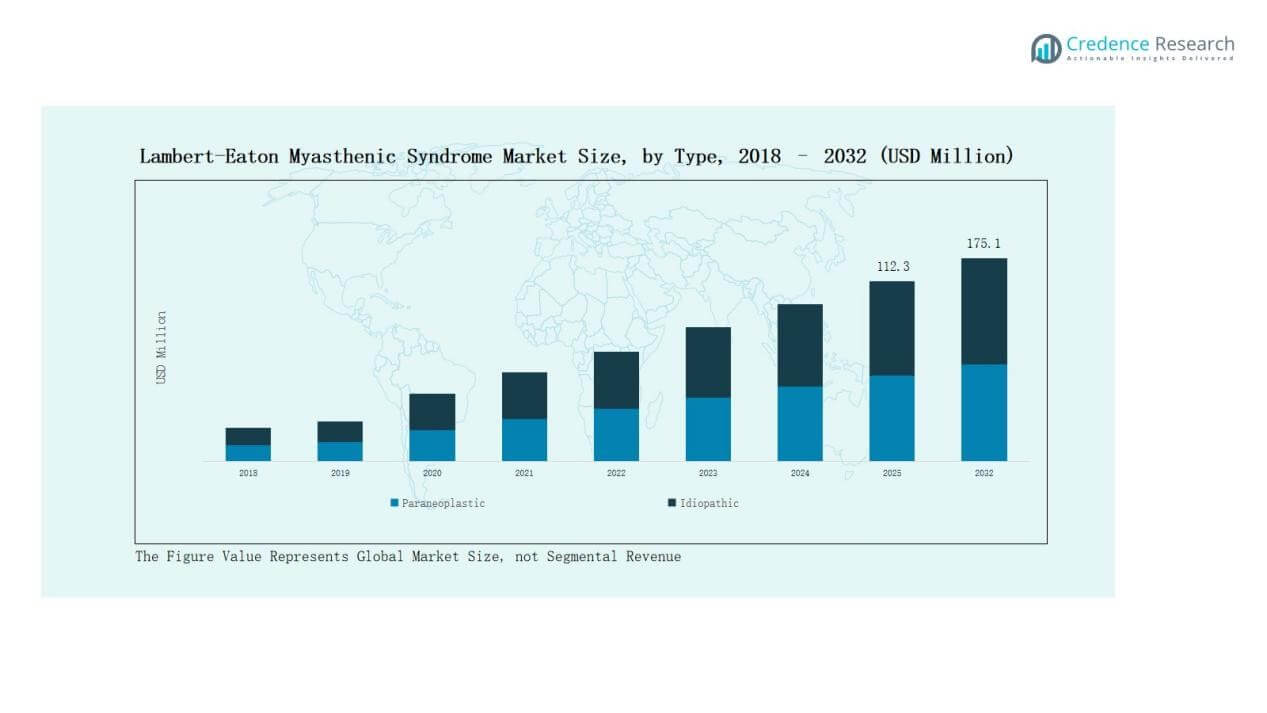
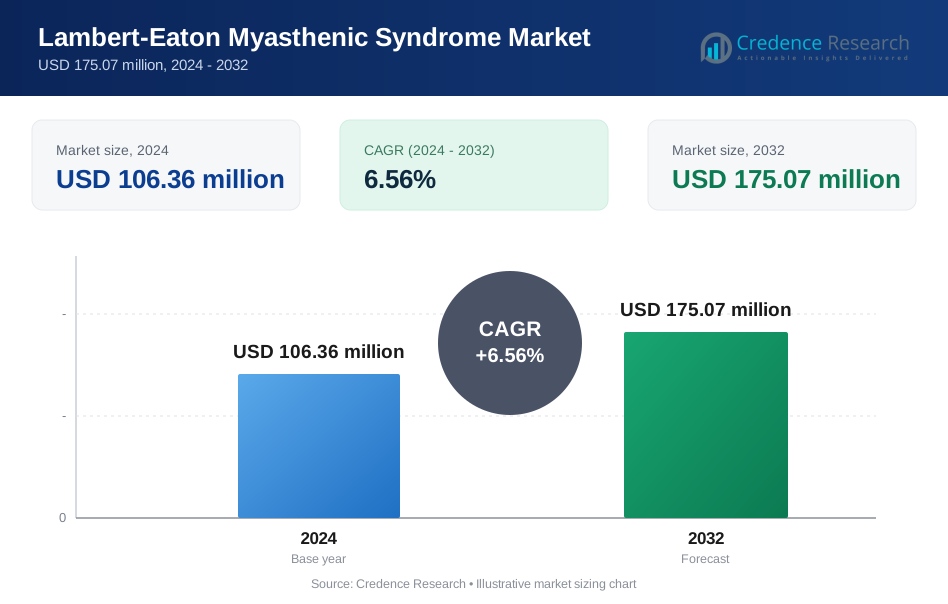
The Lambert-Eaton Myasthenic Syndrome (LEMS) Market size was valued at USD 90.00 million in 2018, reaching USD 106.36 million in 2024, and is anticipated to reach USD 175.07 million by 2032, at a CAGR of 6.56% during the forecast period (2024–2032).
| REPORT ATTRIBUTE | DETAILS |
|---|---|
| Historical Period | 2020-2023 |
| Base Year | 2024 |
| Forecast Period | 2025-2032 |
| Lambert-Eaton Myasthenic Syndrome (LEMS) Market Size 2024 | USD 106.36 Million |
| Lambert-Eaton Myasthenic Syndrome (LEMS) Market, CAGR | 6.56% |
| Lambert-Eaton Myasthenic Syndrome (LEMS) Market Size 2032 | USD 175.07 Million |
The Lambert-Eaton Myasthenic Syndrome (LEMS) market is shaped by the presence of leading pharmaceutical and biopharmaceutical companies, including Catalyst Pharmaceuticals, Grifols, Alexion Pharmaceuticals, argenx SE, Immunovant, Ra Pharmaceuticals, Bausch Health Companies, Jacobus Pharmaceutical, Takeda Pharmaceutical, and Prestige Biopharma Limited. These players focus on advancing therapies such as cholinesterase inhibitors, potassium channel blockers, and antibody-based treatments, supported by clinical trials and orphan drug designations. Strategic collaborations, acquisitions, and strong research pipelines further enhance their competitive positioning. North America emerged as the leading region in 2024, commanding 44.7% of the global market share, driven by robust healthcare infrastructure, favorable reimbursement policies, and early diagnosis capabilities.
Market Insights
- The Lambert-Eaton Myasthenic Syndrome Market grew from USD 90.00 million in 2018 to USD 106.36 million in 2024 and is projected at USD 175.07 million by 2032.
- North America led with 44.7% share in 2024, supported by advanced healthcare infrastructure, favorable reimbursement policies, strong pharmaceutical presence, and higher awareness ensuring timely diagnosis and treatment adoption.
- By type, the paraneoplastic segment dominated with 62% share in 2024, driven by its strong link to small cell lung cancer, while idiopathic cases accounted for 38% due to better diagnostic capabilities.
- By treatment type, medication held the largest share at 47% in 2024, followed by immune therapy at 32%, plasmapheresis at 14%, and others at 7%, supported by drug approvals and wider accessibility.
- Hospitals accounted for the largest end-user share at 54% in 2024, reflecting strong diagnostic infrastructure and insurance-backed care, while specialty clinics held 27%, homecare 11%, and others 8%.
 Market Segment Insights
By Type
The paraneoplastic segment held the dominant share of 62% in 2024, driven by its strong association with small cell lung cancer cases. Higher prevalence in cancer patients makes early diagnosis and treatment more frequent compared to idiopathic cases. The idiopathic segment accounted for the remaining 38% share, supported by rising awareness and improved diagnostic capabilities. Growing cancer screening programs and oncology-driven management remain the key driver for the paraneoplastic segment’s lead.
By Treatment Type
Medication accounted for the largest share at 47% in 2024, supported by the wide use of cholinesterase inhibitors and potassium channel blockers. Immune therapy followed with a 32% share, fueled by rising adoption of intravenous immunoglobulin and immunosuppressants. Plasmapheresis captured 14%, while others held 7%, reflecting use in severe or refractory cases. Increasing drug approvals, affordability, and accessibility ensure medication continues as the leading treatment approach.
For instance, UCB received U.S. FDA approval for Rystiggo (rozanolixizumab-noli) for the treatment of generalized myasthenia gravis in adults, strengthening the use of antibody-targeted therapy.
By End-user
Hospitals dominated the market with a 54% share in 2024, due to advanced diagnostic facilities, availability of multidisciplinary care, and preference for acute management in hospital settings. Specialty clinics followed with 27% share, supported by their role in long-term neurological care and patient monitoring. Homecare contributed 11%, growing with the availability of supportive therapies, while others held 8%. The hospital segment’s leadership is driven by higher patient inflow and insurance support for advanced care.
For instance, Apollo Hospitals in India introduced an AI-driven stroke management program across its network, demonstrating why hospitals remain the preferred setting for advanced neurological interventions.
 Key Growth Drivers
Rising Prevalence of Cancer-Associated Cases
Paraneoplastic Lambert-Eaton Myasthenic Syndrome is strongly linked to small cell lung cancer, driving consistent demand for treatment solutions. The rising global cancer burden and early oncology-based detection programs expand the diagnosed patient pool. This creates higher adoption of targeted medications and supportive therapies. Increased healthcare awareness and screening initiatives further reinforce market growth, with hospitals prioritizing integrated care approaches for these patients.
Advancements in Immunotherapies and Medications
Innovations in immunotherapies, intravenous immunoglobulins, and potassium channel blockers are reshaping treatment outcomes. Expanding clinical research on targeted therapies boosts efficacy and reduces side effects, making treatment more accessible. Companies are investing in drug development pipelines focused on rare neurological disorders, including LEMS. Improved regulatory pathways for orphan drugs also accelerate approvals, ensuring faster patient access. Such advancements strongly position novel medications as a key driver in market expansion.
For instance, the bispecific antibody Lynozyfic was approved for relapsed or refractory multiple myeloma after patients had undergone at least four prior therapies, underscoring progress in tailored therapy options.
Supportive Healthcare Infrastructure and Reimbursement Policies
Expanding neurological care infrastructure, especially in developed markets, ensures early diagnosis and effective treatment. Favorable reimbursement schemes for rare diseases support affordability and widen patient access to high-cost therapies like IVIG and immunosuppressants. Governments and insurers are recognizing the burden of rare autoimmune disorders, leading to structured policy support. This strengthens hospital-based care and enhances specialist clinic roles. Strong healthcare frameworks provide a foundation for sustained growth across global markets.
For instance, the U.S. Centers for Medicare & Medicaid Services expanded coverage for intravenous immunoglobulin (IVIG) home infusions, improving treatment access for patients with primary immunodeficiency diseases.
Key Trends & Opportunities
Growing Focus on Rare Disease Research and Orphan Drug Development
Pharmaceutical companies are investing heavily in orphan drug research, supported by government incentives and tax benefits. LEMS, being a rare autoimmune neuromuscular disorder, benefits directly from these initiatives. Increased collaboration between biotech firms and research institutions accelerates the development of innovative therapies. This trend opens significant opportunities for pipeline expansion and market differentiation.
For instance, BioMarin Pharmaceutical secured orphan drug designation for amifampridine phosphate for LEMS from both the U.S. FDA and the European Medicines Agency, ensuring market exclusivity and facilitating regulatory progress.
Integration of Personalized and Precision Medicine
The shift toward personalized medicine is creating opportunities for tailored LEMS treatment approaches. Genetic profiling, biomarker-driven diagnosis, and individualized drug regimens are gaining traction. These strategies enhance treatment outcomes and reduce relapse rates. Integration of AI and digital platforms in neurology also supports patient monitoring and therapy optimization. This positions precision medicine as a transformative opportunity in managing rare neurological conditions.
For instance, Catalyst Pharmaceuticals' Firdapse (amifampridine phosphate) was approved by the FDA for treating adults with LEMS, demonstrating that formal, regulated approval pathways can provide standardized outcome tracking and safety profiling, which offers important benefits for therapies, particularly in rare diseases.
Key Challenges
Limited Patient Population and Diagnosis Rates
LEMS remains a rare disorder with a small patient base, which restricts large-scale commercial potential. Many cases remain underdiagnosed due to overlapping symptoms with myasthenia gravis and other neuromuscular conditions. This diagnostic gap hinders timely treatment initiation and reduces overall therapy adoption. Limited availability of specialized neurologists and inconsistent awareness campaigns in emerging markets further exacerbate the issue. As a result, diagnosis delays directly impact treatment efficiency, ultimately slowing the overall market expansion and leaving a significant proportion of patients untreated.
High Treatment Costs and Affordability Barriers
Advanced therapies, including IVIG and immunotherapies, involve substantial treatment costs, creating affordability challenges. Patients in developing markets often lack insurance coverage, limiting access. Despite supportive reimbursement in developed regions, financial burden continues to pose a significant challenge. Expensive lifelong treatment and frequent hospital visits increase the strain on families and healthcare systems. High drug development costs and limited competition among manufacturers also keep prices elevated. These factors together restrict the widespread adoption of novel therapies and create long-term affordability concerns.
Adverse Effects and Therapy Limitations
Available medications and immunotherapies often come with side effects such as muscle pain, infections, and gastrointestinal issues. Plasmapheresis, though effective in severe cases, remains invasive and not widely sustainable. These limitations affect long-term patient adherence and create demand for safer alternatives. Furthermore, patients undergoing repeated IVIG infusions may face risks of bloodborne infections, allergic reactions, and limited efficacy over time. Such safety concerns discourage widespread acceptance. The need for safer, more targeted, and less invasive treatment methods remains a pressing challenge for stakeholders in this market.
 Regional Analysis
North America
North America dominated the Lambert-Eaton Myasthenic Syndrome market, holding 45.2% share in 2018, which slightly increased to 44.7% in 2024 and is projected at 44.7% by 2032. Market size grew from USD 40.68 million in 2018 to USD 47.61 million in 2024, reaching USD 78.27 million by 2032, at a CAGR of 6.6%. Growth is driven by advanced healthcare infrastructure, favorable reimbursement policies, and strong presence of key pharmaceutical players. High awareness and early diagnosis further strengthen the region’s leadership position.
Europe
Europe ranked second, contributing 28.6% share in 2018, slightly decreasing to 27.6% in 2024 and projected at 26.2% by 2032. Revenue expanded from USD 25.74 million in 2018 to USD 29.33 million in 2024, reaching USD 45.83 million by 2032, at a CAGR of 5.9%. Growth is supported by strong clinical research, advanced neurology centers, and government-backed rare disease programs. However, slower adoption of high-cost therapies compared to North America keeps growth moderate.
Asia Pacific
Asia Pacific is the fastest-growing market, holding 15.2% share in 2018, rising to 16.3% in 2024 and projected at 19% by 2032. The region’s revenue increased from USD 13.73 million in 2018 to USD 17.38 million in 2024, and is expected to reach USD 33.25 million by 2032, at a CAGR of 8.5%. Rising healthcare expenditure, expanding neurological research, and growing awareness in China, Japan, and India drive this momentum. Favorable government initiatives for rare disease management further accelerate adoption.
Latin America
Latin America contributed 5.2% share in 2018, stabilizing at 5.2% in 2024 and expected to slightly decline to 4.7% by 2032. Market revenue increased from USD 4.73 million in 2018 to USD 5.53 million in 2024, reaching USD 8.31 million by 2032, at a CAGR of 5.4%. Growth is fueled by expanding healthcare infrastructure in Brazil and Mexico. However, limited specialist availability and affordability barriers constrain higher adoption of advanced therapies.
Middle East
The Middle East accounted for 4.6% share in 2018, reducing slightly to 4.3% in 2024 and projected at 4% by 2032. Regional revenue rose from USD 4.14 million in 2018 to USD 4.64 million in 2024, expected to reach USD 7.02 million by 2032, at a CAGR of 5.5%. Growing healthcare modernization in GCC countries and increased focus on neurological disorders support growth. Yet, uneven access to advanced treatments across the region restricts broader market penetration.
Africa
Africa held the smallest share at 1.1% in 2018, increasing slightly to 1.8% in 2024 but expected to fall back to 1.4% by 2032. Market revenue grew from USD 0.97 million in 2018 to USD 1.87 million in 2024, and is forecast to reach USD 2.39 million by 2032, at a CAGR of 2.5%. Limited infrastructure, low awareness, and affordability challenges remain major barriers. However, South Africa and Egypt show improving adoption with growing access to neurological care facilities.
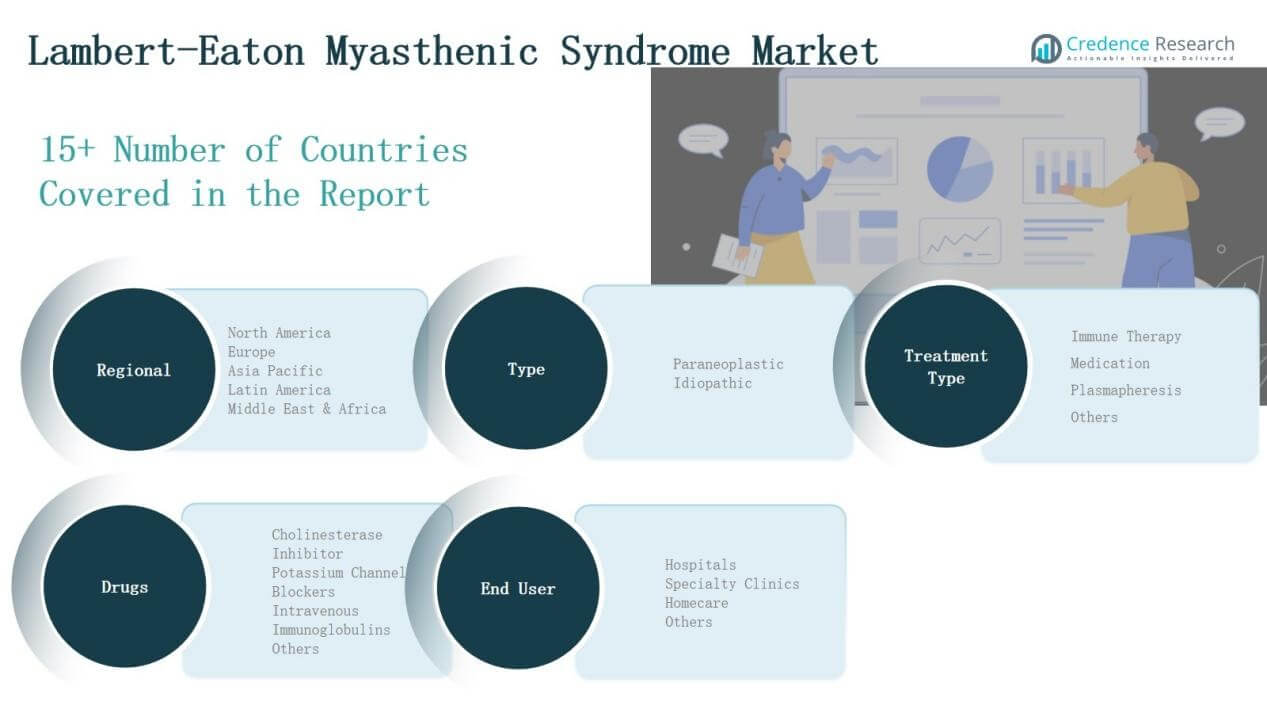
Market Segmentations:
By Type
- Paraneoplastic
- Idiopathic
By Treatment Type
- Immune Therapy
- Medication
- Plasmapheresis
- Others
By End-user
- Hospitals
- Specialty Clinics
- Homecare
- Others
By Drugs
- Cholinesterase Inhibitor
- Potassium Channel Blockers
- Intravenous Immunoglobulins
- Others
By Region
- North America
- U.S.
- Canada
- Mexico
- Europe
- UK
- France
- Germany
- Italy
- Spain
- Russia
- Rest of Europe
- Asia Pacific
- China
- Japan
- South Korea
- India
- Australia
- Southeast Asia
- Rest of Asia Pacific
- Latin America
- Brazil
- Argentina
- Rest of Latin America
- Middle East
- GCC Countries
- Israel
- Turkey
- Rest of Middle East
- Africa
- South Africa
- Egypt
- Rest of Africa
Competitive Landscape
The Lambert-Eaton Myasthenic Syndrome market is moderately consolidated, with a mix of established pharmaceutical leaders and emerging biopharma companies competing on innovation and therapeutic effectiveness. Key players such as Catalyst Pharmaceuticals, Grifols, Alexion Pharmaceuticals, argenx SE, and Takeda focus on developing advanced therapies, particularly cholinesterase inhibitors, potassium channel blockers, and immunotherapies, to strengthen their positions. Companies are leveraging orphan drug designations, regulatory incentives, and clinical trial investments to accelerate product approvals and expand patient reach. Strategic partnerships, licensing agreements, and acquisitions remain common, enabling firms to broaden research pipelines and market access. The competitive environment is shaped by a strong emphasis on rare disease drug development, patient advocacy collaborations, and affordability initiatives. While Catalyst Pharmaceuticals maintains significant presence with FDA-approved therapies, newer entrants such as Immunovant and Prestige Biopharma are working to gain share through novel antibody-based treatments. Overall, innovation, pricing strategies, and regulatory support define the industry’s competitive dynamics.
Key Players
- Catalyst Pharmaceuticals, Inc.
- Grifols, S.A.
- Alexion Pharmaceuticals, Inc.
- argenx SE
- Immunovant, Inc.
- Ra Pharmaceuticals, Inc.
- Bausch Health Companies Inc.
- Jacobus Pharmaceutical Company, Inc.
- Takeda Pharmaceutical Company Limited
- Prestige Biopharma Limited
Recent Developments
- In February 2025, DyDo Pharma launched Firdapse (amifampridine) 10 mg tablets for LEMS in Japan.
- In May 2024, Catalyst Pharmaceuticals received FDA approval to expand the maximum daily dose of Firdapse for LEMS patients weighing over 45 kg, raising the limit from 80 mg to 100 mg.
- In March 2025, Lupin received tentative U.S. FDA approval for its generic version of Firdapse (amifampridine), pending patent resolution.
Report Coverage
The research report offers an in-depth analysis based on Type, Treatment Type, End-User, Drugs and Region. It details leading market players, providing an overview of their business, product offerings, investments, revenue streams, and key applications. Additionally, the report includes insights into the competitive environment, SWOT analysis, current market trends, as well as the primary drivers and constraints. Furthermore, it discusses various factors that have driven market expansion in recent years. The report also explores market dynamics, regulatory scenarios, and technological advancements that are shaping the industry. It assesses the impact of external factors and global economic changes on market growth. Lastly, it provides strategic recommendations for new entrants and established companies to navigate the complexities of the market.
Future Outlook
- Rising cancer prevalence will continue to increase paraneoplastic LEMS cases globally.
- Advancements in immunotherapies will enhance treatment effectiveness and adoption.
- Expanding orphan drug approvals will accelerate availability of innovative therapies.
- Increasing clinical trials will support pipeline growth and diversified treatment options.
- Hospitals will remain the primary centers for diagnosis and advanced care.
- Specialty clinics will expand their role in long-term disease management.
- Asia Pacific will emerge as the fastest-growing regional market with improved access.
- Patient advocacy initiatives will improve awareness and diagnosis rates in underserved regions.
- Strategic collaborations among pharmaceutical companies will strengthen global market penetration.
- Development of safer and less invasive therapies will drive higher patient adherence.
Request a Free Sample
Fill in your details and we'll send you a free sample report.
- Sample data tables & charts
- Research methodology
Need a Custom Version of This Report?
Tailor the scope, geography, or segments to your exact requirements.
- Custom geography or segment scope
- Direct access to our analyst team
Frequently Asked Questions
What is the current market size for Lambert-Eaton Myasthenic Syndrome Market, and what is its projected size in 2032?
At what Compound Annual Growth Rate is the Lambert-Eaton Myasthenic Syndrome Market projected to grow between 2025 and 2032?
Which Lambert-Eaton Myasthenic Syndrome Market segment held the largest share in 2024?
What are the primary factors fueling the growth of the Lambert-Eaton Myasthenic Syndrome Market?
Who are the leading companies in the Lambert-Eaton Myasthenic Syndrome Market?
Which region commanded the largest share of the Lambert-Eaton Myasthenic Syndrome Market in 2024?
Table of Content
Chapter 1. Report Introduction
- 1.1 Report Description & Purpose
- 1.1.1 Report Title & Market Definition
- 1.1.2 Unique Selling Propositions (USP) & Key Differentiators
- 1.1.3 Value Proposition for Stakeholders
- 1.2 Research Objectives
- 1.2.1 Market Sizing Objectives (Volume & Revenue)
- 1.2.2 Segmentation Objectives
- 1.2.3 Competitive Intelligence Objectives
- 1.2.4 Forecast & Scenario Objectives
- 1.3 Report Scope
- 1.3.1 Lambert-Eaton Myasthenic Syndrome Scope – Types & Subtypes Covered
- 1.3.2 Geographic Scope – Regions & Countries Covered
- 1.3.3 Historical Period, Base Year & Forecast Period (2024; forecast to 2032)
- 1.3.4 Inclusions & Exclusions
- 1.4 HS Code & Classification Framework
- 1.5 Currency, Units & Pricing Basis
- 1.6 Target Stakeholders
- 1.7 Limitations & Assumptions
Chapter 2. Executive Summary
- 2.1 Global Lambert-Eaton Myasthenic Syndrome Market Snapshot
- 2.1.1 Market Size – Historical (2024) & Forecast (2024-2032) (2024: USD 106.36 million → 2032: USD 175.07 million)
- 2.1.2 Volume & Revenue – Global Totals
- 2.1.3 Key Market Highlights – Top Five Facts
- 2.2 Lambert-Eaton Myasthenic Syndrome Market Segmentation Snapshot
- 2.2.1 Market Split by Region – 2024 vs. 2032
- 2.3 Competitive Snapshot
- 2.3.1 Top 10 Players by Revenue Share – 2024
- 2.3.2 Top 10 Players by Volume Share – 2024
- 2.3.3 Recent Strategic Developments (18-Month Summary)
- 2.4 Key Investment Highlights & Strategic Conclusions
Chapter 3. Lambert-Eaton Myasthenic Syndrome Market Dynamics & Industry Analysis
- 3.1 Market Overview & Context
- 3.1.1 Lambert-Eaton Myasthenic Syndrome Market Position in the Broader Automotive Value Chain
- 3.1.2 OEM vs. Replacement Market Dynamics
- 3.1.3 Market Maturity & Development Stage by Region
- 3.2 Lambert-Eaton Myasthenic Syndrome Market Drivers
- 3.3 Lambert-Eaton Myasthenic Syndrome Market Restraints & Challenges
- 3.4 Lambert-Eaton Myasthenic Syndrome Market Opportunities
- 3.5 Porter's Five Forces Analysis
- 3.5.1 Threat of New Entrants
- 3.5.2 Bargaining Power of Suppliers
- 3.5.3 Bargaining Power of Buyers
- 3.5.4 Threat of Substitutes
- 3.5.5 Competitive Rivalry – Intensity Assessment
- 3.6 Lambert-Eaton Myasthenic Syndrome Value Chain Analysis
- 3.6.1 Upstream – Raw Material/Input Suppliers
- 3.6.1.1 Raw Material/Input 1
- 3.6.1.2 Raw Material/Input 2
- 3.6.1.3 Raw Material/Input 3
- 3.6.2 Midstream – Production/Manufacturing/Service Delivery
- 3.6.2.1 Production/Process Overview
- 3.6.2.2 Key Facility Locations & Capacity by Manufacturer
- 3.6.3 Downstream – Distribution & End Consumer
- 3.6.3.1 Primary Channel – B2B/OEM
- 3.6.3.2 Secondary Channels – Dealer, Retail, Online, Direct
- 3.6.4 Value Chain Profitability Analysis
- 3.6.1 Upstream – Raw Material/Input Suppliers
- 3.7 PESTEL Analysis
- 3.7.1 Political Factors
- 3.7.2 Economic Factors
- 3.7.3 Social Factors
- 3.7.4 Technological Factors
- 3.7.5 Environmental Factors
- 3.7.6 Legal Factors
- 3.8 Lambert-Eaton Myasthenic Syndrome Supply Chain Analysis
- 3.8.1 Raw Material/Input Supply Risk Assessment
- 3.8.2 Manufacturing Concentration Risk (Geographic Exposure)
- 3.8.3 Trade Disruption Impact Analysis
- 3.9 Regulatory & Policy Landscape
Note: The regulatory and policy landscape section covers regulations based on their applicability to the market, Lambert-Eaton Myasthenic Syndrome category, geography, and scope of the study. Only regulatory frameworks with a material impact on operations, compliance, trade, sustainability, or market access are analyzed in detail.
Chapter 4. Key Investment Pockets & Opportunity Analysis
- 4.1 Lambert-Eaton Myasthenic Syndrome Market Attractiveness Analysis
- 4.1.1 By Region – Investment Attractiveness Matrix (Volume × CAGR)
- 4.2 Absolute Revenue Growth Opportunity
- 4.2.1 By Region – Absolute USD Growth Through 2032
- 4.3 Incremental Volume Opportunity
- 4.3.1 By Region – Incremental Volume Through 2032
- 4.3.2 Segment – Incremental Volume
- 4.4 Emerging Submarket Opportunity Deep Dive (Subject to Applicability)
- 4.5 Emerging Market Opportunity Scorecards
- 4.5.1 United States
- 4.5.2 Europe
- 4.5.3 Asia
- 4.5.4 Middle East & Africa
Note: Emerging Market Opportunity Scorecards will be included based on relevance and strategic importance. Regions listed are indicative and may vary depending on data availability and market dynamics.
Chapter 5. Lambert-Eaton Myasthenic Syndrome Import-Export Analysis & Trade Flows
- 5.1 Global Trade Overview
- 5.1.1 Global Export Value by Country (2024)
- 5.1.2 Global Export Volume by Country (2024)
- 5.1.3 Global Import Value by Country (2024)
- 5.1.4 Global Import Volume by Country (2024)
- 5.1.5 Net Trade Balance by Country (2024)
- 5.2 Export Analysis – Segment
- 5.2.1 Type 1 (HS Code)
- 5.2.2 Type 2 (HS Code)
- 5.2.3 Type 3 (HS Code)
- 5.2.4 Type 4 (HS Code)
- 5.2.5 Type 5 (HS Code)
- 5.3 Import Analysis – Segment
- 5.3.1 Type 1 (HS Code)
- 5.3.2 Type 2 (HS Code)
- 5.3.3 Type 3 (HS Code)
- 5.3.4 Type 4 (HS Code)
- 5.3.5 Type 5 (HS Code)
- 5.4 Average Unit Trade Prices
- 5.4.1 Average Export Price – Segment & Country
- 5.4.2 Average Import Price – Segment & Source Country
- 5.4.3 Price Trends (2024)
- 5.5 Key Trade Route Analysis
- 5.5.1 Trade Route 1
- 5.5.2 Trade Route 2
- 5.5.3 Trade Route 3
- 5.5.4 Trade Route 4
- 5.5.5 Trade Route 5
- 5.6 Trade Policy Impact Assessment
- 5.6.1 US Anti-Dumping & Section 301 Tariffs
- 5.6.2 EU Customs Union Impact
- 5.6.3 Major Free Trade Agreements
- 5.6.4 USMCA Rules of Origin
Note: Trade policy analysis will be included only where relevant to the Lambert-Eaton Myasthenic Syndrome market.
Chapter 6. Competitive Landscape & Company Benchmarking
- 6.1 Lambert-Eaton Myasthenic Syndrome Market Concentration & Structure
- 6.1.1 Herfindahl-Hirschman Index (HHI) – vs. 2024
- 6.1.2 Tier 1, Tier 2 & Tier 3 Market Structure
- 6.1.3 Global, Regional & Local Player Dynamics
- 6.2 Lambert-Eaton Myasthenic Syndrome Market Share Analysis – 2024
- 6.2.1 Global Revenue Share by Company
- 6.2.2 Global Volume Share by Company
- 6.2.3 Regional Revenue Share
- 6.2.4 Market Share Evolution ( vs. 2024)
- 6.2.5 OEM Segment Share by Company
- 6.2.6 Replacement Segment Share by Company
- 6.3 Production/Delivery Capacity & Facility Analysis
- 6.3.1 Global Installed Capacity
- 6.3.2 Capacity Utilization Rates
- 6.3.3 Production/Output Volume
- 6.3.4 Facility Locations & Capacity Map
- 6.3.5 Planned Capacity Additions
- 6.4 Lambert-Eaton Myasthenic Syndrome Competitive Benchmarking Matrix
- 6.4.1 Revenue, Volume, CAGR & Profitability Comparison
- 6.4.2 Channel Revenue Mix
- 6.4.3 Geographic Revenue Exposure
- 6.4.4 R&D Intensity
- 6.4.5 Sustainability Maturity
- 6.5 Strategic Developments in Lambert-Eaton Myasthenic Syndrome (Last 24 Months)
- 6.5.1 Mergers, Acquisitions & Divestments
- 6.5.2 New Lambert-Eaton Myasthenic Syndrome Launches
- 6.5.3 Facility Expansions
- 6.5.4 Strategic Alliances, Joint Ventures & Partnerships
- 6.5.5 Distribution Expansion & Market Entry
- 6.5.6 Sustainability & ESG Initiatives
- 6.6 Competitive Strategy Mapping
- 6.6.1 Leader, Challenger, Follower & Niche Classification
- 6.6.2 Pricing Strategy Comparison
- 6.6.3 Channel Strategy Matrix
Note: Strategic developments are included based on their materiality and the availability of reliable information.
Chapter 7. Global Lambert-Eaton Myasthenic Syndrome Market – By Distribution Channel
- 7.1 Segment Overview
- 7.1.1 Volume & Revenue Split by Channel (2024 & 2032)
- 7.1.2 Channel Mix Evolution (2024-2032)
Chapter 8. Regional Market Analysis – Global Overview
- 8.1 Global Regional Overview
- 8.1.1 Regional Volume Share
- 8.1.2 Regional Revenue Share
- 8.1.3 Regional Volume by Region
- 8.1.4 Regional Revenue by Region
- 8.1.5 Regional Forecast Through 2032
- 8.2 Cross-Regional Segment Analysis
- 8.2.1 By Distribution Channel
- 8.2.2 By Brand/Price Tier
Chapter 9. North America Lambert-Eaton Myasthenic Syndrome Market
- 9.1 United States
- 9.2 Canada
- 9.3 Mexico
Chapter 10. Europe Lambert-Eaton Myasthenic Syndrome Market
- 10.1 Germany
- 10.2 France
- 10.3 Italy
- 10.4 United Kingdom
- 10.5 Spain
- 10.6 Poland
- 10.7 Russia
- 10.8 Netherlands
- 10.9 Belgium
- 10.10 Sweden
- 10.11 Denmark
- 10.12 Norway
- 10.13 Rest of Europe
Chapter 11. Asia Pacific Lambert-Eaton Myasthenic Syndrome Market
- 11.1 China
- 11.2 India
- 11.3 Japan
- 11.4 South Korea
- 11.5 Thailand
- 11.6 Indonesia
- 11.7 Vietnam
- 11.8 Malaysia
- 11.9 Australia
- 11.10 Rest of Asia Pacific
Chapter 12. Latin America Lambert-Eaton Myasthenic Syndrome Market
- 12.1 Brazil
- 12.2 Argentina
- 12.3 Colombia
- 12.4 Chile
- 12.5 Rest of Latin America
Chapter 13. Middle East Lambert-Eaton Myasthenic Syndrome Market
- 13.1 Saudi Arabia
- 13.2 United Arab Emirates
- 13.3 Turkey
- 13.4 Israel
- 13.5 Iran
- 13.6 Rest of the Middle East
Chapter 14. Africa Lambert-Eaton Myasthenic Syndrome Market
- 14.1 South Africa
- 14.2 Egypt
- 14.3 Nigeria
- 14.4 Morocco
- 14.5 Rest of Africa
Chapter 15. Lambert-Eaton Myasthenic Syndrome Company Profiles
- 15.1 [Company 01]
- 15.1.1 Company Overview
- 15.1.2 Key Management Personnel
- 15.1.3 Products & Services Portfolio
- 15.1.4 Financial Performance
- 15.1.5 Key Market Focus & Geographic Presence
- 15.1.6 Recent Developments & Strategic Initiatives
Note: The company profile list is preliminary and may change based on research findings, market developments, data availability, and client requirements.
Chapter 16. Appendices
- Appendix A – List of Abbreviations & Acronyms
- Appendix B – Industry Classification Code Reference – Full Series
- Appendix C – Production & Capacity Data Tables
- Appendix D – End-Use & Demand Base Tables
- Appendix E – Consumption & Replacement Rate Assumptions
- Appendix F – ASP Reference Tables
- Appendix G – Manufacturing & Facility Database
- Appendix H – Import-Export Data Tables
- Appendix I – Regulatory Summary Tables
- Appendix J – Primary Research Participant List (Anonymized)
- Appendix K – Primary Research Questionnaire Framework
- Appendix L – Data Sources & Bibliography
- Appendix M – Market Size Divergence & Source Comparison
Chapter 17. Research Methodology
- 17.1 Research Framework & Philosophy
- 17.2 Secondary Research – Sources, Hierarchy & Data Extraction
- 17.3 Data Modeling – Bottom-Up & Top-Down Market Sizing
- 17.4 Primary Research – Stakeholder Framework, LOI & Sample Sizes
- 17.5 Forecast Methodology – Regression, Scenario & Sensitivity Analysis
- 17.6 Quality Control – Four-Layer Validation Framework
- 17.7 Limitations & Standard Assumptions
- 17.8 Disclaimer
