Market Overview
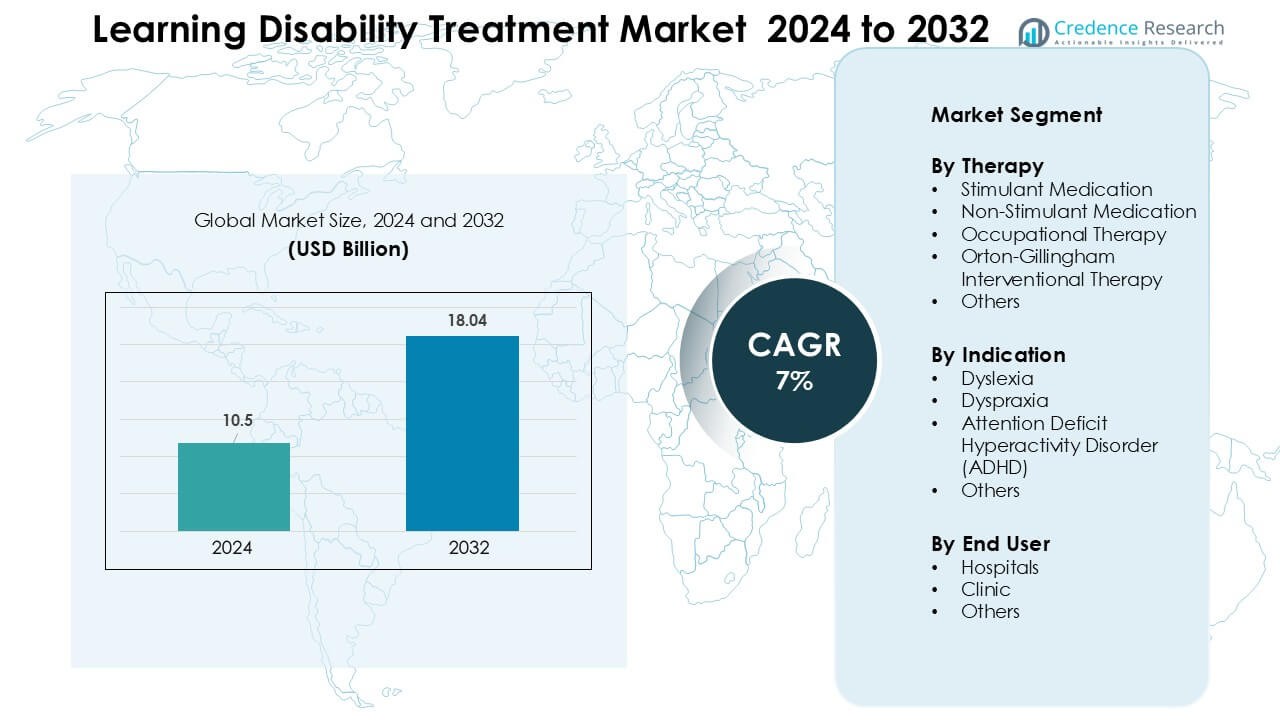
Learning Disability Treatment Market was valued at USD 10.5 billion in 2024 and is anticipated to reach USD 18.04 billion by 2032, growing at a CAGR of 7 % during the forecast period.
| REPORT ATTRIBUTE |
DETAILS |
| Historical Period |
2020-2023 |
| Base Year |
2024 |
| Forecast Period |
2025-2032 |
| Learning Disability Treatment Market Size 2024 |
USD 10.5 Billion |
| Learning Disability Treatment Market, CAGR |
7% |
| Learning Disability Treatment Market Size 2032 |
USD 18.04 Billion |
The Learning Disability Treatment Market includes leading companies such as Ginger Software, Inc., Oticon, Youth Living Skills, Sight and Sound Technology, Sensory, Inc., Sonova Group, Adaptive Tech Solutions, LLC, Koninklijke Philips N.V., Speech Therapy Work, and Vocalect Biometric Solutions. These players compete through advanced assistive technologies, digital therapy solutions, speech-language tools, and cognitive-training platforms designed for dyslexia, ADHD, and dyspraxia support. Many firms expand reach through school partnerships and remote-therapy integration, strengthening global adoption. North America remained the leading region in 2024 with about 38% share, driven by strong clinical infrastructure, early screening programs, and broad insurance coverage.
Access crucial information at unmatched prices!
Request your sample report today & start making informed decisions powered by Credence Research Inc.!
Download Sample
Market Insights
- The Learning Disability Treatment Market was valued at USD5 billion in 2024 and is set to reach USD 18.04 billion by 2032, growing at a CAGR of 7%.
- Demand grows as rising diagnosis rates, school-level screening, and early interventions increase therapy uptake, with stimulant medication holding the largest share at about 48%.
- Digital learning tools, AI-based assessments, and remote therapy platforms shape new trends, improving access for dyslexia, ADHD, and dyspraxia management.
- Leading players strengthen the market through advanced assistive technologies and therapy solutions, while high treatment costs and limited specialist availability remain key restraints.
- North America led the market in 2024 with about 38% share, followed by Europe at roughly 30% and Asia-Pacific at 23%, supported by strong diagnostic infrastructure and expanding school-based intervention programs.
Market Segmentation Analysis:
By Therapy
Stimulant medication held the largest share in 2024 with about 48% due to strong use in managing ADHD symptoms and wide clinical acceptance. These medicines offered quick symptom control, which supported high adoption among pediatric and adolescent groups. Non-stimulant drugs grew at a steady pace as parents sought safer options for long-term treatment. Occupational therapy also expanded as early-intervention programs increased across schools. Orton-Gillingham therapy gained traction in dyslexia programs, while other behavioral therapies supported care in mixed learning disorders.
- For instance, education guidelines promoting multi-sensory and structured reading instruction including Orton-Gillingham based methods are cited in national special-education curricula as official options for addressing learning disabilities.
By Indication
ADHD dominated the indication segment in 2024 with nearly 52% share because of high global diagnosis rates and broader screening in school-aged children. Rising clinical awareness and updated pediatric guidelines pushed faster identification, which supported treatment uptake. Dyslexia remained a strong secondary segment as structured literacy programs expanded in North America and Europe. Dyspraxia adoption grew with wider use of motor-skill training. Other learning disorders showed limited demand but grew gradually through early-childhood intervention programs.
- For instance, Akili Interactive’s FDA-authorized digital therapeutic EndeavorRx was evaluated in a pivotal randomized controlled trial that enrolled 348 children aged 8–12 (STARS-ADHD) and the full clinical program evaluated over 600 children across five studies; those trials were used to support its regulatory authorization and real-world rollout.
By End User
Hospitals led the end-user segment in 2024 with around 44% share due to strong access to multidisciplinary teams and advanced diagnostic setups. Many children received initial evaluation in hospital-based pediatric neurology and psychiatry units, which increased throughput. Clinics followed closely as private therapy centers expanded in urban regions. These centers offered faster appointments and personalized therapy plans, supporting higher adoption. Other settings, including community centers and school-based programs, grew as governments increased funding for inclusive education and early-intervention frameworks.
Key Growth Drivers
Rising Diagnosis Rates and Early-Screening Programs
Growing awareness of learning disorders has pushed countries to expand school-level screening and early assessment programs. Teachers and pediatricians now identify reading, attention, and motor-skill difficulties at earlier ages, which increases treatment demand. National guidelines in the U.S., U.K., Canada, and Australia promote early referrals, helping more children access structured therapy and medication support. Wider use of digital assessment tools also speeds evaluation and improves accuracy. This shift encourages families to seek timely intervention, which boosts adoption across stimulant drugs, non-stimulant therapies, and structured literacy programs. As screening expands in developing regions, the treatment pipeline continues to rise.
- For instance, a 2022 study of 1,118 primary-school students found that 60 children (5.4%) screened positive for possible Attention‑Deficit/Hyperactivity Disorder (ADHD) on a teacher-completed screening scale (SNAP-IV), while 30 children (2.7%) screened positive via the parent version yielding a combined positive screening rate of 6.8%.
Increasing Adoption of Evidence-Based Therapies
The demand for evidence-backed treatment models continues to grow as schools, clinics, and hospitals prioritize proven outcomes. Structured literacy methods and behavioral therapies show strong improvements in reading, attention, and executive-function skills, driving their preference among parents and clinicians. Programs such as Orton-Gillingham and occupational therapy gain traction because they align with global education standards. More pediatric neurologists and psychologists now recommend multimodal treatment, combining medication with therapy for stronger long-term progress. Rising publication of clinical data and global expansion of practitioner training programs further strengthen adoption. This reinforces a more standardized and science-driven treatment environment.
- For instance, OG’s multisensory, structured-language curriculum has been widely adopted in structured-literacy programs globally, and is promoted as a key method to help individuals with dyslexia or reading difficulties through explicit instruction in phoneme-grapheme correspondence.
Expansion of Insurance Coverage and Funding Support
Broader insurance coverage for ADHD, dyslexia, and dyspraxia treatment supports market growth by lowering financial barriers. Many public and private insurers now reimburse behavioral therapy, structured literacy intervention, and medication plans. Governments in North America and Europe also invest in special-education resources, increasing access to therapy inside schools. Funding for inclusive education programs encourages earlier referrals and higher treatment continuity. Clinics and hospitals gain financial support to expand therapy capacity, which improves service availability. As coverage strengthens in emerging economies, families benefit from reduced out-of-pocket spending, supporting wider demand for long-term learning-disability care.
Key Trends & Opportunities
Growth of Digital and AI-Based Therapeutic Tools
AI-enabled learning platforms and digital therapeutic apps are transforming how children receive support for dyslexia, ADHD, and dyspraxia. These tools offer personalized learning paths, adaptive reading exercises, attention-training modules, and remote monitoring features. Parents prefer these solutions due to home accessibility and lower engagement cost. Schools use them to supplement traditional therapy with data-driven progress tracking. Clinicians gain real-time insight into attention patterns and reading speed, improving treatment planning. As digital platforms partner with clinics and education systems, hybrid therapy models become the norm, creating strong adoption opportunities.
- For instance, a 2025 scoping review identified that over 80 peer-reviewed studies (out of 683 unique articles) already explore AI applications for dyslexia education including early detection, personalised learning interventions, speech- and reading-support tools, and neuroimaging-based diagnosis support.
Rising Integration of Multidisciplinary Care Models
Global healthcare systems increasingly adopt multidisciplinary treatment approaches that combine pediatric neurology, psychology, occupational therapy, and special-education support. These models improve diagnostic accuracy and deliver more coordinated care for children with complex learning needs. Schools are expanding collaboration with clinicians, enabling integrated learning plans that track cognitive, behavioral, and academic progress. This trend strengthens demand for combined therapy packages and long-term follow-ups. Multidisciplinary centers also attract funding from NGOs and government programs, supporting capacity building. As demand grows, integrated care pathways create new opportunities for specialized clinics and digital-therapy partners.
- For instance, a 2023 study of children with Attention-Deficit/Hyperactivity Disorder (ADHD) demonstrated that a multimodal integrated intervention combining medical treatment with behavioral and occupational therapy significantly improved long-term outcomes compared to single-modality treatment.
Key Challenges
Shortage of Skilled Therapists and Trained Professionals
A major challenge lies in the global shortage of trained specialists such as occupational therapists, speech-language pathologists, special-education instructors, and dyslexia-focused practitioners. Many regions lack standardized training programs, which limits therapy availability and increases waiting times. Rural areas experience the greatest gaps, forcing families to rely on incomplete or irregular treatment. The scarcity also increases therapy costs, limiting access for low-income groups. Clinics face staffing constraints that restrict patient throughput and slow adoption of evidence-based interventions. Without workforce expansion, treatment demand may outpace capacity in several countries.
High Treatment Costs and Limited Access in Low-Income Regions
Learning-disability treatment often requires long-term intervention, frequent therapy sessions, and periodic reassessment, which raises overall cost. Many countries lack comprehensive insurance coverage, increasing the financial burden on families. High prices for structured literacy programs, digital tools, and specialized evaluations further widen care inequality. In low-income regions, limited clinic availability and poor funding for special-education programs hinder early diagnosis and treatment. These barriers slow adoption of both medication and therapy, reducing overall market penetration. Addressing affordability and expanding subsidized care remain critical to improving global access.
Regional Analysis
North America
North America held the largest share in 2024 with about 38% due to strong diagnostic infrastructure, high awareness, and broad insurance coverage for ADHD, dyslexia, and dyspraxia treatment. Hospitals and clinics benefit from advanced assessment tools and strong availability of trained therapists. Schools follow structured intervention guidelines, which raise therapy uptake. High spending on pediatric mental health and wider use of digital therapeutic tools further support market expansion. The region also leads in research activity, improving treatment standardization and early-screening reach.
Europe
Europe accounted for nearly 30% share in 2024 driven by strong government support for inclusive education and well-established clinical pathways for learning disability management. Countries such as the U.K., Germany, and the Netherlands invest in structured literacy programs and therapy integration within public schools. High clinical awareness and well-trained occupational and behavioral therapists boost adoption. Reimbursement coverage for ADHD treatment and speech-language therapy also supports growth. Increased demand for multidisciplinary care centers and digital learning platforms strengthens the regional landscape.
Asia-Pacific
Asia-Pacific captured around 23% share in 2024 and showed the fastest growth due to rising awareness, expanding urban healthcare infrastructure, and growing diagnosis rates. Countries such as China, India, Japan, and Australia increase investment in child-development programs and special-education systems. Private clinics grow rapidly in major cities, offering structured therapy and medication support. Digital learning platforms gain popularity, helping families access early intervention solutions. Despite regional disparities, improving school screening programs and government-backed child-health initiatives drive strong expansion.
Latin America
Latin America held about 6% share in 2024, supported by expanding access to pediatric care and growing recognition of learning disorders in urban areas. Brazil, Mexico, and Argentina lead adoption through private clinics and school-based screening programs. Availability of trained therapists remains limited, but digital platforms help bridge gaps in underserved regions. Awareness campaigns by NGOs and education ministries encourage early assessment. Although cost barriers persist, gradual improvements in insurance coverage and growing demand for structured therapy strengthen market potential.
Middle East & Africa
The Middle East & Africa region accounted for nearly 3% share in 2024 due to limited specialist availability and lower awareness about learning disabilities. Adoption grows in the UAE, Saudi Arabia, and South Africa as private clinics expand and schools introduce early screening programs. High out-of-pocket costs restrict access for many families, but government-led child-development initiatives are improving service reach. Digital learning tools gain attention as a low-cost alternative. With rising investment in pediatric and developmental healthcare, the region shows steady long-term potential.
Market Segmentations:
By Therapy
- Stimulant Medication
- Non-Stimulant Medication
- Occupational Therapy
- Orton-Gillingham Interventional Therapy
- Others
By Indication
- Dyslexia
- Dyspraxia
- Attention Deficit Hyperactivity Disorder (ADHD)
- Others
By End User
By Geography
- North America
- Europe
- Asia Pacific
- Latin America
- Middle East
- Africa
Competitive Landscape
The Learning Disability Treatment Market features established and emerging players such as Ginger Software, Inc., Oticon, Youth Living Skills, Sight and Sound Technology, Sensory, Inc., Sonova Group, Adaptive Tech Solutions, LLC, Koninklijke Philips N.V., Speech Therapy Work, and Vocalect Biometric Solutions. These companies advance the market through diagnostic tools, therapy platforms, assistive technologies, and medication-related support solutions. Leading firms strengthen their competitiveness by investing in AI-driven learning tools, digital speech-language therapy, and personalized reading-intervention software. Partnerships with schools, hospitals, and clinics help expand service reach and improve early intervention outcomes. Several players also focus on accessibility solutions tailored for dyslexia, ADHD, dyspraxia, and mixed learning disorders. Innovation in remote therapy, screening apps, and cognitive-training software continues to shape market growth and widens adoption across developed and emerging regions.
Shape Your Report to Specific Countries or Regions & Enjoy 30% Off!
Key Player Analysis
- Ginger Software, Inc.
- Oticon
- Youth Living Skills
- Sight and Sound Technology
- Sensory, Inc.
- Sonova Group
- Adaptive Tech Solutions, LLC
- Koninklijke Philips N.V.
- Speech Therapy Work
- Vocalect Biometric Solutions
Recent Developments
- In July 2025, Sensory, Inc awarded the 2025 Voice AI Technology Excellence Award for its on-device speech-to-text engine TrulyNatural, highlighting Sensory’s push to deliver private, low-latency speech solutions that are being adopted in education and assistive tech (important for reading/learning supports).
- In 2024, Koninklijke Philips N.V. researchers published new clinical validation data for the IntelliSpace Cognition digital assessment platform in Frontiers in Psychology. The study showed that the tablet-based battery, which includes memory and learning tests such as the Rey Auditory Verbal Learning Test, can sensitively distinguish mild cognitive impairment from normal aging, supporting its use for digital cognitive screening. This strengthens the evidence base for AI-enabled assessments that can be adapted to educational and clinical settings dealing with learning and memory difficulties, indirectly supporting the learning disability treatment landscape.
- In 2024, Oticon unveiled its Oticon Intent hearing-aid family (introduced at the Oticon Next event in February 2024), a major product refresh that emphasizes improved connectivity, AI-driven sound processing and features aimed at better speech understanding capabilities that are often used in assistive-listening and auditory-processing support for people with learning / processing challenges. Oticon’s product rollout and conference activity in 2024 reinforced its positioning as a supplier of assistive listening solutions used by clinicians working with learning-disabled populations.
Report Coverage
The research report offers an in-depth analysis based on Therapy, Indication, End-User and Geography. It details leading market players, providing an overview of their business, product offerings, investments, revenue streams, and key applications. Additionally, the report includes insights into the competitive environment, SWOT analysis, current market trends, as well as the primary drivers and constraints. Furthermore, it discusses various factors that have driven market expansion in recent years. The report also explores market dynamics, regulatory scenarios, and technological advancements that are shaping the industry. It assesses the impact of external factors and global economic changes on market growth. Lastly, it provides strategic recommendations for new entrants and established companies to navigate the complexities of the market.
Future Outlook
- Demand for early diagnosis will rise as schools expand screening programs.
- Digital therapy and AI-based learning tools will gain wider clinical acceptance.
- Structured literacy programs will see higher adoption in dyslexia treatment.
- ADHD treatment will grow as more countries update pediatric guidelines.
- Multidisciplinary care models will expand across hospitals and clinics.
- Remote therapy platforms will support access in rural and low-resource regions.
- Partnerships between schools and healthcare providers will increase.
- Insurance coverage for behavioral and occupational therapy will broaden.
- Training programs for therapists and educators will expand to address skill gaps.
- Emerging markets will see stronger growth as awareness and funding improve.


