
Market Overview:
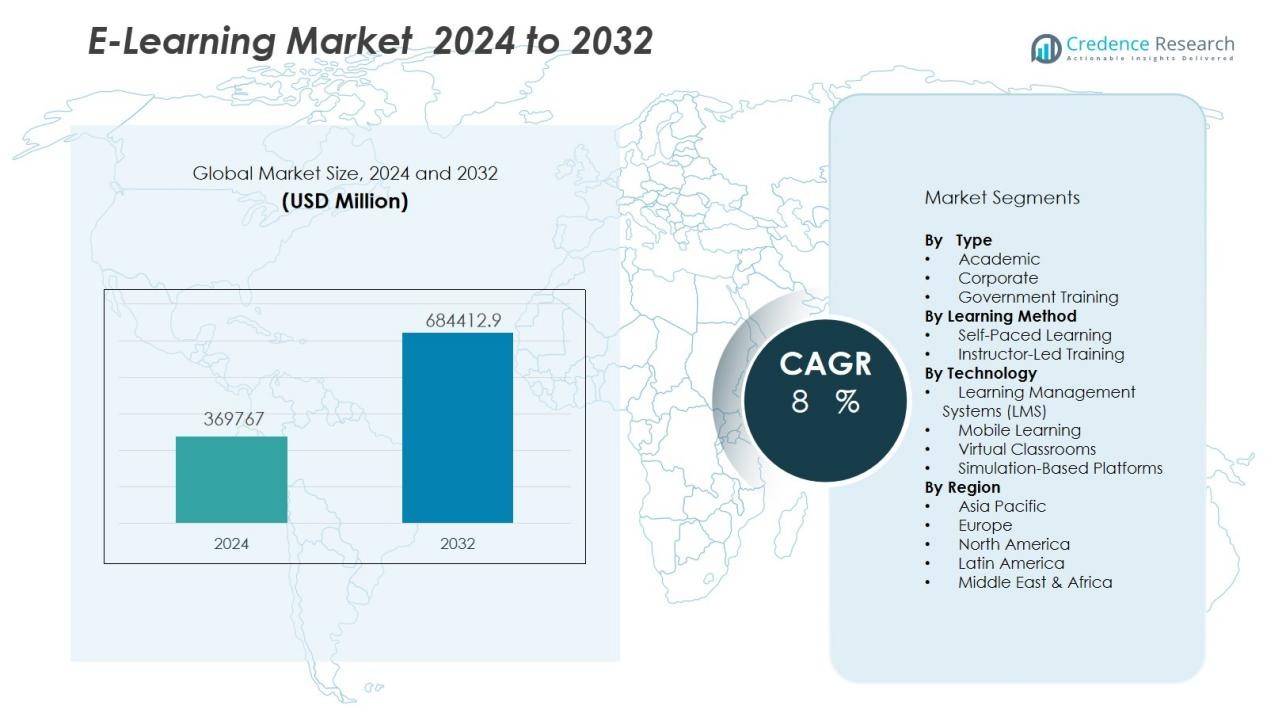
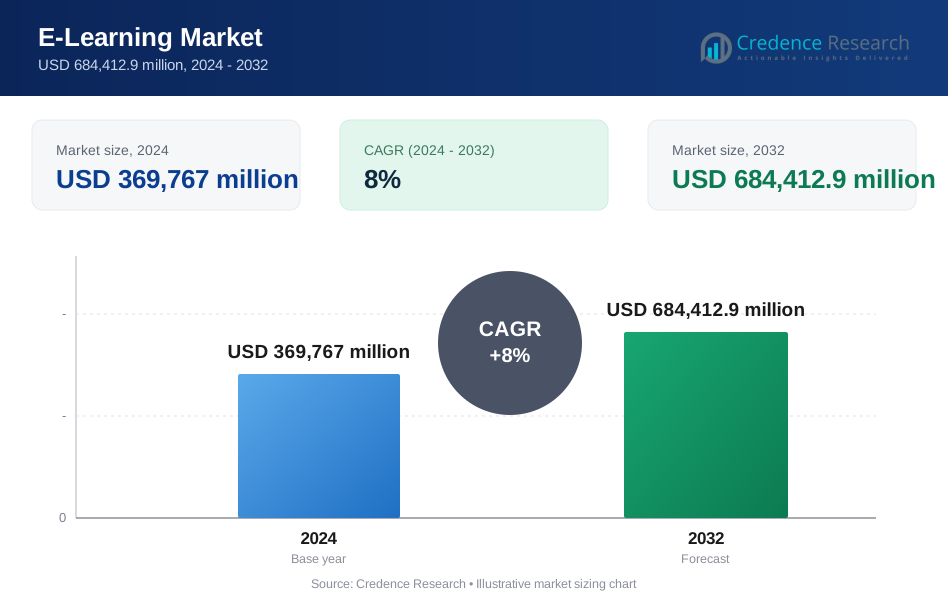
The e learning market size was valued at USD 369767 million in 2024 and is anticipated to reach USD 684412.9 million by 2032, at a CAGR of 8% during the forecast period (2024-2032).
| REPORT ATTRIBUTE | DETAILS |
|---|---|
| Historical Period | 2020-2024 |
| Base Year | 2024 |
| Forecast Period | 2025-2032 |
| E-Learning Market Size 2024 | USD 369767 Million |
| E-Learning Market, CAGR | 8% |
| E-Learning Market Size 2032 | USD 684412.9 Million |
Market growth is driven by the rising demand for flexible, accessible, and cost-effective learning solutions, particularly in the wake of remote learning trends accelerated by the COVID-19 pandemic. Increasing corporate focus on employee upskilling, integration of AI, AR/VR, and gamification into training modules, and the growing popularity of microlearning are further propelling adoption. Government initiatives promoting digital education, coupled with the expansion of 5G connectivity, are also enhancing engagement and content delivery efficiency.
Regionally, North America holds a leading share of the e-learning market due to mature technological infrastructure, high corporate training investments, and strong EdTech adoption. Asia-Pacific is expected to witness the fastest growth, driven by large student populations, expanding internet access in emerging economies, and government-led digital education programs. Europe shows steady growth, supported by strong corporate learning initiatives and multilingual content development.
Market Insights:
- The e-learning market was valued at USD 369,767 million in 2024 and is projected to reach USD 684,412.9 million by 2032, growing at a CAGR of 8% from 2024 to 2032.
- Rising demand for flexible, accessible, and cost-effective education solutions is a key growth driver, supported by the shift toward remote and hybrid learning models.
- Technological advancements such as AI, AR/VR, and adaptive learning systems are enhancing personalization, engagement, and learning outcomes.
- Corporate investments in workforce upskilling and reskilling are accelerating adoption, with scalable e-learning platforms enabling cost-efficient global training.
- Government-led digital literacy programs, broadband expansion, and 5G deployment are improving accessibility, especially in underserved regions.
- North America holds 38.2% market share in 2024, followed by Asia-Pacific at 29.7% and Europe at 23.5%, reflecting strong regional adoption trends.
- Challenges such as uneven digital infrastructure, high equipment costs, and content quality issues remain, prompting providers to focus on innovation and localized solutions.
Market Drivers:
Growing Demand for Flexible and Accessible Learning Solutions:
The e-learning market benefits from a rising preference for education that can be accessed anytime and anywhere. Students, professionals, and organizations seek alternatives to traditional classroom settings to accommodate busy schedules and diverse learning needs. Digital platforms enable self-paced learning, offering interactive content and multimedia resources. It allows learners to revisit material, track progress, and customize their study approach. This flexibility has made online learning an integral part of both academic and professional training environments.
- For instance, Coursera achieved remarkable engagement milestones with 168.2 million registered learners by the end of 2024, representing a 19% year-over-year growth.
Advancements in Technology Enhancing Learning Experience:
Technological innovations such as artificial intelligence, virtual reality, augmented reality, and adaptive learning systems are transforming the e-learning market. These tools personalize content delivery, improve engagement, and create immersive learning environments. It enables real-time feedback, skill assessment, and data-driven progress tracking. Cloud-based platforms and mobile learning applications also expand accessibility. These advancements have made e-learning a more effective and engaging alternative to conventional methods.
- For instance, Docebo’s AI-powered e-learning platform enabled CSI to scale training for over 24,000 bankers with automated reporting and predictive analytics, cutting administrative tasks by more than 50%.
Corporate Focus on Workforce Upskilling and Reskilling:
Organizations are increasingly adopting e-learning solutions to enhance workforce skills and maintain competitive advantage. It offers cost-effective training modules that can be deployed across multiple locations simultaneously. Companies use online learning for onboarding, compliance training, leadership development, and technical skill enhancement. The scalability of these programs reduces training costs and improves knowledge retention. This demand from the corporate sector continues to be a major growth driver.
Government Initiatives and Expanding Digital Infrastructure:
Government policies promoting digital literacy and online education significantly strengthen the e-learning market. Investments in broadband expansion, 5G networks, and affordable devices increase access to digital platforms. It supports educational institutions in delivering high-quality online programs to wider audiences. Public-private partnerships foster innovation and encourage EdTech adoption in schools and universities. These initiatives ensure that digital education reaches underserved regions, expanding the market’s growth potential.
Market Trends:
Integration of Immersive Technologies and AI-Driven Personalization:
The e-learning market is witnessing rapid adoption of immersive technologies such as virtual reality (VR) and augmented reality (AR) to create interactive and engaging educational experiences. These tools simulate real-world scenarios, enabling learners to practice skills in safe, controlled environments. Artificial intelligence plays a key role in delivering personalized learning paths, adaptive assessments, and automated feedback. It analyzes learner behavior to recommend relevant content and optimize progress. Institutions and corporations are investing in AI-powered platforms to improve learning outcomes and engagement rates. This technological integration is reshaping digital education, making it more dynamic and learner-centric.
- For instance, zSpace’s AR/VR platform is deployed in over 3 500 U.S. school districts—including 80% of the largest by enrollment—and has expanded to 50+ countries.
Rising Popularity of Microlearning and Mobile-First Platforms:
Short, focused learning modules are gaining traction across the e-learning market due to their ability to enhance retention and accommodate busy schedules. Microlearning content is often delivered via mobile devices, allowing learners to access training materials on demand. It supports just-in-time learning, which is valuable for skill-based training and professional development. Mobile-first platforms are prioritizing responsive design, intuitive interfaces, and offline accessibility to reach broader audiences. The growing preference for learning on smartphones and tablets aligns with the global shift toward mobile internet usage. This trend is expanding the reach of e-learning solutions and reinforcing their role in both academic and corporate training.
- For instance, Walmart rolled out mobile-first microlearning via Axonify to more than 75,000 employees across over 150 distribution centers, achieving a 54% reduction in recordable safety incidents.
Market Challenges Analysis:
Limited Digital Infrastructure and Accessibility Gaps:
The e-learning market faces challenges in regions with inadequate internet connectivity and limited access to digital devices. Rural and low-income areas often lack the bandwidth required for seamless online learning. It restricts participation in interactive and multimedia-rich courses, creating a digital divide. Educational institutions and governments are working to bridge this gap, but infrastructure development remains uneven. High equipment costs further limit adoption among disadvantaged populations. These disparities hinder the market’s ability to achieve universal accessibility.
Content Quality, Engagement, and Learner Retention Issues:
Maintaining high-quality, engaging content is critical for the e-learning market, yet it remains a challenge for many providers. Learners may lose interest if courses lack interactivity, practical application, or regular feedback. It becomes harder to ensure consistent engagement without face-to-face interaction. Poor instructional design and outdated materials can reduce knowledge retention and completion rates. Providers must continuously update content and leverage analytics to enhance learning outcomes. Addressing these factors is essential for sustaining user satisfaction and long-term adoption.
Market Opportunities:
Expansion into Emerging Markets and Underserved Regions:
The e-learning market holds significant potential in emerging economies where internet penetration and smartphone adoption are increasing rapidly. Governments and private organizations are investing in digital education infrastructure to reach rural and underserved communities. It creates opportunities for providers to develop localized content and offer affordable subscription models. Multilingual platforms and culturally relevant materials can further enhance adoption. The growing youth population in these regions represents a vast pool of potential learners. Strategic partnerships with local institutions can accelerate market penetration and brand recognition.
Growth in Corporate Training and Lifelong Learning Programs:
Organizations are expanding investment in digital training platforms to support workforce upskilling and reskilling initiatives. The e-learning market benefits from the demand for flexible, on-demand training that aligns with evolving job requirements. It enables companies to deliver consistent, scalable learning experiences across global operations. The rise of lifelong learning culture encourages professionals to pursue certifications and micro-credentials online. Sectors such as healthcare, IT, and finance are driving demand for specialized digital courses. Providers that offer industry-specific training with measurable outcomes are well-positioned to capture this growth.
Market Segmentation Analysis:
By Type:
The e-learning market by type includes academic, corporate, and government training segments. Academic e-learning dominates due to growing adoption in schools, universities, and professional courses. Corporate e-learning is expanding with increased investment in employee upskilling and compliance training. Government training programs leverage digital platforms for large-scale workforce development and public education initiatives. Each segment benefits from scalable delivery, cost efficiency, and performance tracking capabilities.
- For instance, Dow Chemical converted its training to online platforms, saving $34million in one year and reducing learning expenses from $95 to $11 per learner per course.
By Learning Method:
Learning methods include self-paced and instructor-led formats. Self-paced learning holds a significant share due to its flexibility and learner control over content consumption. Instructor-led training remains essential for interactive sessions, group discussions, and specialized skill development. It is often blended with digital tools to enhance engagement and accessibility. Organizations and institutions are increasingly adopting hybrid models to combine the strengths of both approaches.
By Technology:
Technology segmentation covers learning management systems (LMS), mobile learning, virtual classrooms, and simulation-based platforms. LMS platforms remain central for course management, progress tracking, and assessment. Mobile learning is gaining rapid traction due to widespread smartphone use and demand for on-the-go access. Virtual classrooms enable real-time interaction and collaborative learning, while simulation tools support immersive, hands-on training experiences. It is driving the integration of AI, AR, and VR to further enhance learning outcomes.
- For instance, Labster surpassed 6 million learners across more than 100 countries.
Segmentations:
By Type:
- Academic
- Corporate
- Government Training
By Learning Method:
- Self-Paced Learning
- Instructor-Led Training
By Technology:
- Learning Management Systems (LMS)
- Mobile Learning
- Virtual Classrooms
- Simulation-Based Platforms
By Region:
- North America
- U.S.
- Canada
- Mexico
- Europe
- Germany
- France
- U.K.
- Italy
- Spain
- Rest of Europe
- Asia Pacific
- China
- Japan
- India
- South Korea
- South-east Asia
- Rest of Asia Pacific
- Latin America
- Brazil
- Argentina
- Rest of Latin America
- Middle East & Africa
- GCC Countries
- South Africa
- Rest of the Middle East and Africa
Regional Analysis:
North America :
North America holds 38.2% market share in the e-learning market in 2024, supported by advanced digital infrastructure and high internet penetration. The region benefits from strong corporate training demand, widespread adoption of learning management systems, and early integration of AI and immersive technologies. It has a mature EdTech ecosystem with major players offering diverse solutions for academic, corporate, and government sectors. Investments in personalized learning, microlearning platforms, and mobile-first solutions continue to grow. The United States leads the region with significant funding for digital education initiatives. Canada follows with increasing adoption in both K–12 and higher education institutions.
Asia-Pacific :
Asia-Pacific accounts for 29.7% market share in the e-learning market in 2024, driven by expanding internet connectivity and a large, tech-savvy student base. Countries such as China, India, and Japan are investing heavily in digital learning platforms and educational infrastructure. It benefits from a strong push toward government-led online education initiatives and private sector EdTech innovation. Rising smartphone penetration is enabling widespread access to mobile learning applications. Localized content in regional languages is improving engagement and retention. The region’s growth is further supported by increasing demand for professional certification and vocational training.
Europe :
Europe holds 23.5% market share in the e-learning market in 2024, supported by strong corporate learning investments and a focus on lifelong learning. The European Union promotes digital education policies that encourage collaboration between institutions and technology providers. It benefits from multilingual content availability, enabling cross-border training and education. The corporate sector drives adoption through compliance training, leadership development, and technical skill enhancement. Countries such as Germany, the UK, and France lead in integrating e-learning into national education systems. Steady demand from academic institutions and corporate enterprises ensures consistent market expansion.
Key Player Analysis:
- McGraw Hill
- IBM Corporation
- SAP SE
- upGrad Education Private Limited
- Adobe
- NIIT (USA) Inc.
- Docebo
- LinkedIn Corporation
- Coursera Inc.
- Udemy, Inc.
- BYJU’S edX LLC
- Udacity, Inc.
Competitive Analysis:
The e-learning market is highly competitive, with global players and specialized providers vying for market share through innovation, strategic partnerships, and diversified content offerings. Leading companies such as McGraw Hill, IBM Corporation, SAP SE, upGrad Education Private Limited, Adobe, NIIT (USA) Inc., Docebo, and LinkedIn Corporation leverage advanced technologies to enhance learning delivery and engagement. It emphasizes platform scalability, personalized learning, and integration of AI and immersive tools to meet diverse learner needs. Vendors compete by offering multilingual content, industry-specific training, and robust analytics capabilities. Strategic collaborations with academic institutions, corporations, and governments help expand reach and brand presence. The competitive landscape is also shaped by continuous product enhancements and investment in mobile-first, cloud-based learning solutions, ensuring sustained relevance in an evolving digital education ecosystem.
Recent Developments:
- In March 2025, McGraw Hill acquired Essaypop, an interactive writing solution, to enhance its portfolio of digital literacy tools for K-12.
- In April 2025, IBM and Tokyo Electron renewed their advanced semiconductor research collaboration, signing a new five-year R&D partnership targeting generative AI.
- In February 2025, SAP launched SAP Business Data Cloud in partnership with Databricks, introducing a unified solution for SAP and third-party data to enable richer business AI, analytics, and insights.
Market Concentration & Characteristics:
The e-learning market exhibits a moderately fragmented structure with a mix of global technology leaders, specialized EdTech providers, and regional content developers. It is characterized by rapid innovation, frequent platform upgrades, and integration of emerging technologies such as AI, AR, and VR to enhance learning experiences. Competitive differentiation often comes from content quality, localization, user experience, and scalability of delivery platforms. Strategic partnerships between technology firms, educational institutions, and corporate clients are common to expand reach and improve offerings. The market maintains high growth potential due to continuous demand from academic, corporate, and vocational training sectors, supported by increasing digital adoption worldwide.
Report Coverage:
The research report offers an in-depth analysis based on Type, Learning Method, Technology and Region. It details leading Market players, providing an overview of their business, product offerings, investments, revenue streams, and key applications. Additionally, the report includes insights into the competitive environment, SWOT analysis, current Market trends, as well as the primary drivers and constraints. Furthermore, it discusses various factors that have driven Market expansion in recent years. The report also explores Market dynamics, regulatory scenarios, and technological advancements that are shaping the industry. It assesses the impact of external factors and global economic changes on Market growth. Lastly, it provides strategic recommendations for new entrants and established companies to navigate the complexities of the Market.
Future Outlook:
- Adoption of AI-driven personalization will enhance learner engagement through adaptive assessments and tailored content recommendations.
- Expansion of immersive technologies such as VR and AR will create more interactive and realistic training environments.
- Growth in microlearning and modular course formats will align with evolving professional development needs.
- Mobile-first e-learning solutions will gain traction as smartphone usage continues to dominate digital access.
- Corporate demand for scalable, cost-effective training platforms will drive innovation in workforce upskilling tools.
- Increased localization and multilingual content will boost adoption in diverse cultural and regional markets.
- Public-private partnerships will strengthen infrastructure and accessibility in underserved regions.
- Integration with industry-recognized certification programs will enhance the value of online learning credentials.
- Data analytics and learning experience platforms will improve performance tracking and outcome measurement.
- Sustainability-focused education programs delivered via e-learning platforms will see higher adoption across sectors.
Request a Free Sample
Fill in your details and we'll send you a free sample report.
- Sample data tables & charts
- Research methodology
Need a Custom Version of This Report?
Tailor the scope, geography, or segments to your exact requirements.
- Custom geography or segment scope
- Direct access to our analyst team
Frequently Asked Questions
What is the current market size for the e-learning market, and what is its projected size in 2032?
At what Compound Annual Growth Rate is the e-learning market projected to grow between 2024 and 2032?
Which e-learning market segment held the largest share in 2024?
What are the primary factors fueling the growth of the e-learning market?
Who are the leading companies in the e-learning market?
Which region commanded the largest share of the e-learning market in 2024?
Table of Content
Chapter 1. Report Introduction
- 1.1 Report Description & Purpose
- 1.1.1 Report Title & Market Definition
- 1.1.2 Unique Selling Propositions (USP) & Key Differentiators
- 1.1.3 Value Proposition for Stakeholders
- 1.2 Research Objectives
- 1.2.1 Market Sizing Objectives (Volume & Revenue)
- 1.2.2 Segmentation Objectives
- 1.2.3 Competitive Intelligence Objectives
- 1.2.4 Forecast & Scenario Objectives
- 1.3 Report Scope
- 1.3.1 E-Learning Scope – Types & Subtypes Covered
- 1.3.2 Geographic Scope – Regions & Countries Covered
- 1.3.3 Historical Period, Base Year & Forecast Period (2024; forecast to 2032)
- 1.3.4 Inclusions & Exclusions
- 1.4 HS Code & Classification Framework
- 1.5 Currency, Units & Pricing Basis
- 1.6 Target Stakeholders
- 1.7 Limitations & Assumptions
Chapter 2. Executive Summary
- 2.1 Global E-Learning Market Snapshot
- 2.1.1 Market Size – Historical (2024) & Forecast (2024-2032) (2024: USD 369,767 million → 2032: USD 684,412.9 million)
- 2.1.2 Volume & Revenue – Global Totals
- 2.1.3 Key Market Highlights – Top Five Facts
- 2.2 E-Learning Market Segmentation Snapshot
- 2.2.1 Market Split by Region – 2024 vs. 2032
- 2.3 Competitive Snapshot
- 2.3.1 Top 10 Players by Revenue Share – 2024
- 2.3.2 Top 10 Players by Volume Share – 2024
- 2.3.3 Recent Strategic Developments (18-Month Summary)
- 2.4 Key Investment Highlights & Strategic Conclusions
Chapter 3. E-Learning Market Dynamics & Industry Analysis
- 3.1 Market Overview & Context
- 3.1.1 E-Learning Market Position in the Broader Automotive Value Chain
- 3.1.2 OEM vs. Replacement Market Dynamics
- 3.1.3 Market Maturity & Development Stage by Region
- 3.2 E-Learning Market Drivers
- 3.3 E-Learning Market Restraints & Challenges
- 3.4 E-Learning Market Opportunities
- 3.5 Porter's Five Forces Analysis
- 3.5.1 Threat of New Entrants
- 3.5.2 Bargaining Power of Suppliers
- 3.5.3 Bargaining Power of Buyers
- 3.5.4 Threat of Substitutes
- 3.5.5 Competitive Rivalry – Intensity Assessment
- 3.6 E-Learning Value Chain Analysis
- 3.6.1 Upstream – Raw Material/Input Suppliers
- 3.6.1.1 Raw Material/Input 1
- 3.6.1.2 Raw Material/Input 2
- 3.6.1.3 Raw Material/Input 3
- 3.6.2 Midstream – Production/Manufacturing/Service Delivery
- 3.6.2.1 Production/Process Overview
- 3.6.2.2 Key Facility Locations & Capacity by Manufacturer
- 3.6.3 Downstream – Distribution & End Consumer
- 3.6.3.1 Primary Channel – B2B/OEM
- 3.6.3.2 Secondary Channels – Dealer, Retail, Online, Direct
- 3.6.4 Value Chain Profitability Analysis
- 3.6.1 Upstream – Raw Material/Input Suppliers
- 3.7 PESTEL Analysis
- 3.7.1 Political Factors
- 3.7.2 Economic Factors
- 3.7.3 Social Factors
- 3.7.4 Technological Factors
- 3.7.5 Environmental Factors
- 3.7.6 Legal Factors
- 3.8 E-Learning Supply Chain Analysis
- 3.8.1 Raw Material/Input Supply Risk Assessment
- 3.8.2 Manufacturing Concentration Risk (Geographic Exposure)
- 3.8.3 Trade Disruption Impact Analysis
- 3.9 Regulatory & Policy Landscape
Note: The regulatory and policy landscape section covers regulations based on their applicability to the market, E-Learning category, geography, and scope of the study. Only regulatory frameworks with a material impact on operations, compliance, trade, sustainability, or market access are analyzed in detail.
Chapter 4. Key Investment Pockets & Opportunity Analysis
- 4.1 E-Learning Market Attractiveness Analysis
- 4.1.1 By Region – Investment Attractiveness Matrix (Volume × CAGR)
- 4.2 Absolute Revenue Growth Opportunity
- 4.2.1 By Region – Absolute USD Growth Through 2032
- 4.3 Incremental Volume Opportunity
- 4.3.1 By Region – Incremental Volume Through 2032
- 4.3.2 Segment – Incremental Volume
- 4.4 Emerging Submarket Opportunity Deep Dive (Subject to Applicability)
- 4.5 Emerging Market Opportunity Scorecards
- 4.5.1 United States
- 4.5.2 Europe
- 4.5.3 Asia
- 4.5.4 Middle East & Africa
Note: Emerging Market Opportunity Scorecards will be included based on relevance and strategic importance. Regions listed are indicative and may vary depending on data availability and market dynamics.
Chapter 5. E-Learning Import-Export Analysis & Trade Flows
- 5.1 Global Trade Overview
- 5.1.1 Global Export Value by Country (2024)
- 5.1.2 Global Export Volume by Country (2024)
- 5.1.3 Global Import Value by Country (2024)
- 5.1.4 Global Import Volume by Country (2024)
- 5.1.5 Net Trade Balance by Country (2024)
- 5.2 Export Analysis – Segment
- 5.2.1 Type 1 (HS Code)
- 5.2.2 Type 2 (HS Code)
- 5.2.3 Type 3 (HS Code)
- 5.2.4 Type 4 (HS Code)
- 5.2.5 Type 5 (HS Code)
- 5.3 Import Analysis – Segment
- 5.3.1 Type 1 (HS Code)
- 5.3.2 Type 2 (HS Code)
- 5.3.3 Type 3 (HS Code)
- 5.3.4 Type 4 (HS Code)
- 5.3.5 Type 5 (HS Code)
- 5.4 Average Unit Trade Prices
- 5.4.1 Average Export Price – Segment & Country
- 5.4.2 Average Import Price – Segment & Source Country
- 5.4.3 Price Trends (2024)
- 5.5 Key Trade Route Analysis
- 5.5.1 Trade Route 1
- 5.5.2 Trade Route 2
- 5.5.3 Trade Route 3
- 5.5.4 Trade Route 4
- 5.5.5 Trade Route 5
- 5.6 Trade Policy Impact Assessment
- 5.6.1 US Anti-Dumping & Section 301 Tariffs
- 5.6.2 EU Customs Union Impact
- 5.6.3 Major Free Trade Agreements
- 5.6.4 USMCA Rules of Origin
Note: Trade policy analysis will be included only where relevant to the E-Learning market.
Chapter 6. Competitive Landscape & Company Benchmarking
- 6.1 E-Learning Market Concentration & Structure
- 6.1.1 Herfindahl-Hirschman Index (HHI) – vs. 2024
- 6.1.2 Tier 1, Tier 2 & Tier 3 Market Structure
- 6.1.3 Global, Regional & Local Player Dynamics
- 6.2 E-Learning Market Share Analysis – 2024
- 6.2.1 Global Revenue Share by Company
- 6.2.2 Global Volume Share by Company
- 6.2.3 Regional Revenue Share
- 6.2.4 Market Share Evolution ( vs. 2024)
- 6.2.5 OEM Segment Share by Company
- 6.2.6 Replacement Segment Share by Company
- 6.3 Production/Delivery Capacity & Facility Analysis
- 6.3.1 Global Installed Capacity
- 6.3.2 Capacity Utilization Rates
- 6.3.3 Production/Output Volume
- 6.3.4 Facility Locations & Capacity Map
- 6.3.5 Planned Capacity Additions
- 6.4 E-Learning Competitive Benchmarking Matrix
- 6.4.1 Revenue, Volume, CAGR & Profitability Comparison
- 6.4.2 Channel Revenue Mix
- 6.4.3 Geographic Revenue Exposure
- 6.4.4 R&D Intensity
- 6.4.5 Sustainability Maturity
- 6.5 Strategic Developments in E-Learning (Last 24 Months)
- 6.5.1 Mergers, Acquisitions & Divestments
- 6.5.2 New E-Learning Launches
- 6.5.3 Facility Expansions
- 6.5.4 Strategic Alliances, Joint Ventures & Partnerships
- 6.5.5 Distribution Expansion & Market Entry
- 6.5.6 Sustainability & ESG Initiatives
- 6.6 Competitive Strategy Mapping
- 6.6.1 Leader, Challenger, Follower & Niche Classification
- 6.6.2 Pricing Strategy Comparison
- 6.6.3 Channel Strategy Matrix
Note: Strategic developments are included based on their materiality and the availability of reliable information.
Chapter 7. Global E-Learning Market – By Distribution Channel
- 7.1 Segment Overview
- 7.1.1 Volume & Revenue Split by Channel (2024 & 2032)
- 7.1.2 Channel Mix Evolution (2024-2032)
Chapter 8. Regional Market Analysis – Global Overview
- 8.1 Global Regional Overview
- 8.1.1 Regional Volume Share
- 8.1.2 Regional Revenue Share
- 8.1.3 Regional Volume by Region
- 8.1.4 Regional Revenue by Region
- 8.1.5 Regional Forecast Through 2032
- 8.2 Cross-Regional Segment Analysis
- 8.2.1 By Distribution Channel
- 8.2.2 By Brand/Price Tier
Chapter 9. North America E-Learning Market
- 9.1 United States
- 9.2 Canada
- 9.3 Mexico
Chapter 10. Europe E-Learning Market
- 10.1 Germany
- 10.2 France
- 10.3 Italy
- 10.4 United Kingdom
- 10.5 Spain
- 10.6 Poland
- 10.7 Russia
- 10.8 Netherlands
- 10.9 Belgium
- 10.10 Sweden
- 10.11 Denmark
- 10.12 Norway
- 10.13 Rest of Europe
Chapter 11. Asia Pacific E-Learning Market
- 11.1 China
- 11.2 India
- 11.3 Japan
- 11.4 South Korea
- 11.5 Thailand
- 11.6 Indonesia
- 11.7 Vietnam
- 11.8 Malaysia
- 11.9 Australia
- 11.10 Rest of Asia Pacific
Chapter 12. Latin America E-Learning Market
- 12.1 Brazil
- 12.2 Argentina
- 12.3 Colombia
- 12.4 Chile
- 12.5 Rest of Latin America
Chapter 13. Middle East E-Learning Market
- 13.1 Saudi Arabia
- 13.2 United Arab Emirates
- 13.3 Turkey
- 13.4 Israel
- 13.5 Iran
- 13.6 Rest of the Middle East
Chapter 14. Africa E-Learning Market
- 14.1 South Africa
- 14.2 Egypt
- 14.3 Nigeria
- 14.4 Morocco
- 14.5 Rest of Africa
Chapter 15. E-Learning Company Profiles
- 15.1 [Company 01]
- 15.1.1 Company Overview
- 15.1.2 Key Management Personnel
- 15.1.3 Products & Services Portfolio
- 15.1.4 Financial Performance
- 15.1.5 Key Market Focus & Geographic Presence
- 15.1.6 Recent Developments & Strategic Initiatives
Note: The company profile list is preliminary and may change based on research findings, market developments, data availability, and client requirements.
Chapter 16. Appendices
- Appendix A – List of Abbreviations & Acronyms
- Appendix B – Industry Classification Code Reference – Full Series
- Appendix C – Production & Capacity Data Tables
- Appendix D – End-Use & Demand Base Tables
- Appendix E – Consumption & Replacement Rate Assumptions
- Appendix F – ASP Reference Tables
- Appendix G – Manufacturing & Facility Database
- Appendix H – Import-Export Data Tables
- Appendix I – Regulatory Summary Tables
- Appendix J – Primary Research Participant List (Anonymized)
- Appendix K – Primary Research Questionnaire Framework
- Appendix L – Data Sources & Bibliography
- Appendix M – Market Size Divergence & Source Comparison
Chapter 17. Research Methodology
- 17.1 Research Framework & Philosophy
- 17.2 Secondary Research – Sources, Hierarchy & Data Extraction
- 17.3 Data Modeling – Bottom-Up & Top-Down Market Sizing
- 17.4 Primary Research – Stakeholder Framework, LOI & Sample Sizes
- 17.5 Forecast Methodology – Regression, Scenario & Sensitivity Analysis
- 17.6 Quality Control – Four-Layer Validation Framework
- 17.7 Limitations & Standard Assumptions
- 17.8 Disclaimer
