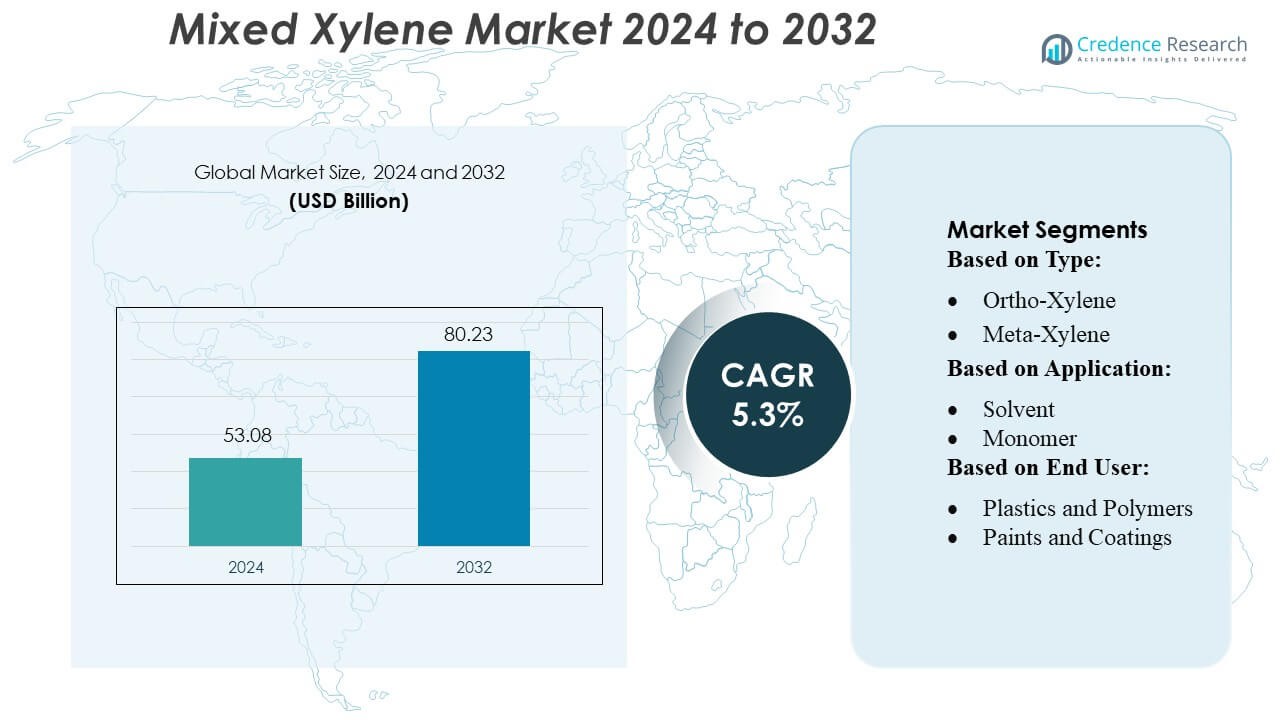
Home » Chemicals » Mixed Xylene Market

Mixed Xylene Market By Grade (Isomer Grade, Technical Grade) By Application (Chemical Synthesis, Solvent, Gasoline Blend, Lubricant, Cleaning Agent, Others) – Growth, Future Prospects & Competitive Analysis, 2016 – 2030

Price: $4999

Published: | Report ID: 18297 | Report Format : PDF

Key Highlights of the Report

The global mixed xylene market is categorized by grade, application, and region. Isomer grade mixed xylene is the most popular, while the technical grade is the two primary user segments. Solvent applications are the most commonly used distribution channels, with North America leading the market growth.

One of the factors propelling the global mixed xylene market is the rising use of mixed xylene as a solvent in end-use industries, including paints and coatings, adhesives, and sealants. The use of mixed xylene in fuel blending to raise the octane number is another factor influencing demand for the product. However, growing consumer awareness of the advantages of utilizing plastic-free products and the negative consequences of mixed xylene on the environment and human health may soon constrain the global market for mixed xylene.

Nonetheless, the global mixed xylene market offers significant growth opportunities, including huge growth potential in the North American region. The region’s plentiful availability of raw materials is one of the primary factors in developing the mixed xylene industry. The existence of numerous purified terephthalic acid (PTA) producers will also boost the expansion rate of the mixed xylene market.

Design Element 2

Access crucial information at unmatched prices!

Request your free sample report today & start making informed decisions powered by Credence Research!

Download Free Sample
CTA Design Element 3

Market Overview

The market for mixed xylene has been expanding steadily in recent years, and between 2023 and 2030, it is forecast to expand at a CAGR of 6.80%. The market was valued at USD 38.1 million in 2022 and is assumed to achieve USD 60.38 million in 2030.

What Are The Leading Drivers Of The Global Mixed Xylene Market?

The global mixed xylene market is driven by several factors, including the quickly expanding use of paraxylene in the production of PET (polyethylene terephthalate), terephthalic acid (TPA), and its derivative, dimethyl terephthalate (DMT).

What Are The Leading Challenges Faced By The Global Mixed Xylene Market?

The global mixed xylene market also faces several challenges, including severe government regulations for chemical products and environmental concerns over plastic usage.

What Are The Possible Growth Opportunities In The Global Mixed Xylene Market?

The global mixed xylene market offers significant growth opportunities, including increased investment in research and development for bio-based mixed xylene for use in paints, coatings, adhesives, and sealants.

Executive Summary

Overview of the Global Mixed Xylene Market

The main factor driving the market’s growth rate is the rubber manufacturing industry’s rising demand for and use of mixed xylene. Another element driving growth in the mixed xylene market value is the expansion and growth of the paints and coatings sector and other end-user verticals. The significant consumption of PET bottles, polyester textiles, and other PET consumer items has fostered the expansion of the mixed xylene business.

Market Definition

A colorless, oily organic molecule called xylene is produced during the coke fuel manufacturing process. As a result, coal distillation or catalytic reforming of petroleum naphthenic fractions yields mixed xylene, a flammable hydrocarbon liquid. Alcohol and mixed xylene are miscible; the combined substance evaporates and dissolves quickly. A mixture of four isomers with the molecular formula C8H10, namely ethylbenzene ( 20%), ortho-xylene (15–20%), para-xylene (15–20%), and meta-xylene (45–60%), is referred to as mixed xylene.

Market Insights

  • The global demand for mixed xylenes was prized at USD 38.1 Million in 2022 and is predicted to reach USD 60.38 Million in 2030, growing at a CAGR of 6.80% between 2023 and 2030.
  • Isomer grade is the leading segment by grade and held over 68.7% share in terms of value in 2022, while the technical grade segment is likely to exhibit the fastest CAGR during the forecast period.
  • The solvent segment governs the demand for mixed xylenes globally, holding a massive share of over 48.7% in 2022, and is expected to grow at a rapid CAGR.
  • North America is fueling the growth of the mixed xylene industry with over one-third share in 2022, while Asia Pacific and Europe collectively account for just under 50% share in 2022. Europe held over 25.7% share in 2022.
  • Several variables, such as the rising demand for sealants and adhesives across various end-use sectors, are expected to cause the market to expand. Xylene exposure in mixtures can cause headaches, nausea, and vomiting. Therefore, this detrimental risk is the primary and greatest obstacle to the expansion of the market.
  • The rising use of petrol in the US and the increased use of mixed xylene in petrol to improve petrol’s octane number (anti-knocking) properties are two major factors influencing the market in the North American region.

Segmentation by Grade

  • Isomer is the leading segment by grade and held over 68.7% share in terms of value in 2022.
  • The technical grade segment will likely exhibit the fastest CAGR during the forecast period.
  • Isomer serves as a diluent and solvent in numerous industries. It functions as a cleaning agent, reaction medium, and extractant. Solvent-Grade Isomer Grade type White spirit, mineral spirits, and petroleum ether are other names for mixed xylenes.

Segmentation by Application

  • The solvent segment governs the demand for mixed xylenes in the world, holding a massive share of over 48.7% in 2022, and is also expected to grow at a rapid CAGR.
  • The gasoline blend segment also contributes to significant demand for mixed xylenes.
  • Due to its quick drying characteristics, mixed xylene is frequently employed as a solvent in various end-use industries, including surface coatings and agrochemicals.

Segmentation by Region

  • North America will account for nearly one-third of the global market for the mixed xylene industry in 2022.
  • Asia Pacific and Europe collectively account for just under 50% share in 2022, with Europe holding over 25.7% share in the same year.
  • The rest of the World, including Africa, Latin America, and Middle East, contributes the remainder to the demand for mixed xylenes.

The prime aspect driving growth is the rising product utilization for the formulation of isophthalic acid used in architectural and aerospace coatings. The negative consequences of mixed xylene on the environment and human health may soon restrict the global market for mixed xylene.

North America’s demand for mixed xylene will grow significantly throughout the forecast period. In 2022, mixed xylene shipments to the United States comprised 16.3% of all shipments worldwide. A noticeable trend in this area is the increasing usage of mixed xylene to raise the octane rating of petrol and other fuels. Consumption of mixed xylene is primarily driven by the expanding usage of this solvent in various end-use industries.

China is the world’s largest consumer of mixed xylene. Consumption of mixed xylene is anticipated to be significantly influenced by the growing use of this solvent in various end-use sectors. Over the projection period, increased manufacturing of polyester products such as polyethylene terephthalate (PET), films, and fibers in China is anticipated to impact shipments of mixed xylene significantly. China is a significant center for manufacturing.

Overall, the increasing demand for mixed xylenes can be attributed to the growing demand for paints and coatings offered by mixed xylenes.

While the mixed xylene market is growing, it faces challenges from stringent safety regulations associated with the manufacture and transportation of xylene.

Market Drivers

The global mixed xylene market is driven by several factors. The following are the major drivers of the global mixed xylene market:

Growing Demand for Paint and Coating

The paint and coatings industry successfully increases the uniformity of the products by using mixed xylene as a solvent and thinner. The rise in production and demand for paints and coatings is predicted to support the growth of the mixed xylene market.  Additionally, the UK’s first five months of 2021 saw impressive sales results for both industrial and decorative coatings thanks to persistently high consumer demand for DIY products like paints and wall coverings as well as a robust manufacturing and construction industry rebound, according to British Coatings Federation (BCF). Overall, sales of paint and coatings climbed by 24% in the UK over the equivalent period in 2020. Because of increased production and increased demand for paints and coatings, the mixed xylene market’s CAGR is growing. Because of increased production and increased demand for paints and coatings, the mixed xylene market’s CAGR is growing.

Increase in Demand for Paraxylene Mixed Xylenes

The global market for mixed xylene is expanding due to the rising demand for paraxylene. One of the isomers of xylene, paraxylene, is necessary to create polyethylene terephthalate (PET). PET is utilized in various sectors, including construction, automotive, consumer products, sheets & films, food packaging, and beverage packaging. The market for mixed xylene has expanded due to the rising need for packaging materials, which has also raised the demand for PET. New production facilities have been established to suit the rising demand for paraxylene.

According to Jinlianchuang, a Chinese provider of complete digital and intelligent services for bulk commodities, China is predicted to have 6 sets of paraxylene plants in operation by 2022, with a production capacity of 11.89 million tons/year, representing a 41.3% increase. The increased production capacity will help to meet the growing demand for paraxylene. The increasing demand for paraxylene drives the mixed xylene market.

Market Restraints

The global mixed xylene market faces some challenges that may hinder its growth. These include the following:

Stringent Safety Regulations

The production and shipping of xylene were subject to strict safety rules, which significantly impacted the market. When subjected to high temperatures and pressures, xylene becomes very flammable, poisonous, and dangerous. Toxic levels and chemical concentrations should be kept to a minimum in this market since they could harm the environment and the population. Companies should invest in the necessary machinery, technologies, and procedures. People die when exposed to xylene at levels higher than 10,000 ppm (parts per million). Governmental organizations limit the volume of xylene that can be discharged into the environment to provide a safe environment. For example, Occupational Safety and Health Administration has limited the market’s growth by setting the maximum permitted level of xylene in workplace air at 100 ppm during an 8-hour workday and a 40-hour workweek.

Opportunities

The global mixed xylene market offers significant growth opportunities. These include the following:

Rising Demand for Bio-based Xylene Products over Chemical-based Products Xylene

Due to consumer preference for bio-based xylene over chemical-based equivalents, the industry is expanding. Due to their organic makeup, alcohols and glycol ethers are commonly used. They are mostly produced using agricultural goods, sugar, oils, fats, and cellulose. They also have non-toxic, carbon-neutral, and environmentally friendly qualities. Factors like increased pollution, rising VOC emissions, and strict Businesses using bio-based xylene are thriving due to factors like rising pollution, rising VOC emissions, and rigorous regulatory regulations. These factors have led many manufacturers to switch from creating chemical-based products to bio-based ones. Thus, the market will rise in the coming years due to consumers’ increasing desire for bioproducts.

Growing Manufacturer’s Participation in Mixed Xylenes Sector

The producers in the xylene sector are concentrating on raising their output. The key companies in the mixed xylene market are investing in building new plants and increasing the capacity of their current ones. For instance, Origin Materials, a US-based chemical company, opened its second facility in Geismar, Louisiana, in February 2022 to produce p-xylene, a precursor of polyethylene terephthalate. Additionally, Iran will begin building a brand-new 300,000 b/d refinery called Shahid Soleimani in 2022. This facility is anticipated to generate propylene, ethylene, and paraxylene in addition to petrol, diesel, jet fuel, and fuel oil. Within the following five years, the project will be finished.

Competitive Landscape

Key Players

The global mixed xylene market is largely competitive, with the presence of several prominent players. Some of the notable market players in the market and their market share are as follows:

  • Lotte Chemical
  • YPF S.A.
  • Yeochun NCC Co. Ltd.
  • Marathon Petroleum Corporation
  • Galp Energia
  • Mangalore Refinery & Petrochemicals Ltd.
  • GS Caltex Corporation
  • CITGO Petroleum Corporation
  • Cosmo Energy Holdings Co. Ltd.
  • Idemitsu Kosan Co. Ltd.
  • Taiyo Oil Company Ltd.
  • Royal Dutch Shell
  • SK Global Company
  • Sumitomo Chemical Company
  • Exxon Mobil Corporation
  • Chevron Phillips Chemical Company.

These companies focus on product innovation, expanding their distribution channels, and mergers and acquisitions to stay ahead in the market.

The major global mixed xylene market players are constantly striving to stay ahead by introducing new products and innovations.

In April 2023, BioBTX B.V., the global leader in renewable aromatics technology, and Agilyx ASA, a leading post-consumer plastics recycling company, formed a strategic partnership to investigate the commercialization of BioBTX technology at a commercial demonstration plant for the production of renewable aromatic chemicals (benzene, toluene, xylene: BTX).

In March 2023, Reliance Industries Limited (RIL) maintained unchanged Mixed Xylene (MX) prices in the Indian domestic market. Demand in the Indian market would continue to climb due to the existing basic pricing of INR 78/kg (USD 1/Kg) for mixed xylene. “Mixed Xylene local prices have been raised by Rs.2/kg basic, with effect from February 16, 2023,” according to the source. The new wholesale price is Rs.87/kg.

Summary of Key Findings

  • The increased use of mixed xylene as a solvent in end-use industries such as paints & coatings, adhesives, and sealants is one of the reasons driving the global mixed xylene market.
  • Market segmented by grade, application, and region.
  • Isomer-grade mixed xylenes are the most popular, with the technical grade as the primary user segment.
  • Solvents are the most commonly used application.
  • North America is leading market growth; the market is highly competitive with key players, including Exxon Mobil Corporation, Cosmo Energy Holdings Co. Ltd., Yeochun NCC Co. Ltd., and Lotte Chemical.

Shape Your Report to Specific Countries or Regions & Enjoy 30% Off!

Future Outlook

  • Positive outlook for the global mixed xylene market with significant growth potential in the North American region
  • The increased demand for paints and coatings can be related to the rising need for mixed xylenes.
  • Challenges from the stringent safety regulation
  • Key players to focus on product innovation, expanding market reach and maintaining competitive pricing to stay ahead in the market.

Segmentation

  • By Grade
    • Isomer Grade
    • Technical Grade
  • By Application
    • Chemical Synthesis
    • Solvent
    • Gasoline Blend
    • Lubricant
    • Cleaning Agent
    • Others
  • By Region
  • North America
    • US
    • Canada
    • Mexico
  • Europe
    • Germany
    • France
    • UK.
    • Italy
    • Spain
    • Rest of Europe
  • Asia Pacific
    • China
    • Japan
    • India
    • South Korea
    • South-east Asia
    • Rest of Asia Pacific
  • Latin America
    • Brazil
    • Argentina
    • Rest of Latin America
  • Middle East & Africa
    • GCC Countries
    • South Africa
    • Rest of Middle East and Africa

1. Preface
1.1. Report Description
1.1.1. Purpose of the Report
1.1.2. Target Audience
1.1.3. USP and Key Offerings
1.2. Research Scope
1.3. Research Methodology
1.3.1. Phase I – Secondary Research
1.3.2. Phase II – Data Modelling
1.3.2.1. Company Share Analysis Model
1.3.2.2. Revenue Based Modelling
1.3.3. Phase III – Primary Research
1.3.4. Research Limitations
1.3.5. Assumptions
1.4. Market Introduction
1.5. Market Research Scope

2. Executive Summary
2.1. Market Snapshot: Global Mixed Xylene Market
2.2. Global Mixed Xylene Market, By Grade
2.3. Global Mixed Xylene Market, By Application
2.4. Global Mixed Xylene Market, By Region

3. Market Dynamics & Factors Analysis
3.1. Introduction
3.1.1. Global Mixed Xylene Market Value, 2017-2030, (US$ Mn)
3.1.2. Global Mixed Xylene Market Volume, 2017-2030, (Kilo Tons)
3.1.3. Y-o-Y Growth Trend Analysis
3.2. Market Dynamics
3.2.1. Market Drivers
3.2.1.1. Driver 1
3.2.1.2. Driver 2
3.2.1.3. Driver 3
3.2.2. Market Restraints
3.2.2.1. Restraint 1
3.2.2.2. Restraint 2
3.2.3. Market Opportunities
3.2.3.1. Opportunity 1
3.2.3.2. Opportunity 2
3.2.4. Major Industry Challenges
3.2.4.1. Challenge 1
3.2.4.2. Challenge 2
3.3. Growth and Development Patterns
3.4. Investment Feasibility Analysis
3.5. Market Opportunity Analysis
3.5.1. Grade
3.5.2. Application
3.5.3. Geography

4. Premium Insights
4.1. STAR (Situation, Task, Action, Results) Analysis
4.2. Porter’s Five Forces Analysis
4.2.1. Threat of New Entrants
4.2.2. Bargaining Power of Buyers/Consumers
4.2.3. Bargaining Power of Suppliers
4.2.4. Threat of Substitute Types
4.2.5. Intensity of Competitive Rivalry
4.3. Key Market Trends
4.3.1. Demand Side Trends
4.3.2. Supply Side Trends
4.4. Value Chain Analysis
4.5. Technology Analysis
4.6. Analysis and Recommendations
4.7. Marketing Strategy Analysis
4.7.1. Direct Marketing
4.7.2. Indirect Marketing
4.7.3. Marketing Channel Development Trend

5. Import Export Analysis
5.1. Import Analysis by Region
5.1.1. Global Mixed Xylene Market Import Volume, By Region, 2017-2022 (Kilo Tons)
5.2. Export Analysis by Region
5.2.1. Global Mixed Xylene Market Export Volume, By Region, 2017-2022 (Kilo Tons)

6. Demand-Supply Analysis
6.1. Demand Analysis by Region
6.1.1. Global Mixed Xylene Market Demand Volume, By Region, 2017-2022 (Kilo Tons)
6.2. Supply Analysis by Region
6.2.1. Global Mixed Xylene Market Supply Volume, By Region, 2017-2022 (Kilo Tons)

7. Pricing Analysis
7.1. Average Price of Mixed Xylenes by Region, 2017-2022 (USD/Unit)
7.2. Average Price of Mixed Xylenes by Region, 2023-2030 (USD/Unit)

8. Market Positioning of Key Players, 2022
8.1. Company market share of key players, 2022
8.2. Competitive Benchmarking
8.3. Market Positioning of Key Vendors
8.4. Geographical Presence Analysis
8.5. Major Strategies Adopted by Key Players
8.5.1. Key Strategies Analysis
8.5.2. Mergers and Acquisitions
8.5.3. Partnerships
8.5.4. Product Launch
8.5.5. Geographical Expansion
8.5.6. Others

9. Economic Impact Analysis
9.1. Recession Impact
9.1.1. North America
9.1.2. Europe
9.1.3. Asia Pacific
9.1.4. Latin America
9.1.5. Middle East and Africa
9.2. Ukraine-Russia War Impact
9.2.1. North America
9.2.2. Europe
9.2.3. Asia Pacific
9.2.4. Latin America
9.2.5. Middle East and Africa
9.3. COVID-19 Impact Analysis
9.3.1. North America
9.3.2. Europe
9.3.3. Asia Pacific
9.3.4. Latin America
9.3.5. Middle East and Africa

10. Global Mixed Xylene Market, By Grade
10.1. Global Mixed Xylene Market Overview, by Grade
10.1.1. Global Mixed Xylene Market Revenue Share, By Grade, 2022 Vs 2030 (in %)
10.1.2. Global Mixed Xylene Market Volume Share, By Grade, 2022 Vs 2030 (in %)
10.2. Isomer Grade
10.2.1. Global Mixed Xylene Market, By Region, 2017-2030 (US$ Mn)
10.2.2. Global Mixed Xylene Market, By Region, 2017-2030 (Kilo Tons)
10.3. Technical Grade
10.3.1. Global Mixed Xylene Market, By Region, 2017-2030 (US$ Mn)
10.3.2. Global Mixed Xylene Market, By Region, 2017-2030 (Kilo Tons)

11. Global Mixed Xylene Market, by Application, 2017-2030 (US$ Mn)
11.1. Global Mixed Xylene Market Overview, by Application
11.1.1. Global Mixed Xylene Market, By Application, 2022 vs 2030 (in%)
11.2. Chemical Synthesis
11.2.1. Global Mixed Xylene Market, By Region, 2017-2030 (US$ Mn)
11.2.2. Global Mixed Xylene Market, By Region, 2017-2030 (Kilo Tons)
11.3. Solvent
11.3.1. Global Mixed Xylene Market, By Region, 2017-2030 (US$ Mn)
11.3.2. Global Mixed Xylene Market, By Region, 2017-2030 (Kilo Tons)
11.4. Gasoline Blend
11.4.1. Global Mixed Xylene Market, By Region, 2017-2030 (US$ Mn)
11.4.2. Global Mixed Xylene Market, By Region, 2017-2030 (Kilo Tons)
11.5. Lubricant
11.5.1. Global Mixed Xylene Market, By Region, 2017-2030 (US$ Mn)
11.5.2. Global Mixed Xylene Market, By Region, 2017-2030 (Kilo Tons)
11.6. Cleaning Agent
11.6.1. Global Mixed Xylene Market, By Region, 2017-2030 (US$ Mn)
11.6.2. Global Mixed Xylene Market, By Region, 2017-2030 (Kilo Tons)
11.7. Others
11.7.1. Global Mixed Xylene Market, By Region, 2017-2030 (US$ Mn)
11.7.2. Global Mixed Xylene Market, By Region, 2017-2030 (Kilo Tons)

12. Global Mixed Xylene Market, By Region
12.1. Global Mixed Xylene Market Overview, by Region
12.1.1. Global Mixed Xylene Market Revenue, By Region, 2022 vs 2030 (in%)
12.1.2. Global Mixed Xylene Market Volume, By Region, 2022 vs 2030 (in%)
12.2. Grade
12.2.1. Global Mixed Xylene Market, By Grade, 2017-2030 (US$ Mn)
12.2.2. Global Mixed Xylene Market, By Grade, 2017-2030 (Kilo Tons)
12.3. Mode of Sales
12.3.1. Global Mixed Xylene Market, By Mode of Sales, 2017-2030 (US$ Mn)
12.3.2. Global Mixed Xylene Market, By Mode of Sales, 2017-2030 (Kilo Tons)
12.4. Application
12.4.1. Global Mixed Xylene Market, By Application, 2017-2030 (US$ Mn)
12.4.2. Global Mixed Xylene Market, By Application, 2017-2030 (Kilo Tons)

13. North America Mixed Xylene Market Analysis
13.1. North America Mixed Xylene Market, by Grade, 2017-2030(US$ Mn)
13.1.1. Overview
13.1.2. SRC Analysis
13.2. North America Mixed Xylene Market, by Grade, 2017-2030(Kilo Tons)
13.2.1. Overview
13.2.2. SRC Analysis
13.3. North America Mixed Xylene Market, by Mode of Sales, 2017-2030(Kilo Tons)
13.3.1. Overview
13.3.2. SRC Analysis
13.4. North America Mixed Xylene Market, by Application, 2017-2030(US$ Mn)
13.4.1. Overview
13.4.2. SRC Analysis
13.5. North America Mixed Xylene Market, by Application, 2017-2030 (Kilo Tons)
13.5.1. Overview
13.5.2. SRC Analysis
13.6. North America Mixed Xylene Market, by Country, 2017-2030 (US$ Mn)
13.6.1. North America Mixed Xylene Market Revenue, by Country, 2022 Vs 2030 (in%)
13.6.2. North America Mixed Xylene Market Volume, by Country, 2022 Vs 2030 (in%)
13.6.3. U.S.
13.6.3.1. U.S. Mixed Xylene Market Estimates and Forecast, 2017-2030 (US$ Mn)
13.6.3.2. U.S. Mixed Xylene Market Estimates and Forecast, 2017-2030 (Kilo Tons)
13.6.3.3. U.S. Mixed Xylene, By Grade, 2017-2030 (US$ Mn)
13.6.3.4. U.S. Mixed Xylene, By Grade, 2017-2030 (Kilo Tons)
13.6.3.5. U.S. Mixed Xylene, By Application, 2017-2030 (US$ Mn)
13.6.3.6. U.S. Mixed Xylene, By Application, 2017-2030 (Kilo Tons)
13.6.4. Canada
13.6.4.1. Canada Mixed Xylene Market Estimates and Forecast, 2017-2030 (US$ Mn)
13.6.4.2. Canada Mixed Xylene Market Estimates and Forecast, 2017-2030 (Kilo Tons)
13.6.4.3. Canada Mixed Xylene, By Grade, 2017-2030 (US$ Mn)
13.6.4.4. Canada Mixed Xylene, By Grade, 2017-2030 (Kilo Tons)
13.6.4.5. Canada Mixed Xylene, By Application, 2017-2030 (US$ Mn)
13.6.4.6. Canada Mixed Xylene, By Application, 2017-2030 (Kilo Tons)
13.6.5. Mexico
13.6.5.1. Mexico Mixed Xylene Market Estimates and Forecast, 2017-2030 (US$ Mn)
13.6.5.2. Mexico Mixed Xylene Market Estimates and Forecast, 2017-2030 (Kilo Tons)
13.6.5.3. Mexico Mixed Xylene, By Grade, 2017-2030 (US$ Mn)
13.6.5.4. Mexico Mixed Xylene, By Grade, 2017-2030 (Kilo Tons)
13.6.5.5. Mexico Mixed Xylene, By Application, 2017-2030 (US$ Mn)
13.6.5.6. Mexico Mixed Xylene, By Application, 2017-2030 (Kilo Tons)

14. Europe Mixed Xylene Market Analysis
14.1. Europe Mixed Xylene Market, by Grade, 2017-2030(US$ Mn)
14.1.1. Overview
14.1.2. SRC Analysis
14.2. Europe Mixed Xylene Market, by Grade, 2017-2030(Kilo Tons)
14.2.1. Overview
14.2.2. SRC Analysis
14.3. Europe Mixed Xylene Market, by Application, 2017-2030(US$ Mn)
14.3.1. Overview
14.3.2. SRC Analysis
14.4. Europe Mixed Xylene Market, by Application, 2017-2030(Kilo Tons)
14.4.1. Overview
14.4.2. SRC Analysis
14.5. Europe Mixed Xylene Market, by Country, 2017-2030 (US$ Mn)
14.5.1. Europe Mixed Xylene Market Revenue, by Country, 2022 Vs 2030 (in%)
14.5.2. Europe Mixed Xylene Market Volume, by Country, 2022 Vs 2030 (in%)
14.5.3. Germany
14.5.3.1. Germany Mixed Xylene Market Estimates and Forecast, 2017-2030 (US$ Mn)
14.5.3.2. Germany Mixed Xylene Market Estimates and Forecast, 2017-2030 (Kilo Tons)
14.5.3.3. Germany Mixed Xylene, By Grade, 2017-2030 (US$ Mn)
14.5.3.4. Germany Mixed Xylene, By Grade, 2017-2030 (Kilo Tons)
14.5.3.5. Germany Mixed Xylene, By Application, 2017-2030 (US$ Mn)
14.5.3.6. Germany Mixed Xylene, By Application, 2017-2030 (Kilo Tons)
14.5.4. France
14.5.4.1. France Mixed Xylene Market Estimates and Forecast, 2017-2030 (US$ Mn)
14.5.4.2. France Mixed Xylene Market Estimates and Forecast, 2017-2030 (Kilo Tons)
14.5.4.3. France Mixed Xylene, By Grade, 2017-2030 (US$ Mn)
14.5.4.4. France Mixed Xylene, By Grade, 2017-2030 (Kilo Tons)
14.5.4.5. France Mixed Xylene, By Application, 2017-2030 (US$ Mn)
14.5.4.6. France Mixed Xylene, By Application, 2017-2030 (Kilo Tons)
14.5.5. U.K.
14.5.5.1. U.K. Mixed Xylene Market Estimates and Forecast, 2017-2030 (US$ Mn)
14.5.5.2. U.K. Mixed Xylene Market Estimates and Forecast, 2017-2030 (Kilo Tons)
14.5.5.3. U.K. Mixed Xylene, By Grade, 2017-2030 (US$ Mn)
14.5.5.4. U.K. Mixed Xylene, By Grade, 2017-2030 (Kilo Tons)
14.5.5.5. U.K. Mixed Xylene, By Application, 2017-2030 (US$ Mn)
14.5.5.6. U.K. Mixed Xylene, By Application, 2017-2030 (Kilo Tons)
14.5.6. Italy
14.5.6.1. Italy Mixed Xylene Market Estimates and Forecast, 2017-2030 (US$ Mn)
14.5.6.2. Italy Mixed Xylene Market Estimates and Forecast, 2017-2030 (Kilo Tons)
14.5.6.3. Italy Mixed Xylene, By Grade, 2017-2030 (US$ Mn)
14.5.6.4. Italy Mixed Xylene, By Grade, 2017-2030 (Kilo Tons)
14.5.6.5. Italy Mixed Xylene, By Application, 2017-2030 (US$ Mn)
14.5.6.6. Italy Mixed Xylene, By Application, 2017-2030 (Kilo Tons)
14.5.7. Spain
14.5.7.1. Spain Mixed Xylene Market Estimates and Forecast, 2017-2030 (US$ Mn)
14.5.7.2. Spain Mixed Xylene Market Estimates and Forecast, 2017-2030 (Kilo Tons)
14.5.7.3. Spain Mixed Xylene, By Grade, 2017-2030 (US$ Mn)
14.5.7.4. Spain Mixed Xylene, By Grade, 2017-2030 (Kilo Tons)
14.5.7.5. Spain Mixed Xylene, By Application, 2017-2030 (US$ Mn)
14.5.7.6. Spain Mixed Xylene, By Application, 2017-2030 (Kilo Tons)
14.5.8. Rest of Europe
14.5.8.1. Rest of Europe Mixed Xylene Market Estimates and Forecast, 2017-2030 (US$ Mn)
14.5.8.2. Rest of Europe Mixed Xylene Market Estimates and Forecast, 2017-2030 (Kilo Tons)
14.5.8.3. Rest of Europe Mixed Xylene, By Grade, 2017-2030 (US$ Mn)
14.5.8.4. Rest of Europe Mixed Xylene, By Grade, 2017-2030 (Kilo Tons)
14.5.8.5. Rest of Europe Mixed Xylene, By Application, 2017-2030 (US$ Mn)
14.5.8.6. Rest of Europe Mixed Xylene, By Application, 2017-2030 (Kilo Tons)

15. Asia Pacific Mixed Xylene Market Analysis
15.1. Asia Pacific Mixed Xylene Market, by Grade, 2017-2030(US$ Mn)
15.1.1. Overview
15.1.2. SRC Analysis
15.2. Asia Pacific Mixed Xylene Market, by Grade, 2017-2030(Kilo Tons)
15.2.1. Overview
15.2.2. SRC Analysis
15.3. Asia Pacific Mixed Xylene Market, by Application, 2017-2030(US$ Mn)
15.3.1. Overview
15.3.2. SRC Analysis
15.4. Asia Pacific Mixed Xylene Market, by Application, 2017-2030(Kilo Tons)
15.4.1. Overview
15.4.2. SRC Analysis
15.5. Asia Pacific Mixed Xylene Market, by Country, 2017-2030 (US$ Mn)
15.5.1. Asia Pacific Mixed Xylene Market Revenue, by Country, 2022 Vs 2030 (in%)
15.5.2. Asia Pacific Mixed Xylene Market Volume, by Country, 2022 Vs 2030 (in%)
15.5.3. China
15.5.3.1. China Mixed Xylene Market Estimates and Forecast, 2017-2030 (US$ Mn)
15.5.3.2. China Mixed Xylene Market Estimates and Forecast, 2017-2030 (Kilo Tons)
15.5.3.3. China Mixed Xylene, By Grade, 2017-2030 (US$ Mn)
15.5.3.4. China Mixed Xylene, By Grade, 2017-2030 (Kilo Tons)
15.5.3.5. China Mixed Xylene, By Application, 2017-2030 (US$ Mn)
15.5.3.6. China Mixed Xylene, By Application, 2017-2030 (Kilo Tons)
15.5.4. Japan
15.5.4.1. Japan Mixed Xylene Market Estimates and Forecast, 2017-2030 (US$ Mn)
15.5.4.2. Japan Mixed Xylene Market Estimates and Forecast, 2017-2030 (Kilo Tons)
15.5.4.3. Japan Mixed Xylene, By Grade, 2017-2030 (US$ Mn)
15.5.4.4. Japan Mixed Xylene, By Grade, 2017-2030 (Kilo Tons)
15.5.4.5. Japan Mixed Xylene, By Application, 2017-2030 (US$ Mn)
15.5.4.6. Japan Mixed Xylene, By Application, 2017-2030 (Kilo Tons)
15.5.5. India
15.5.5.1. India Mixed Xylene Market Estimates and Forecast, 2017-2030 (US$ Mn)
15.5.5.2. India Mixed Xylene Market Estimates and Forecast, 2017-2030 (Kilo Tons)
15.5.5.3. India Mixed Xylene, By Grade, 2017-2030 (US$ Mn)
15.5.5.4. India Mixed Xylene, By Grade, 2017-2030 (Kilo Tons)
15.5.5.5. India Mixed Xylene, By Application, 2017-2030 (US$ Mn)
15.5.5.6. India Mixed Xylene, By Application, 2017-2030 (Kilo Tons)
15.5.6. South Korea
15.5.6.1. South Korea Mixed Xylene Market Estimates and Forecast, 2017-2030 (US$ Mn)
15.5.6.2. South Korea Mixed Xylene Market Estimates and Forecast, 2017-2030 (Kilo Tons)
15.5.6.3. South Korea Mixed Xylene, By Grade, 2017-2030 (US$ Mn)
15.5.6.4. South Korea Mixed Xylene, By Grade, 2017-2030 (Kilo Tons)
15.5.6.5. South Korea Mixed Xylene, By Application, 2017-2030 (US$ Mn)
15.5.6.6. South Korea Mixed Xylene, By Application, 2017-2030 (Kilo Tons)
15.5.7. South-East Asia
15.5.7.1. South-East Asia Mixed Xylene Market Estimates and Forecast, 2017-2030 (US$ Mn)
15.5.7.2. South-East Asia Mixed Xylene Market Estimates and Forecast, 2017-2030 (Kilo Tons)
15.5.7.3. South-East Asia Mixed Xylene, By Grade, 2017-2030 (US$ Mn)
15.5.7.4. South-East Asia Mixed Xylene, By Grade, 2017-2030 (Kilo Tons)
15.5.7.5. South-East Asia Mixed Xylene, By Application, 2017-2030 (US$ Mn)
15.5.7.6. South-East Asia Mixed Xylene, By Application, 2017-2030 (Kilo Tons)
15.5.8. Rest of Asia Pacific
15.5.8.1. Rest of Asia Pacific Mixed Xylene Market Estimates and Forecast, 2017-2030 (US$ Mn)
15.5.8.2. Rest of Asia Pacific Mixed Xylene Market Estimates and Forecast, 2017-2030 (Kilo Tons)
15.5.8.3. Rest of Asia Pacific Mixed Xylene, By Grade, 2017-2030 (US$ Mn)
15.5.8.4. Rest of Asia Pacific Mixed Xylene, By Grade, 2017-2030 (Kilo Tons)
15.5.8.5. Rest of Asia Pacific Mixed Xylene, By Application, 2017-2030 (US$ Mn)
15.5.8.6. Rest of Asia Pacific Mixed Xylene, By Application, 2017-2030 (Kilo Tons)

16. Latin America Mixed Xylene Market Analysis
16.1. Latin America Mixed Xylene Market, by Grade, 2017-2030(US$ Mn)
16.1.1. Overview
16.1.2. SRC Analysis
16.2. Latin America Mixed Xylene Market, by Grade, 2017-2030(Kilo Tons)
16.2.1. Overview
16.2.2. SRC Analysis
16.3. Latin America Mixed Xylene Market, by Application, 2017-2030(US$ Mn)
16.3.1. Overview
16.3.2. SRC Analysis
16.4. Latin America Mixed Xylene Market, by Application, 2017-2030(Kilo Tons)
16.4.1. Overview
16.4.2. SRC Analysis
16.5. Latin America Mixed Xylene Market, by Country, 2017-2030 (US$ Mn)
16.5.1. Latin America Mixed Xylene Market Revenue, by Country, 2022 Vs 2030 (in%)
16.5.2. Latin America Mixed Xylene Market Volume, by Country, 2022 Vs 2030 (in%)
16.5.3. Brazil
16.5.3.1. Brazil Mixed Xylene Market Estimates and Forecast, 2017-2030 (US$ Mn)
16.5.3.2. Brazil Mixed Xylene Market Estimates and Forecast, 2017-2030 (Kilo Tons)
16.5.3.3. Brazil Mixed Xylene, By Grade, 2017-2030 (US$ Mn)
16.5.3.4. Brazil Mixed Xylene, By Grade, 2017-2030 (Kilo Tons)
16.5.3.5. Brazil Mixed Xylene, By Application, 2017-2030 (US$ Mn)
16.5.3.6. Brazil Mixed Xylene, By Application, 2017-2030 (Kilo Tons)
16.5.4. Argentina
16.5.4.1. Argentina Mixed Xylene Market Estimates and Forecast, 2017-2030 (US$ Mn)
16.5.4.2. Argentina Mixed Xylene Market Estimates and Forecast, 2017-2030 (Kilo Tons)
16.5.4.3. Argentina Mixed Xylene, By Grade, 2017-2030 (US$ Mn)
16.5.4.4. Argentina Mixed Xylene, By Grade, 2017-2030 (Kilo Tons)
16.5.4.5. Argentina Mixed Xylene, By Application, 2017-2030 (US$ Mn)
16.5.4.6. Argentina Mixed Xylene, By Application, 2017-2030 (Kilo Tons)
16.5.5. Rest of Latin America
16.5.5.1. Rest of Latin America Mixed Xylene Market Estimates and Forecast, 2017-2030 (US$ Mn)
16.5.5.2. Rest of Latin America Mixed Xylene Market Estimates and Forecast, 2017-2030 (Kilo Tons)
16.5.5.3. Rest of Latin America Mixed Xylene, By Grade, 2017-2030 (US$ Mn)
16.5.5.4. Rest of Latin America Mixed Xylene, By Grade, 2017-2030 (Kilo Tons)
16.5.5.5. Rest of Latin America Mixed Xylene, By Application, 2017-2030 (US$ Mn)
16.5.5.6. Rest of Latin America Mixed Xylene, By Application, 2017-2030 (Kilo Tons)

17. Middle East and Africa Mixed Xylene Market Analysis
17.1. Middle East and Africa Mixed Xylene Market, by Grade, 2017-2030(US$ Mn)
17.1.1. Overview
17.1.2. SRC Analysis
17.2. Middle East and Africa Mixed Xylene Market, by Grade, 2017-2030(Kilo Tons)
17.2.1. Overview
17.2.2. SRC Analysis
17.3. Middle East and Africa Mixed Xylene Market, by Application, 2017-2030(US$ Mn)
17.3.1. Overview
17.3.2. SRC Analysis
17.4. Middle East and Africa Mixed Xylene Market, by Application, 2017-2030(Kilo Tons)
17.4.1. Overview
17.4.2. SRC Analysis
17.5. Middle East and Africa Mixed Xylene Market, by Country, 2017-2030 (US$ Mn)
17.5.1. Middle East and Africa Mixed Xylene Market Revenue, by Country, 2022 Vs 2030 (in%)
17.5.2. Middle East and Africa Mixed Xylene Market Volume, by Country, 2022 Vs 2030 (in%)
17.5.3. GCC Countries
17.5.3.1. GCC Countries Mixed Xylene Market Estimates and Forecast, 2017-2030 (US$ Mn)
17.5.3.2. GCC Countries Mixed Xylene Market Estimates and Forecast, 2017-2030 (Kilo Tons)
17.5.3.3. GCC Countries Mixed Xylene, By Grade, 2017-2030 (US$ Mn)
17.5.3.4. GCC Countries Mixed Xylene, By Grade, 2017-2030 (Kilo Tons)
17.5.3.5. GCC Countries Mixed Xylene, By Application, 2017-2030 (US$ Mn)
17.5.3.6. GCC Countries Mixed Xylene, By Application, 2017-2030 (Kilo Tons)
17.5.4. South Africa
17.5.4.1. South Africa Mixed Xylene Market Estimates and Forecast, 2017-2030 (US$ Mn)
17.5.4.2. South Africa Mixed Xylene Market Estimates and Forecast, 2017-2030 (Kilo Tons)
17.5.4.3. South Africa Mixed Xylene, By Grade, 2017-2030 (US$ Mn)
17.5.4.4. South Africa Mixed Xylene, By Grade, 2017-2030 (Kilo Tons)
17.5.4.5. South Africa Mixed Xylene, By Application, 2017-2030 (US$ Mn)
17.5.4.6. South Africa Mixed Xylene, By Application, 2017-2030 (Kilo Tons)
17.5.5. Rest of Middle East and Africa
17.5.5.1. Rest of Middle East and Africa Mixed Xylene Market Estimates and Forecast, 2017-2030 (US$ Mn)
17.5.5.2. Rest of Middle East and Africa Mixed Xylene Market Estimates and Forecast, 2017-2030 (Kilo Tons)
17.5.5.3. Rest of Middle East and Africa Mixed Xylene, By Grade, 2017-2030 (US$ Mn)
17.5.5.4. Rest of Middle East and Africa Mixed Xylene, By Grade, 2017-2030 (Kilo Tons)
17.5.5.5. Rest of Middle East and Africa Mixed Xylene, By Application, 2017-2030 (US$ Mn)
17.5.5.6. Rest of Middle East and Africa Mixed Xylene, By Application, 2017-2030 (Kilo Tons)

18. Company Profiles
18.1. Lotte Chemica.
18.1.1. Company Overview
18.1.2. Products/Services Portfolio
18.1.3. Geographical Presence
18.1.4. Financial Summary
18.1.4.1. Market Revenue and Net Profit (2019-2022)
18.1.4.2. Business Segment Revenue Analysis
18.1.4.3. Geographical Revenue Analysis
18.2. YPF S.A.
18.3. Yeochun NCC Co. Ltd.
18.4. Marathon Petroleum Corporation
18.5. Galp Energia
18.6. Mangalore Refinery & Petrochemicals Ltd.
18.7. GS Caltex Corporation
18.8. CITGO Petroleum Corporation
18.9. Cosmo Energy Holdings Co. Ltd.
18.10. Idemitsu Kosan Co. Ltd.
18.11. Taiyo Oil Company Ltd.
18.12. Royal Dutch Shell
18.13. SK Global Company
18.14. Sumitomo Chemical Company
18.15. Exxon Mobil Corporation
18.16. Chevron Phillips Chemical Company

List of Figures
FIG. 1 Global Mixed Xylene Market: Research Methodology
FIG. 2 Market Size Estimation – Top Down & Bottom up Approach
FIG. 3 Global Mixed Xylene Market Segmentation
FIG. 4 Global Mixed Xylene Market, by Grade, 2022 (US$ Mn) (Kilo Tons)
FIG. 5 Global Mixed Xylene Market, by Application, 2022 (US$ Mn) (Kilo Tons)
FIG. 6 Global Mixed Xylene Market, by Geography, 2022 (US$ Mn) (Kilo Tons)
FIG. 7 Attractive Investment Proposition, by Grade, 2022
FIG. 8 Attractive Investment Proposition, by Application, 2022
FIG. 9 Attractive Investment Proposition, by Geography, 2022
FIG. 10 Global Market Share Analysis of Key Mixed Xylene Market Manufacturers, 2022
FIG. 11 Global Market Positioning of Key Mixed Xylene Market Manufacturers, 2022
FIG. 12 Global Mixed Xylene Market Value Contribution, By Grade, 2022 & 2030 (Value %)
FIG. 13 Global Mixed Xylene Market, by Isomer Grade, Value, 2017-2030 (US$ Mn) (Kilo Tons)
FIG. 14 Global Mixed Xylene Market, by Technical Grade, Value, 2017-2030 (US$ Mn) (Kilo Tons)
FIG. 15 Global Mixed Xylene Market Value Contribution, By Application, 2022 & 2030 (Value %)
FIG. 16 Global Mixed Xylene Market, by Chemical Synthesis, Value, 2017-2030 (US$ Mn) (Kilo Tons)
FIG. 17 Global Mixed Xylene Market, by Solvent, 2017-2030 (US$ Mn) (Kilo Tons)
FIG. 18 Global Mixed Xylene Market, by Gasoline Blend, 2017-2030 (US$ Mn) (Kilo Tons)
FIG. 19 Global Mixed Xylene Market, by Lubricant, 2017-2030 (US$ Mn) (Kilo Tons)
FIG. 20 Global Mixed Xylene Market, by Cleaning Agent, 2017-2030 (US$ Mn) (Kilo Tons)
FIG. 21 Global Mixed Xylene Market, by Others, 2017-2030 (US$ Mn) (Kilo Tons)
FIG. 22 North America Mixed Xylene Market, 2017-2030 (US$ Mn) (Kilo Tons)
FIG. 23 U.S. Mixed Xylene Market, 2017-2030 (US$ Mn) (Kilo Tons)
FIG. 24 Canada Mixed Xylene Market, 2017-2030 (US$ Mn) (Kilo Tons)
FIG. 25 Europe Mixed Xylene Market, 2017-2030 (US$ Mn) (Kilo Tons)
FIG. 26 Germany Mixed Xylene Market, 2017-2030 (US$ Mn) (Kilo Tons)
FIG. 27 France Mixed Xylene Market, 2017-2030 (US$ Mn) (Kilo Tons)
FIG. 28 U.K. Mixed Xylene Market, 2017-2030 (US$ Mn) (Kilo Tons)
FIG. 29 Italy Mixed Xylene Market, 2017-2030 (US$ Mn) (Kilo Tons)
FIG. 30 Spain Mixed Xylene Market, 2017-2030 (US$ Mn) (Kilo Tons)
FIG. 31 Rest of Europe Mixed Xylene Market, 2017-2030 (US$ Mn) (Kilo Tons)
FIG. 32 Asia Pacific Mixed Xylene Market, 2017-2030 (US$ Mn) (Kilo Tons)
FIG. 33 China Mixed Xylene Market, 2017-2030 (US$ Mn) (Kilo Tons)
FIG. 34 Japan Mixed Xylene Market, 2017-2030 (US$ Mn) (Kilo Tons)
FIG. 35 India Mixed Xylene Market, 2017-2030 (US$ Mn) (Kilo Tons)
FIG. 36 South Korea Mixed Xylene Market, 2017-2030 (US$ Mn) (Kilo Tons)
FIG. 37 South-East Asia Mixed Xylene Market, 2017-2030 (US$ Mn) (Kilo Tons)
FIG. 38 Rest of Asia Pacific Mixed Xylene Market, 2017-2030 (US$ Mn) (Kilo Tons)
FIG. 39 Latin America Mixed Xylene Market, 2017-2030 (US$ Mn) (Kilo Tons)
FIG. 40 Brazil Mixed Xylene Market, 2017-2030 (US$ Mn) (Kilo Tons)
FIG. 41 Mexico Mixed Xylene Market, 2017-2030 (US$ Mn) (Kilo Tons)
FIG. 42 Rest of Latin America Mixed Xylene Market, 2017-2030 (US$ Mn) (Kilo Tons)
FIG. 43 Middle East & Africa Mixed Xylene Market, 2017-2030 (US$ Mn) (Kilo Tons)
FIG. 44 GCC Countries Mixed Xylene Market, 2017-2030 (US$ Mn) (Kilo Tons)
FIG. 45 South Africa Mixed Xylene Market, 2017-2030 (US$ Mn) (Kilo Tons)
FIG. 46 Rest of Middle East and Africa Mixed Xylene Market, 2017-2030 (US$ Mn) (Kilo Tons)


List of Tables
TABLE 1 Market Snapshot: Global Mixed Xylene Market
TABLE 2 Global Mixed Xylene Market: Market Drivers Impact Analysis
TABLE 3 Global Mixed Xylene Market: Market Restraints Impact Analysis
TABLE 4 Global Mixed Xylene Market, by Competitive Benchmarking, 2022
TABLE 5 Global Mixed Xylene Market, by Geographical Presence Analysis, 2022
TABLE 6 Global Mixed Xylene Market, by Key Strategies Analysis, 2022
TABLE 7 Global Mixed Xylene Market, by Isomer Grade, By Region, 2017-2022 (US$ Mn)
TABLE 8 Global Mixed Xylene Market, by Isomer Grade, By Region, 2023-2030 (US$ Mn)
TABLE 9 Global Mixed Xylene Market, by Isomer Grade, By Region, 2017-2022 (Kilo Tons)
TABLE 10 Global Mixed Xylene Market, by Isomer Grade, By Region, 2023-2030 (Kilo Tons)
TABLE 11 Global Mixed Xylene Market, by Technical Grade, By Region, 2017-2022 (US$ Mn)
TABLE 12 Global Mixed Xylene Market, by Technical Grade, By Region, 2023-2030 (US$ Mn)
TABLE 13 Global Mixed Xylene Market, by Technical Grade, By Region, 2017-2022 (Kilo Tons)
TABLE 14 Global Mixed Xylene Market, by Technical Grade, By Region, 2023-2030 (Kilo Tons)
TABLE 15 Global Mixed Xylene Market, by Chemical Synthesis, By Region, 2017-2022 (US$ Mn)
TABLE 16 Global Mixed Xylene Market, by Chemical Synthesis, By Region, 2023-2030 (US$ Mn)
TABLE 17 Global Mixed Xylene Market, by Chemical Synthesis, By Region, 2017-2022 (Kilo Tons)
TABLE 18 Global Mixed Xylene Market, by Chemical Synthesis, By Region, 2023-2030 (Kilo Tons)
TABLE 19 Global Mixed Xylene Market, by Solvent, By Region, 2017-2022 (US$ Mn)
TABLE 20 Global Mixed Xylene Market, by Solvent, By Region, 2023-2030 (US$ Mn)
TABLE 21 Global Mixed Xylene Market, by Solvent, By Region, 2017-2022 (Kilo Tons)
TABLE 22 Global Mixed Xylene Market, by Solvent, By Region, 2023-2030 (Kilo Tons)
TABLE 23 Global Mixed Xylene Market, by Gasoline Blend, By Region, 2017-2022 (US$ Mn)
TABLE 24 Global Mixed Xylene Market, by Gasoline Blend, By Region, 2023-2030 (US$ Mn)
TABLE 25 Global Mixed Xylene Market, by Gasoline Blend, By Region, 2017-2022 (Kilo Tons)
TABLE 26 Global Mixed Xylene Market, by Gasoline Blend, By Region, 2023-2030 (Kilo Tons)
TABLE 27 Global Mixed Xylene Market, by Lubricant, By Region, 2017-2022 (US$ Mn)
TABLE 28 Global Mixed Xylene Market, by Lubricant, By Region, 2023-2030 (US$ Mn)
TABLE 29 Global Mixed Xylene Market, by Lubricant, By Region, 2017-2022 (Kilo Tons)
TABLE 30 Global Mixed Xylene Market, by Lubricant, By Region, 2023-2030 (Kilo Tons)
TABLE 31 Global Mixed Xylene Market, by Cleaning Agent, By Region, 2017-2022 (US$ Mn)
TABLE 32 Global Mixed Xylene Market, by Cleaning Agent, By Region, 2023-2030 (US$ Mn)
TABLE 33 Global Mixed Xylene Market, by Cleaning Agent, By Region, 2017-2022 (Kilo Tons)
TABLE 34 Global Mixed Xylene Market, by Cleaning Agent, By Region, 2023-2030 (Kilo Tons)
TABLE 35 Global Mixed Xylene Market, by Others, By Region, 2017-2022 (US$ Mn)
TABLE 36 Global Mixed Xylene Market, by Others, By Region, 2023-2030 (US$ Mn)
TABLE 37 Global Mixed Xylene Market, by Others, By Region, 2017-2022 (Kilo Tons)
TABLE 38 Global Mixed Xylene Market, by Others, By Region, 2023-2030 (Kilo Tons)
TABLE 39 Global Mixed Xylene Market, by Grade, 2017-2022 (US$ Mn)
TABLE 40 Global Mixed Xylene Market, by Grade, 2023-2030 (US$ Mn)
TABLE 41 Global Mixed Xylene Market, by Grade, 2017-2022 (Kilo Tons)
TABLE 42 Global Mixed Xylene Market, by Grade, 2023-2030 (Kilo Tons)
TABLE 43 Global Mixed Xylene Market, by Application, 2017-2022 (US$ Mn)
TABLE 44 Global Mixed Xylene Market, by Application, 2023-2030 (US$ Mn)
TABLE 45 Global Mixed Xylene Market, by Application, 2017-2022 (Kilo Tons)
TABLE 46 Global Mixed Xylene Market, by Application, 2023-2030 (Kilo Tons)
TABLE 47 Global Mixed Xylene Market, by Region, 2017-2022 (US$ Mn)
TABLE 48 Global Mixed Xylene Market, by Region, 2023-2030 (US$ Mn)
TABLE 49 Global Mixed Xylene Market, by Region, 2017-2022 (Kilo Tons)
TABLE 50 Global Mixed Xylene Market, by Region, 2023-2030 (Kilo Tons)
TABLE 51 North America Mixed Xylene Market, by Grade, 2017-2022 (US$ Mn)
TABLE 52 North America Mixed Xylene Market, by Grade, 2023-2030 (US$ Mn)
TABLE 53 North America Mixed Xylene Market, by Grade, 2017-2022 (Kilo Tons)
TABLE 54 North America Mixed Xylene Market, by Grade, 2023-2030 (Kilo Tons)
TABLE 55 North America Mixed Xylene Market, by Application, 2017-2022 (US$ Mn)
TABLE 56 North America Mixed Xylene Market, by Application, 2023-2030 (US$ Mn)
TABLE 57 North America Mixed Xylene Market, by Application, 2017-2022 (Kilo Tons)
TABLE 58 North America Mixed Xylene Market, by Application, 2023-2030 (Kilo Tons)
TABLE 59 North America Mixed Xylene Market, by Country, 2017-2022 (US$ Mn)
TABLE 60 North America Mixed Xylene Market, by Country, 2023-2030 (US$ Mn)
TABLE 61 North America Mixed Xylene Market, by Country, 2017-2022 (Kilo Tons)
TABLE 62 North America Mixed Xylene Market, by Country, 2023-2030 (Kilo Tons)
TABLE 63 U.S. Mixed Xylene Market, by Grade, 2017-2022 (US$ Mn)
TABLE 64 U.S. Mixed Xylene Market, by Grade, 2023-2030 (US$ Mn)
TABLE 65 U.S. Mixed Xylene Market, by Grade, 2017-2022 (Kilo Tons)
TABLE 66 U.S. Mixed Xylene Market, by Grade, 2023-2030 (Kilo Tons)
TABLE 67 U.S. Mixed Xylene Market, by Application, 2017-2022 (US$ Mn)
TABLE 68 U.S. Mixed Xylene Market, by Application, 2023-2030 (US$ Mn)
TABLE 69 U.S. Mixed Xylene Market, by Application, 2017-2022 (Kilo Tons)
TABLE 70 U.S. Mixed Xylene Market, by Application, 2023-2030 (Kilo Tons)
TABLE 71 Canada Mixed Xylene Market, by Grade, 2017-2022 (US$ Mn)
TABLE 72 Canada Mixed Xylene Market, by Grade, 2023-2030 (US$ Mn)
TABLE 73 Canada Mixed Xylene Market, by Grade, 2017-2022 (Kilo Tons)
TABLE 74 Canada Mixed Xylene Market, by Grade, 2023-2030 (Kilo Tons)
TABLE 75 Canada Mixed Xylene Market, by Application, 2017-2022 (US$ Mn)
TABLE 76 Canada Mixed Xylene Market, by Application, 2023-2030 (US$ Mn)
TABLE 77 Canada Mixed Xylene Market, by Application, 2017-2022 (Kilo Tons)
TABLE 78 Canada Mixed Xylene Market, by Application, 2023-2030 (Kilo Tons)
TABLE 79 Mexico Mixed Xylene Market, by Grade, 2017-2022 (US$ Mn)
TABLE 80 Mexico Mixed Xylene Market, by Grade, 2023-2030 (US$ Mn)
TABLE 81 Mexico Mixed Xylene Market, by Grade, 2017-2022 (Kilo Tons)
TABLE 82 Mexico Mixed Xylene Market, by Grade, 2023-2030 (Kilo Tons)
TABLE 83 Mexico Mixed Xylene Market, by Application, 2017-2022 (US$ Mn)
TABLE 84 Mexico Mixed Xylene Market, by Application, 2023-2030 (US$ Mn)
TABLE 85 Mexico Mixed Xylene Market, by Application, 2017-2022 (Kilo Tons)
TABLE 86 Mexico Mixed Xylene Market, by Application, 2023-2030 (Kilo Tons)
TABLE 87 Europe Mixed Xylene Market, by Grade, 2017-2022 (US$ Mn)
TABLE 88 Europe Mixed Xylene Market, by Grade, 2023-2030 (US$ Mn)
TABLE 89 Europe Mixed Xylene Market, by Grade, 2017-2022 (Kilo Tons)
TABLE 90 Europe Mixed Xylene Market, by Grade, 2023-2030 (Kilo Tons)
TABLE 91 Europe Mixed Xylene Market, by Application, 2017-2022 (US$ Mn)
TABLE 92 Europe Mixed Xylene Market, by Application, 2023-2030 (US$ Mn)
TABLE 93 Europe Mixed Xylene Market, by Application, 2017-2022 (Kilo Tons)
TABLE 94 Europe Mixed Xylene Market, by Application, 2023-2030 (Kilo Tons)
TABLE 95 Germany Mixed Xylene Market, by Grade, 2017-2022 (US$ Mn)
TABLE 96 Germany Mixed Xylene Market, by Grade, 2023-2030 (US$ Mn)
TABLE 97 Germany Mixed Xylene Market, by Grade, 2017-2022 (Kilo Tons)
TABLE 98 Europe Mixed Xylene Market, by Country, 2017-2022 (US$ Mn)
TABLE 99 Europe Mixed Xylene Market, by Country, 2023-2030 (US$ Mn)
TABLE 100 Europe Mixed Xylene Market, by Country, 2017-2022 (Kilo Tons)
TABLE 101 Europe Mixed Xylene Market, by Country, 2023-2030 (Kilo Tons)
TABLE 102 Germany Mixed Xylene Market, by Grade, 2023-2030 (Kilo Tons)
TABLE 103 Germany Mixed Xylene Market, by Application, 2017-2022 (US$ Mn)
TABLE 104 Germany Mixed Xylene Market, by Application, 2023-2030 (US$ Mn)
TABLE 105 Germany Mixed Xylene Market, by Application, 2017-2022 (Kilo Tons)
TABLE 106 Germany Mixed Xylene Market, by Application, 2023-2030 (Kilo Tons)
TABLE 107 France Mixed Xylene Market, by Grade, 2017-2022 (US$ Mn)
TABLE 108 France Mixed Xylene Market, by Grade, 2023-2030 (US$ Mn)
TABLE 109 France Mixed Xylene Market, by Grade, 2017-2022 (Kilo Tons)
TABLE 110 France Mixed Xylene Market, by Grade, 2023-2030 (Kilo Tons)
TABLE 111 France Mixed Xylene Market, by Application, 2017-2022 (US$ Mn)
TABLE 112 France Mixed Xylene Market, by Application, 2023-2030 (US$ Mn)
TABLE 113 France Mixed Xylene Market, by Application, 2017-2022 (Kilo Tons)
TABLE 114 France Mixed Xylene Market, by Application, 2023-2030 (Kilo Tons)
TABLE 115 U.K. Mixed Xylene Market, by Grade, 2017-2022 (US$ Mn)
TABLE 116 U.K. Mixed Xylene Market, by Grade, 2023-2030 (US$ Mn)
TABLE 117 U.K. Mixed Xylene Market, by Grade, 2017-2022 (Kilo Tons)
TABLE 118 U.K. Mixed Xylene Market, by Grade, 2023-2030 (Kilo Tons)
TABLE 119 U.K. Mixed Xylene Market, by Application, 2017-2022 (US$ Mn)
TABLE 120 U.K. Mixed Xylene Market, by Application, 2023-2030 (US$ Mn)
TABLE 121 U.K. Mixed Xylene Market, by Application, 2017-2022 (Kilo Tons)
TABLE 122 U.K. Mixed Xylene Market, by Application, 2023-2030 (Kilo Tons)
TABLE 123 Italy Mixed Xylene Market, by Grade, 2017-2022 (US$ Mn)
TABLE 124 Italy Mixed Xylene Market, by Grade, 2023-2030 (US$ Mn)
TABLE 125 Italy Mixed Xylene Market, by Grade, 2017-2022 (Kilo Tons)
TABLE 126 Italy Mixed Xylene Market, by Grade, 2023-2030 (Kilo Tons)
TABLE 127 Italy Mixed Xylene Market, by Application, 2017-2022 (US$ Mn)
TABLE 128 Italy Mixed Xylene Market, by Application, 2023-2030 (US$ Mn)
TABLE 129 Italy Mixed Xylene Market, by Application, 2017-2022 (Kilo Tons)
TABLE 130 Italy Mixed Xylene Market, by Application, 2023-2030 (Kilo Tons)
TABLE 131 Spain Mixed Xylene Market, by Grade, 2017-2022 (US$ Mn)
TABLE 132 Spain Mixed Xylene Market, by Grade, 2023-2030 (US$ Mn)
TABLE 133 Spain Mixed Xylene Market, by Grade, 2017-2022 (Kilo Tons)
TABLE 134 Spain Mixed Xylene Market, by Grade, 2023-2030 (Kilo Tons)
TABLE 135 Spain Mixed Xylene Market, by Application, 2017-2022 (US$ Mn)
TABLE 136 Spain Mixed Xylene Market, by Application, 2023-2030 (US$ Mn)
TABLE 137 Spain Mixed Xylene Market, by Application, 2017-2022 (Kilo Tons)
TABLE 138 Spain Mixed Xylene Market, by Application, 2023-2030 (Kilo Tons)
TABLE 139 Rest of Europe Mixed Xylene Market, by Grade, 2017-2022 (US$ Mn)
TABLE 140 Rest of Europe Mixed Xylene Market, by Grade, 2023-2030 (US$ Mn)
TABLE 141 Rest of Europe Mixed Xylene Market, by Grade, 2017-2022 (Kilo Tons)
TABLE 142 Rest of Europe Mixed Xylene Market, by Grade, 2023-2030 (Kilo Tons)
TABLE 143 Rest of Europe Mixed Xylene Market, by Application, 2017-2022 (US$ Mn)
TABLE 144 Rest of Europe Mixed Xylene Market, by Application, 2023-2030 (US$ Mn)
TABLE 145 Rest of Europe Mixed Xylene Market, by Application, 2017-2022 (Kilo Tons)
TABLE 146 Rest of Europe Mixed Xylene Market, by Application, 2023-2030 (Kilo Tons)
TABLE 147 Asia Pacific Mixed Xylene Market, by Grade, 2017-2022 (US$ Mn)
TABLE 148 Asia Pacific Mixed Xylene Market, by Grade, 2023-2030 (US$ Mn)
TABLE 149 Asia Pacific Mixed Xylene Market, by Grade, 2017-2022 (Kilo Tons)
TABLE 150 Asia Pacific Mixed Xylene Market, by Grade, 2023-2030 (Kilo Tons)
TABLE 151 Asia Pacific Mixed Xylene Market, by Application, 2017-2022 (US$ Mn)
TABLE 152 Asia Pacific Mixed Xylene Market, by Application, 2023-2030 (US$ Mn)
TABLE 153 Asia Pacific Mixed Xylene Market, by Application, 2017-2022 (Kilo Tons)
TABLE 154 Asia Pacific Mixed Xylene Market, by Application, 2023-2030 (Kilo Tons)
TABLE 155 Asia Pacific Mixed Xylene Market, by Country, 2017-2022 (US$ Mn)
TABLE 156 Asia Pacific Mixed Xylene Market, by Country, 2023-2030 (US$ Mn)
TABLE 157 Asia Pacific Mixed Xylene Market, by Country, 2017-2022 (Kilo Tons)
TABLE 158 Asia Pacific Mixed Xylene Market, by Country, 2023-2030 (Kilo Tons)
TABLE 159 China Mixed Xylene Market, by Grade, 2017-2022 (US$ Mn)
TABLE 160 China Mixed Xylene Market, by Grade, 2023-2030 (US$ Mn)
TABLE 161 China Mixed Xylene Market, by Grade, 2017-2022 (Kilo Tons)
TABLE 162 China Mixed Xylene Market, by Grade, 2023-2030 (Kilo Tons)
TABLE 163 China Mixed Xylene Market, by Application, 2017-2022 (US$ Mn)
TABLE 164 China Mixed Xylene Market, by Application, 2023-2030 (US$ Mn)
TABLE 165 China Mixed Xylene Market, by Application, 2017-2022 (Kilo Tons)
TABLE 166 China Mixed Xylene Market, by Application, 2023-2030 (Kilo Tons)
TABLE 167 Japan Mixed Xylene Market, by Grade, 2017-2022 (US$ Mn)
TABLE 168 Japan Mixed Xylene Market, by Grade, 2023-2030 (US$ Mn)
TABLE 169 Japan Mixed Xylene Market, by Grade, 2017-2022 (Kilo Tons)
TABLE 170 Japan Mixed Xylene Market, by Grade, 2023-2030 (Kilo Tons)
TABLE 171 Japan Mixed Xylene Market, by Application, 2017-2022 (US$ Mn)
TABLE 172 Japan Mixed Xylene Market, by Application, 2023-2030 (US$ Mn)
TABLE 173 Japan Mixed Xylene Market, by Application, 2017-2022 (Kilo Tons)
TABLE 174 Japan Mixed Xylene Market, by Application, 2023-2030 (Kilo Tons)
TABLE 175 India Mixed Xylene Market, by Grade, 2017-2022 (US$ Mn)
TABLE 176 India Mixed Xylene Market, by Grade, 2023-2030 (US$ Mn)
TABLE 177 India Mixed Xylene Market, by Grade, 2017-2022 (Kilo Tons)
TABLE 178 India Mixed Xylene Market, by Grade, 2023-2030 (Kilo Tons)
TABLE 179 India Mixed Xylene Market, by Application, 2017-2022 (US$ Mn)
TABLE 180 India Mixed Xylene Market, by Application, 2023-2030 (US$ Mn)
TABLE 181 India Mixed Xylene Market, by Application, 2017-2022 (Kilo Tons)
TABLE 182 India Mixed Xylene Market, by Application, 2023-2030 (Kilo Tons)
TABLE 183 South Korea Mixed Xylene Market, by Grade, 2017-2022 (US$ Mn)
TABLE 184 South Korea Mixed Xylene Market, by Grade, 2023-2030 (US$ Mn)
TABLE 185 South Korea Mixed Xylene Market, by Grade, 2017-2022 (Kilo Tons)
TABLE 186 South Korea Mixed Xylene Market, by Grade, 2023-2030 (Kilo Tons)
TABLE 187 South Korea Mixed Xylene Market, by Application, 2017-2022 (US$ Mn)
TABLE 188 South Korea Mixed Xylene Market, by Application, 2023-2030 (US$ Mn)
TABLE 189 South Korea Mixed Xylene Market, by Application, 2017-2022 (Kilo Tons)
TABLE 190 South Korea Mixed Xylene Market, by Application, 2023-2030 (Kilo Tons)
TABLE 191 South-East Asia Mixed Xylene Market, by Grade, 2017-2022 (US$ Mn)
TABLE 192 South-East Asia Mixed Xylene Market, by Grade, 2023-2030 (US$ Mn)
TABLE 193 South-East Asia Mixed Xylene Market, by Grade, 2017-2022 (Kilo Tons)
TABLE 194 South-East Asia Mixed Xylene Market, by Grade, 2023-2030 (Kilo Tons)
TABLE 195 South-East Asia Mixed Xylene Market, by Application, 2017-2022 (US$ Mn)
TABLE 196 South-East Asia Mixed Xylene Market, by Application, 2023-2030 (US$ Mn)
TABLE 197 South-East Asia Mixed Xylene Market, by Application, 2017-2022 (Kilo Tons)
TABLE 198 South-East Asia Mixed Xylene Market, by Application, 2023-2030 (Kilo Tons)
TABLE 199 Rest of Asia Pacific Mixed Xylene Market, by Grade, 2017-2022 (US$ Mn)
TABLE 200 Rest of Asia Pacific Mixed Xylene Market, by Grade, 2023-2030 (US$ Mn)
TABLE 201 Rest of Asia Pacific Mixed Xylene Market, by Grade, 2017-2022 (Kilo Tons)
TABLE 202 Rest of Asia Pacific Mixed Xylene Market, by Grade, 2023-2030 (Kilo Tons)
TABLE 203 Rest of Asia Pacific Mixed Xylene Market, by Application, 2017-2022 (US$ Mn)
TABLE 204 Rest of Asia Pacific Mixed Xylene Market, by Application, 2023-2030 (US$ Mn)
TABLE 205 Rest of Asia Pacific Mixed Xylene Market, by Application, 2017-2022 (Kilo Tons)
TABLE 206 Rest of Asia Pacific Mixed Xylene Market, by Application, 2023-2030 (Kilo Tons)
TABLE 207 Latin America Mixed Xylene Market, by Grade, 2017-2022 (US$ Mn)
TABLE 208 Latin America Mixed Xylene Market, by Grade, 2023-2030 (US$ Mn)
TABLE 209 Latin America Mixed Xylene Market, by Grade, 2017-2022 (Kilo Tons)
TABLE 210 Latin America Mixed Xylene Market, by Grade, 2023-2030 (Kilo Tons)
TABLE 211 Latin America Mixed Xylene Market, by Application, 2017-2022 (US$ Mn)
TABLE 212 Latin America Mixed Xylene Market, by Application, 2023-2030 (US$ Mn)
TABLE 213 Latin America Mixed Xylene Market, by Application, 2017-2022 (Kilo Tons)
TABLE 214 Latin America Mixed Xylene Market, by Application, 2023-2030 (Kilo Tons)
TABLE 215 Latin America Mixed Xylene Market, by Country, 2017-2022 (US$ Mn)
TABLE 216 Latin America Mixed Xylene Market, by Country, 2023-2030 (US$ Mn)
TABLE 217 Latin America Mixed Xylene Market, by Country, 2017-2022 (Kilo Tons)
TABLE 218 Latin America Mixed Xylene Market, by Country, 2023-2030 (Kilo Tons)
TABLE 219 Brazil Mixed Xylene Market, by Grade, 2017-2022 (US$ Mn)
TABLE 220 Brazil Mixed Xylene Market, by Grade, 2023-2030 (US$ Mn)
TABLE 221 Brazil Mixed Xylene Market, by Grade, 2017-2022 (Kilo Tons)
TABLE 222 Brazil Mixed Xylene Market, by Grade, 2023-2030 (Kilo Tons)
TABLE 223 Brazil Mixed Xylene Market, by Application, 2017-2022 (US$ Mn)
TABLE 224 Brazil Mixed Xylene Market, by Application, 2023-2030 (US$ Mn)
TABLE 225 Brazil Mixed Xylene Market, by Application, 2017-2022 (Kilo Tons)
TABLE 226 Brazil Mixed Xylene Market, by Application, 2023-2030 (Kilo Tons)
TABLE 227 Argentina Mixed Xylene Market, by Grade, 2017-2022 (US$ Mn)
TABLE 228 Argentina Mixed Xylene Market, by Grade, 2023-2030 (US$ Mn)
TABLE 229 Argentina Mixed Xylene Market, by Grade, 2017-2022 (Kilo Tons)
TABLE 230 Argentina Mixed Xylene Market, by Grade, 2023-2030 (Kilo Tons)
TABLE 231 Argentina Mixed Xylene Market, by Application, 2017-2022 (US$ Mn)
TABLE 232 Argentina Mixed Xylene Market, by Application, 2023-2030 (US$ Mn)
TABLE 233 Argentina Mixed Xylene Market, by Application, 2017-2022 (Kilo Tons)
TABLE 234 Argentina Mixed Xylene Market, by Application, 2023-2030 (Kilo Tons)
TABLE 235 Rest of Latin America Mixed Xylene Market, by Grade, 2017-2022 (US$ Mn)
TABLE 236 Rest of Latin America Mixed Xylene Market, by Grade, 2023-2030 (US$ Mn)
TABLE 237 Rest of Latin America Mixed Xylene Market, by Grade, 2017-2022 (Kilo Tons)
TABLE 238 Rest of Latin America Mixed Xylene Market, by Grade, 2023-2030 (Kilo Tons)
TABLE 239 Rest of Latin America Mixed Xylene Market, by Application, 2017-2022 (US$ Mn)
TABLE 240 Rest of Latin America Mixed Xylene Market, by Application, 2023-2030 (US$ Mn)
TABLE 241 Rest of Latin America Mixed Xylene Market, by Application, 2017-2022 (Kilo Tons)
TABLE 242 Rest of Latin America Mixed Xylene Market, by Application, 2023-2030 (Kilo Tons)
TABLE 243 Middle East and Africa Mixed Xylene Market, by Grade, 2017-2022 (US$ Mn)
TABLE 244 Middle East and Africa Mixed Xylene Market, by Grade, 2023-2030 (US$ Mn)
TABLE 245 Middle East and Africa Mixed Xylene Market, by Grade, 2017-2022 (Kilo Tons)
TABLE 246 Middle East and Africa Mixed Xylene Market, by Grade, 2023-2030 (Kilo Tons)
TABLE 247 Middle East and Africa Mixed Xylene Market, by Application, 2017-2022 (US$ Mn)
TABLE 248 Middle East and Africa Mixed Xylene Market, by Application, 2023-2030 (US$ Mn)
TABLE 249 Middle East and Africa Mixed Xylene Market, by Application, 2017-2022 (Kilo Tons)
TABLE 250 Middle East and Africa Mixed Xylene Market, by Application, 2023-2030 (Kilo Tons)
TABLE 251 Middle East and Africa Mixed Xylene Market, by Country, 2017-2022 (US$ Mn)
TABLE 252 Middle East and Africa Mixed Xylene Market, by Country, 2023-2030 (US$ Mn)
TABLE 253 Middle East and Africa Mixed Xylene Market, by Country, 2017-2022 (Kilo Tons)
TABLE 254 Middle East and Africa Mixed Xylene Market, by Country, 2023-2030 (Kilo Tons)
TABLE 255 GCC Countries Mixed Xylene Market, by Grade, 2017-2022 (US$ Mn)
TABLE 256 GCC Countries Mixed Xylene Market, by Grade, 2023-2030 (US$ Mn)
TABLE 257 GCC Countries Mixed Xylene Market, by Grade, 2017-2022 (Kilo Tons)
TABLE 258 GCC Countries Mixed Xylene Market, by Grade, 2023-2030 (Kilo Tons)
TABLE 259 GCC Countries Mixed Xylene Market, by Application, 2017-2022 (US$ Mn)
TABLE 260 GCC Countries Mixed Xylene Market, by Application, 2023-2030 (US$ Mn)
TABLE 261 GCC Countries Mixed Xylene Market, by Application, 2017-2022 (Kilo Tons)
TABLE 262 GCC Countries Mixed Xylene Market, by Application, 2023-2030 (Kilo Tons)
TABLE 263 South Africa Mixed Xylene Market, by Grade, 2017-2022 (US$ Mn)
TABLE 264 South Africa Mixed Xylene Market, by Grade, 2023-2030 (US$ Mn)
TABLE 265 South Africa Mixed Xylene Market, by Grade, 2017-2022 (Kilo Tons)
TABLE 266 South Africa Mixed Xylene Market, by Grade, 2023-2030 (Kilo Tons)
TABLE 267 South Africa Mixed Xylene Market, by Application, 2017-2022 (US$ Mn)
TABLE 268 South Africa Mixed Xylene Market, by Application, 2023-2030 (US$ Mn)
TABLE 269 South Africa Mixed Xylene Market, by Application, 2017-2022 (Kilo Tons)
TABLE 270 South Africa Mixed Xylene Market, by Application, 2023-2030 (Kilo Tons)
TABLE 271 Rest of Middle East and Africa Mixed Xylene Market, by Grade, 2017-2022 (US$ Mn)
TABLE 272 Rest of Middle East and Africa Mixed Xylene Market, by Grade, 2023-2030 (US$ Mn)
TABLE 273 Rest of Middle East and Africa Mixed Xylene Market, by Grade, 2017-2022 (Kilo Tons)
TABLE 274 Rest of Middle East and Africa Mixed Xylene Market, by Grade, 2023-2030 (Kilo Tons)
TABLE 275 Rest of Middle East and Africa Mixed Xylene Market, by Application, 2017-2022 (US$ Mn)
TABLE 276 Rest of Middle East and Africa Mixed Xylene Market, by Application, 2023-2030 (US$ Mn)
TABLE 277 Rest of Middle East and Africa Mixed Xylene Market, by Application, 2017-2022 (Kilo Tons)
TABLE 278 Rest of Middle East and Africa Mixed Xylene Market, by Application, 2023-2030 (Kilo Tons)

Frequently Asked Questions

What is the present global market size of mixed xylene?

The global mixed xylene market was valued at USD 38.1 Million in 2022.

What is the expected global growth rate of the mixed xylene market between 2023 and 2030?

The mixed xylene market is predicted to expand at a CAGR of 6.80% between 2023 and 2030.

What will the global market size of mixed xylene be in 2030?

The global mixed xylene market will be valued at USD 60.38 Million in 2030.

Which segment is leading the market share in terms of grade?

Isomer grade is the leading segment by material, holding over 68.7% share in terms of value in 2022.

Which application segment governs the demand for mixed xylenes in the world?

The solvents segment governs the demand for mixed xylenes in the world, holding a massive share of over 48.7% in 2022.

Which region is fueling the growth of the mixed xylene industry?

North America is fueling the growth of the mixed xylene industry, with an over one-third share in 2022.

Who are the notable market players in the global mixed xylene market?

The top players include Idemitsu Kosan Co. Ltd., Royal Dutch Shell, Sumitomo Chemical Company, and Chevron Phillips Chemical Company. Other major players include GS Caltex Corporation, Galp Energia, Yeochun NCC Co. Ltd., and Lotte Chemical.

What are the leading market drivers of the mixed xylene industry?

The increased demand for paints and coatings can be related to the rising need for mixed xylenes.

What are the major market restraints of the mixed xylene industry?

While the mixed xylene industry is expanding, it is being hampered by severe safety regulations associated with xylene manufacturing and transportation.

What are the major market opportunities of the mixed xylene industry?

The growing demand for bio-based xylene is a major opportunity in the mixed xylene industry.

Powder Coating Market

Published:
Report ID: 10783

Masterbatch Market

Published:
Report ID: 37059

Polycrystalline CVD Diamond Market

Published:
Report ID: 37009

Middle East and Africa Masterbatch Market

Published:
Report ID: 36966

Ferrous Slag Market

Published:
Report ID: 6261

Surfactants Market

Published:
Report ID: 10221

Graphite Market

Published:
Report ID: 6554

Saudi Arabia Plastic Products Market

Published:
Report ID: 36905

Copper Oxychloride Market

Published:
Report ID: 12415

India Oilfield Services Market

Published:
Report ID: 36781

Collagen Market

Published:
Report ID: 36725

Isostearic Acid Market

Published:
Report ID: 7580

Purchase Options

$2999
Delivery Format: Excel.
$4999
Designed for the individual purchaser.
$6999
Users located at a single corporate site or regional office.
$7999
Allowed for unlimited sharing globally within one company.
Smallform of Sample request

Have a question?

User Profile

Don’t settle for less – trust Mitul to help you find the best solution.

Report delivery within 24 to 48 hours

– Other Info –

What people say?-

User Review

I am very impressed with the information in this report. The author clearly did their research when they came up with this product and it has already given me a lot of ideas.

Jana Schmidt
CEDAR CX Technologies

– Connect with us –

Phone

+91 6232 49 3207


support

24/7 Research Support


sales@credenceresearch.com

– Research Methodology –

Going beyond the basics: advanced techniques in research methodology

– Trusted By –

Pepshi, LG, Nestle
Motorola, Honeywell, Johnson and johnson
LG Chem, SIEMENS, Pfizer
Unilever, Samsonite, QIAGEN