
Market Overview:
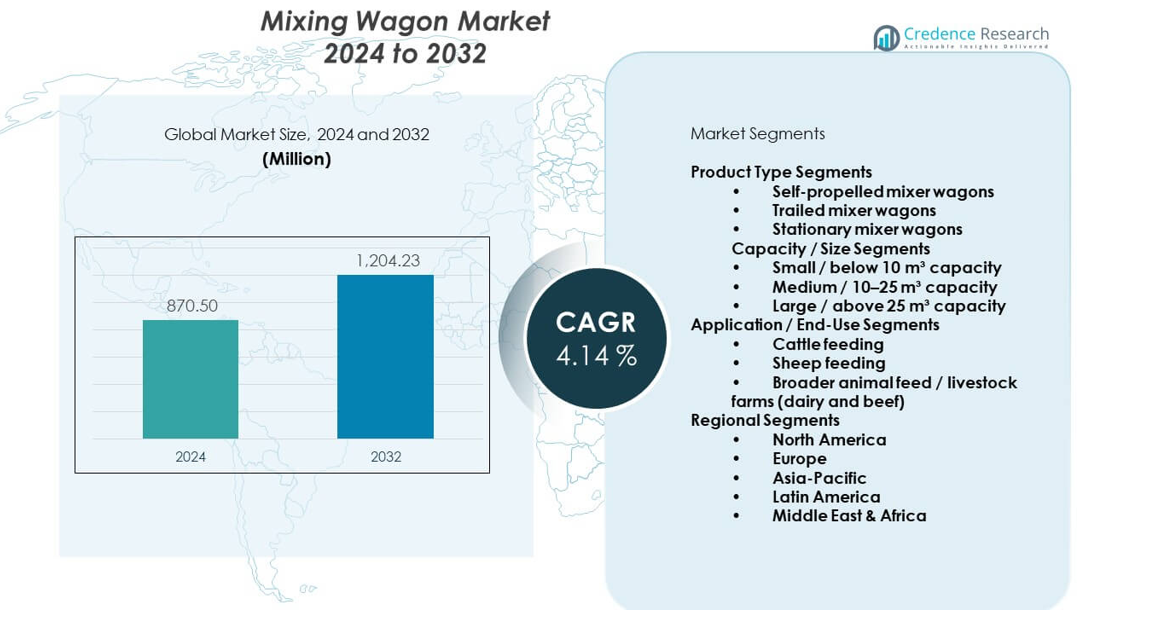
The Mixing wagon market is projected to grow from USD 870.5 million in 2024 to an estimated USD 1204.23 million by 2032, with a compound annual growth rate (CAGR) of 4.14% from 2024 to 2032.
| REPORT ATTRIBUTE | DETAILS |
|---|---|
| Historical Period | 2020-2023 |
| Base Year | 2024 |
| Forecast Period | 2025-2032 |
| Mixing Wagon Market Size 2024 | USD 870.5 million |
| Mixing Wagon Market, CAGR | 4.14% |
| Mixing Wagon Market Size 2032 | USD 1204.23 million |
Strong demand for consistent feed quality drives wider adoption across dairy and cattle farms. Farmers seek machines that cut labour time and improve herd nutrition outcomes. Brands focus on durable builds that support long operating cycles. Automation gains support within medium farms due to rising productivity needs. Demand strengthens further through wider awareness of feed uniformity benefits. Producers adopt models that lower fuel use and improve handling ease. These combined drivers create a steady push for advanced mixing units.
Europe leads due to strong dairy clusters and faster adoption of automated feeding systems. North America follows with high equipment renewal rates across medium farms. Asia Pacific grows faster due to herd expansion and farm mechanization programs. Latin America gains momentum as dairy infrastructure improves. Middle East regions explore advanced feeding tools due to controlled farm setups. Africa remains emerging with growing interest in basic mixer models. This mix shapes a diverse geographic landscape
Market Insights:
- The Mixing wagon market is valued at USD 870.5 million in 2024 and is projected to reach USD 1204.23 million by 2032, reflecting a 14% CAGR supported by rising mechanization and steady herd expansion.
- North America holds about 34%, driven by large commercial dairy farms and strong equipment renewal; Europe holds around 30% due to strict feed management standards; Asia Pacific holds nearly 22%, supported by rapid dairy sector expansion.
- Asia Pacific is the fastest-growing region, holding an estimated 22% share, with growth driven by farm modernization programs, herd expansion, and rising adoption of medium and large mixer wagons.
- Trailed mixer wagons account for roughly 45% of product-type share, supported by flexibility, lower cost, and wide use across medium farms.
- Medium-capacity mixers (10–25 m³) hold about 48% of capacity share, reflecting strong suitability for growing dairy herds and balanced feed cycle performance.
Market Drivers:
Rising Demand for Uniform Feed Distribution Across Expanding Livestock Farms
Uniform feed quality supports stronger herd performance, and it strengthens demand across the Mixing wagon market. Farmers focus on precise blending to support daily nutrition goals. The need for reduced manual workload pushes interest in efficient feeding systems. Large herds adopt bigger wagons that support higher batch volumes. Digital controls assist farmers who require consistent mixing outcomes. Fuel-efficient designs help farms lower recurring operating costs. Strong awareness of feed uniformity guides equipment purchases. This pattern builds consistent growth within the sector.
- For instance, Alltech KEENAN machines operate in more than 60 countries and use MechFiber technology that supports consistent ration structure across high-yield dairy units.
Growing Adoption of Mechanized Feeding Solutions in Dairy and Beef Operations
Mechanized systems drive interest because farmers want higher reliability in daily feeding routines. The shift toward automated barns encourages new purchases of mixing units. The Mixing wagon market gains strong traction from farms upgrading older machines. High-capacity models support herds that demand multiple feeding cycles. Precision knives help users who want controlled cutting efficiency. Durable auger designs support continuous workloads during peak periods. Producers choose wagons that limit downtime and strengthen productivity. This wider acceptance strengthens sector momentum.
- For instance, Strautmann’s Verti-Mix series offers capacities up to 45 m³, enabling large dairy farms to run multiple feeding rounds without interruption.
Advancements in Automation and Digital Monitoring Tools for Precision Feeding
Digital sensors help operators monitor feed quality and mixing stages. Smart wagons track ingredient ratios that support more accurate diets. The Mixing wagon market shows strong movement as farms adopt data-based routines. Automated weigh systems help reduce handling errors during busy schedules. Connectivity features assist managers who want real-time performance checks. Remote dashboards guide feeding teams during routine management. Better software support brings higher accuracy in feed preparation. These upgrades drive strong interest in smarter machines.
Increasing Focus on Cost Reduction and Labor Efficiency in Modern Farming
Labor shortages push farms toward equipment that supports faster operations. The Mixing wagon market gains value from rising pressure to reduce daily workloads. Users adopt models that optimize feed cycles within limited staffing. Lower maintenance needs allow farms to manage long-term costs. Stable construction supports heavier mixes during extended operations. Easy-clean chambers help crews who want shorter resets between batches. Compact designs assist small farms upgrading basic feeding tools. Strong interest in efficiency improvements expands equipment demand.
Market Trends:
Shift Toward High-Capacity Vertical and Horizontal Mixers for Large Herd Structures
Large dairy clusters select mixers that manage heavy loads with steady precision. Farms upgrade to vertical systems that support fiber-rich rations. Horizontal units help teams that prefer faster blending actions. The Mixing wagon market shows strong movement toward models that suit expanding barns. Hydraulics improve handling for rougher feed materials during peak periods. Reinforced frames support operators who run multiple batches daily. Stronger auger mechanisms help reduce clogging under dense mixtures. This trend supports higher performance expectations.
- For instance, Trioliet’s Solomix mixers-exported to over 50 countries-are engineered with heavy-duty augers designed for dense, fiber-rich rations.
Rising Integration of Telematics, GPS, and Remote Operation Features in Feeding Equipment
Smart systems support farms that want better visibility into feeding routines. Telematics track daily usage to improve equipment planning. The Mixing wagon market gains strength from remote control modules. GPS helps teams who want accurate route guidance during feeding runs. Real-time alerts support mechanics who monitor system loads. Digital dashboards help farmers compare batch results across seasons. Connectivity aids decision-making during ration adjustments. This trend highlights the move toward digital feeding ecosystems.
- For instance, KUHN’s SPW Power self-propelled mixers integrate advanced monitoring systems that support real-time operational oversight across feeding cycles.
Growing Interest in Electric and Hybrid Mixing Wagons for Cleaner Farm Operations
Electric drives support farms aiming for lower emissions in daily routines. Hybrid systems reduce fuel burn during repeated mixing cycles. The Mixing wagon market benefits from this shift toward low-noise operation. Battery packs help operators who want steady torque during mixing. Quiet motors support barns that focus on reduced stress for animals. Cleaner operation helps meet rising sustainability goals across regions. Reduced fluid leaks support farms aiming for cleaner yards. This movement strengthens interest in eco-aligned equipment.
Adoption of Modular, Customizable, and Region-Specific Mixer Designs Across Diverse Farm Sizes
Custom builds support farms that need unique capacities for daily feeding patterns. Modular layouts help teams adjust features over equipment life cycles. The Mixing wagon market moves toward flexible builds tailored to herd sizes. Compact units support smaller farms modernizing feeding routines. Larger wagons meet the needs of farms expanding their milking capacity. Region-specific materials help equipment survive harsh climates. Adjustable auger speeds improve accuracy for different feed types. This trend aligns machines with varied global farm structures.
Market Challenges Analysis:
High Equipment Costs and Limited Access to Skilled Operators in Developing Regions
High upfront cost limits adoption for farms that manage tight budgets within the Mixing wagon market. Many small operators delay upgrades due to long payback periods. Financing barriers restrict large-capacity purchases across rural areas. Complex controls require trained operators during peak feeding cycles. Limited technical staff slows service cycles in remote regions. Repairs take longer where dealer networks remain thin. Training gaps create handling errors during mix preparation. These hurdles slow wider modernization.
Maintenance Burden, Fuel Volatility, and Compatibility Issues with Diverse Feed Types
Wear on cutting blades increases downtime when farms run dense materials. Fuel volatility affects operating cost plans during long feeding seasons. The Mixing wagon market faces issues when units fail under high-fiber mixes. Bearings need steady lubrication that many farms overlook. Gearbox failures arise when wagons handle irregular feed loads. Service intervals vary, making planning difficult for busy crews. Parts availability challenges extend repair cycles in remote areas. These issues hinder smoother equipment deployment.
Market Opportunities:
Expansion of Automated Feeding Infrastructure in Dairy-Intensive Regions Across the Globe
Demand rises in areas growing their dairy capacity, offering strong upside for the Mixing wagon market. Automation helps farms scale feeding routines with fewer resources. Integrated weigh systems support herds requiring precise nutrition tracking. Digital tools allow real-time ration planning in progressive barns. Wider dealer networks create new entry points for manufacturers. Upgrading old barns creates new replacement cycles. This opportunity expands as regions modernize dairy management.
Rising Interest in Sustainable, Electric, and Low-Noise Wagons for Future-Ready Farm Operations
Eco-aligned machines gain strong appeal among farms targeting clean operation goals. Electric wagons support quiet feeding cycles during early hours. Sustainable builds help meet regulatory pressure across modern farms. Low-noise drives reduce animal stress during peak seasons. Longer battery life supports farms working on extended shifts. Cleaner operation reduces spill-related maintenance. This opportunity expands interest in next-generation mixer models.
Market Segmentation Analysis:
Product Type Segments
Self-propelled units gain steady traction among large farms that prefer higher mobility during daily cycles. Trailed mixer wagons hold the dominant share due to strong suitability for medium and small farms that want flexible towing options. Stationary models serve barns that operate fixed feeding lines and prefer controlled indoor mixing. The Mixing wagon market shows balanced demand across these formats because each model supports distinct farm setups. It maintains stable adoption as dairy and beef operations continue to upgrade basic feeding tools.
Capacity / Size Segments
Small units below 10 m³ support compact farms that require precise feeding within limited barn space. Medium wagons between 10–25 m³ record strong usage because they match the needs of growing herds. Large units above 25 m³ support high-volume mixing cycles in commercial farms. Buyers choose capacities based on herd size, feed density, and workflow speed. It gains steady growth in medium and large segments as farms scale production cycles.
- For instance, Seko Industries manufactures mixer wagons with capacities exceeding 30 m³ to support high-output dairy farms that require intensive daily mixing volumes.
Application / End-Use Segments
Cattle feeding remains the primary application due to high demand across dairy and beef farms. Sheep feeding adopts smaller wagons that support lighter rations and shorter cycles. Broader livestock farms prefer medium and high-capacity systems that improve feeding consistency. Users focus on models that support reliable ration uniformity during peak seasons. It gains stronger momentum across cattle-dominant regions where mechanized feeding expands.
Segmentation:
Product Type Segments
- Self-propelled mixer wagons
- Trailed mixer wagons
- Stationary mixer wagons
Capacity / Size Segments
- Small / below 10 m³ capacity
- Medium / 10–25 m³ capacity
- Large / above 25 m³ capacity
Application / End-Use Segments
- Cattle feeding
- Sheep feeding
- Broader animal feed / livestock farms (dairy and beef)
Regional Segments
- North America
- U.S.
- Canada
- Mexico
- Europe
- Germany
- France
- U.K.
- Italy
- Spain
- Rest of Europe
- Asia Pacific
- China
- Japan
- India
- South Korea
- South-east Asia
- Rest of Asia Pacific
- Latin America
- Brazil
- Argentina
- Rest of Latin America
- Middle East & Africa
- GCC Countries
- South Africa
- Rest of the Middle East and Africa
Regional Analysis:
North America
North America holds the largest share of the Mixing wagon market due to strong dairy consolidation and high mechanization rates. Large herds drive steady demand for high-capacity machines that support faster feeding cycles. Farmers prefer automated systems that reduce labour stress during peak seasons. Advanced dealership networks improve equipment access across major dairy belts. The region benefits from strong equipment renewal trends that support continuous upgrades. It maintains a leading position because commercial farms adopt precision feeding tools at a faster pace.
Europe
Europe secures the second-largest share due to dense dairy clusters and strict feed management standards. Farms adopt mixer wagons that support fibre-rich rations and consistent herd nutrition. Users prefer energy-efficient designs that align with regional sustainability goals. Strong manufacturing presence strengthens access to advanced models. The region shows steady replacement cycles driven by ageing equipment fleets. It retains high penetration across Western Europe where dairy operations follow structured feeding systems.
Asia Pacific, Latin America, and Middle East & Africa
Asia Pacific records the fastest growth and holds an expanding share as farm mechanization accelerates across emerging dairy regions. Herd expansion programs in key countries support wider adoption of medium and large wagons. Latin America captures a moderate share driven by rising investment in modern feeding tools. Structured dairy zones in select countries encourage upgrades to advanced mixing systems. Middle East & Africa maintain a smaller share because adoption remains early but growing. It gains momentum in regions developing controlled dairy environments.
Key Player Analysis:
- KUHN Group / KUHN
- Trioliet
- Faresin Industries
- SILOKING (Siloking Mayer Maschinenbau)
- Supreme International
- Jaylor (Jaylor Fabricating)
- Storti SpA
- Seko Industries
- Strautmann (B. Strautmann & Söhne / Strautmann Umwelttechnik)
- Alltech (KEENAN) / Alltech Farming Solutions
- NDEco (New Direction Equipment)
- DeLaval
Competitive Analysis:
The Mixing wagon market features strong competition driven by global manufacturers that focus on durable builds, advanced mixing technology, and reliable service networks. Leading brands invest in automated controls to support consistent ration output for dairy and beef farms. Product lines cover self-propelled, trailed, and stationary formats that meet varied farm sizes. Companies strengthen portfolios with high-capacity units that support large herd operations. Partnerships with dealer networks improve rural availability. It gains momentum as players introduce energy-efficient drives and digital monitoring tools. The sector remains highly competitive due to steady product upgrades and expanding regional footprints.
Recent Developments:
- In 2025, KUHN Group launched several innovations including a new fine-cut system for its VBP 7100 series baler-wrapper combinations and a 14.5m mounted disc mower, responding to demand for shorter-cut silage and efficiency in mowing operations.
Report Coverage:
The research report offers an in-depth analysis based on Product Type Segments and Capacity / Size Segments. It details leading market players, providing an overview of their business, product offerings, investments, revenue streams, and key applications. Additionally, the report includes insights into the competitive environment, SWOT analysis, current market trends, as well as the primary drivers and constraints. Furthermore, it discusses various factors that have driven market expansion in recent years. The report also explores market dynamics, regulatory scenarios, and technological advancements that are shaping the industry. It assesses the impact of external factors and global economic changes on market growth. Lastly, it provides strategic recommendations for new entrants and established companies to navigate the complexities of the market.
Future Outlook:
- Demand for automated feeding solutions rises across expanding dairy zones.
- Adoption of high-capacity mixers grows as herd sizes increase globally.
- Electric mixer wagons gain attention due to sustainability goals.
- Digital monitoring tools support precision feeding across modern farms.
- Stronger dealer networks push higher adoption in developing regions.
- Replacement of ageing machinery supports long-term market stability.
- Compact mixers see wider acceptance among small and mid-sized farms.
- Increased focus on fuel efficiency supports upgrades to newer models.
- Regional customization boosts demand in harsh or varied climates.
- Advancements in auger and blade design improve mixing performance.

Request a Free Sample
Fill in your details and we'll send you a free sample report.
- Sample data tables & charts
- Research methodology
Need a Custom Version of This Report?
Tailor the scope, geography, or segments to your exact requirements.
- Custom geography or segment scope
- Direct access to our analyst team
Frequently Asked Questions
What is the current market size for the Mixing wagon market, and what is its projected size in 2032?
At what Compound Annual Growth Rate is the Mixing wagon market projected to grow between 2025 and 2032?
Which region will contribute notably towards the mixing wagon market value?
Which are the significant players leveraging the mixing wagon market growth?
What are the primary factors fueling the growth of the Mixing wagon market?
Who are the leading companies in the Mixing wagon market?
Table of Content
Chapter 1. Report Introduction
- 1.1 Report Description & Purpose
- 1.1.1 Report Title & Market Definition
- 1.1.2 Unique Selling Propositions (USP) & Key Differentiators
- 1.1.3 Value Proposition for Stakeholders
- 1.2 Research Objectives
- 1.2.1 Market Sizing Objectives (Volume & Revenue) (Volume Where Applicable)
- 1.2.2 Segmentation Objectives
- 1.2.3 Competitive Intelligence Objectives
- 1.2.4 Forecast & Scenario Objectives
- 1.3 Report Scope
- 1.3.1 Mixing Wagon Scope – Segments & Subsegments Covered
- 1.3.2 Geographic Scope – Regions & Countries Covered
- 1.3.3 Historical Period, Base Year & Forecast Period (2024; forecast to 2032)
- 1.3.4 Inclusions & Exclusions
- 1.4 Industry Classification & Applicable Codes
- 1.5 Currency, Measurement Units & Valuation Basis
- 1.6 Target Stakeholders
- 1.7 Limitations & Assumptions
Chapter 2. Executive Summary
- 2.1 Global Mixing Wagon Market Snapshot
- 2.1.1 Market Size – Historical (2024) & Forecast (2024-2032) (2024: USD 870.5 million → 2032: USD 1204.23 million)
- 2.1.2 Volume & Revenue – Global Totals (Volume Where Applicable)
- 2.1.3 Key Market Highlights – Top Five Facts
- 2.2 Mixing Wagon Market Segmentation Snapshot
- 2.2.1 Market Split by Region – 2024 vs. 2032
- 2.3 Competitive Snapshot
- 2.3.1 Top 10 Players by Revenue Share – 2024
- 2.3.2 Top 10 Players by Volume Share – 2024 (Volume Where Applicable)
- 2.3.3 Recent Strategic Developments (18-Month Summary)
- 2.4 Key Investment Highlights & Strategic Conclusions
Chapter 3. Mixing Wagon Market Dynamics & Industry Analysis
- 3.1 Market Overview & Context
- 3.1.1 Mixing Wagon Market Position in the Broader Industry Value Chain
- 3.1.2 Demand Structure & Purchasing Dynamics
- 3.1.3 Market Maturity & Development Stage by Region
- 3.2 Mixing Wagon Market Drivers
- 3.3 Mixing Wagon Market Restraints & Challenges
- 3.4 Mixing Wagon Market Opportunities
- 3.5 Porter's Five Forces Analysis
- 3.5.1 Threat of New Entrants
- 3.5.2 Bargaining Power of Suppliers
- 3.5.3 Bargaining Power of Buyers
- 3.5.4 Threat of Substitutes
- 3.5.5 Competitive Rivalry – Intensity Assessment
- 3.6 Mixing Wagon Value Chain Analysis
- 3.6.1 Upstream – Key Inputs, Resources & Suppliers
- 3.6.1.1 Key Input/Resource 1
- 3.6.1.2 Key Input/Resource 2
- 3.6.1.3 Key Input/Resource 3
- 3.6.2 Midstream – Core Operations & Value Creation
- 3.6.2.1 Operating Model & Process Overview
- 3.6.2.2 Key Operating Locations & Capabilities by Company
- 3.6.3 Downstream – Market Channels & End Users
- 3.6.3.1 Direct Sales & Customer Engagement Channels
- 3.6.3.2 Indirect Sales, Intermediaries & Partner Channels
- 3.6.4 Value Chain Profitability Analysis
- 3.6.1 Upstream – Key Inputs, Resources & Suppliers
- 3.7 PESTEL Analysis
- 3.7.1 Political Factors
- 3.7.2 Economic Factors
- 3.7.3 Social Factors
- 3.7.4 Technological Factors
- 3.7.5 Environmental Factors
- 3.7.6 Legal Factors
- 3.8 Mixing Wagon Supply Chain Analysis
- 3.8.1 Critical Input & Resource Availability Risk Assessment
- 3.8.2 Supplier & Operational Concentration Risk (Geographic Exposure)
- 3.8.3 Supply & Service Disruption Impact Analysis
- 3.9 Regulatory & Policy Landscape
Note: The regulatory and policy landscape section covers regulations based on their applicability to the market, Mixing Wagon category, geography, and scope of the study. Only regulatory frameworks with a material impact on operations, compliance, trade, sustainability, or market access are analyzed in detail.
Chapter 4. Key Investment Pockets & Opportunity Analysis
- 4.1 Mixing Wagon Market Attractiveness Analysis
- 4.1.1 By Region – Investment Attractiveness Matrix (Market Size × CAGR)
- 4.2 Absolute Revenue Growth Opportunity
- 4.2.1 By Region – Absolute Revenue Growth Through 2032
- 4.3 Incremental Demand Opportunity
- 4.3.1 By Region – Incremental Demand Through 2032
- 4.3.2 Segment – Incremental Demand
- 4.4 Emerging Submarket Opportunity Deep Dive (Subject to Applicability)
- 4.5 Priority Market Opportunity Scorecards
- 4.5.1 United States
- 4.5.2 Europe
- 4.5.3 Asia
- 4.5.4 Middle East & Africa
Note: Priority market opportunity scorecards reflect the geographic scope and strategic relevance of the study. Listed markets are indicative and may be adapted to the industry.
Chapter 5. Mixing Wagon Cross-Border Trade & Market Access Analysis
- 5.1 International Trade & Cross-Border Activity Overview
- 5.1.1 Global Export Value by Country (2024)
- 5.1.2 Global Export Volume by Country (2024) (Volume Where Applicable)
- 5.1.3 Global Import Value by Country (2024)
- 5.1.4 Global Import Volume by Country (2024) (Volume Where Applicable)
- 5.1.5 Net Trade Balance by Country (2024)
- 5.2 Export Analysis – Segment
- 5.2.1 Category 1 (Applicable Classification Code)
- 5.2.2 Category 2 (Applicable Classification Code)
- 5.2.3 Category 3 (Applicable Classification Code)
- 5.2.4 Category 4 (Applicable Classification Code)
- 5.2.5 Category 5 (Applicable Classification Code)
- 5.3 Import Analysis – Segment
- 5.3.1 Category 1 (Applicable Classification Code)
- 5.3.2 Category 2 (Applicable Classification Code)
- 5.3.3 Category 3 (Applicable Classification Code)
- 5.3.4 Category 4 (Applicable Classification Code)
- 5.3.5 Category 5 (Applicable Classification Code)
- 5.4 Cross-Border Pricing & Transaction Benchmarks
- 5.4.1 Export Pricing – Segment & Country
- 5.4.2 Import Pricing – Segment & Source Country
- 5.4.3 Price Trends (2024)
- 5.5 Key Cross-Border Trade & Delivery Routes
- 5.5.1 Cross-Border Trade/Delivery Route 1
- 5.5.2 Cross-Border Trade/Delivery Route 2
- 5.5.3 Cross-Border Trade/Delivery Route 3
- 5.5.4 Cross-Border Trade/Delivery Route 4
- 5.5.5 Cross-Border Trade/Delivery Route 5
- 5.6 Trade Policy & Market Access Impact Assessment
- 5.6.1 Tariff & Non-Tariff Barriers
- 5.6.2 Regional Trade & Economic Integration Frameworks
- 5.6.3 Bilateral & Multilateral Trade Agreements
- 5.6.4 Cross-Border Operating, Licensing & Localization Requirements
Note: This chapter applies where cross-border trade or delivery is relevant to Mixing Wagon. Goods, services, and digital offerings are assessed using applicable classifications and transaction measures. Import-export volumes, trade balances, and route analyses are included only where meaningful to the market.
Chapter 6. Competitive Landscape & Company Benchmarking
- 6.1 Mixing Wagon Market Concentration & Structure
- 6.1.1 Herfindahl-Hirschman Index (HHI) – vs. 2024
- 6.1.2 Leading, Mid-Sized & Emerging Player Structure
- 6.1.3 Global, Regional & Local Player Dynamics
- 6.2 Mixing Wagon Market Share Analysis – 2024
- 6.2.1 Global Revenue Share by Company
- 6.2.2 Global Volume Share by Company (Volume Where Applicable)
- 6.2.3 Regional Revenue Share
- 6.2.4 Market Share Evolution ( vs. 2024)
- 6.2.5 Company Market Share by Key Segment
- 6.2.6 Company Market Share by Customer Group
- 6.3 Operating Scale, Capacity & Infrastructure Analysis
- 6.3.1 Global Operating Scale & Supply Capacity
- 6.3.2 Resource Utilization & Operating Efficiency
- 6.3.3 Output, Service Delivery & Activity Metrics
- 6.3.4 Operating Footprint & Infrastructure Map
- 6.3.5 Planned Operational & Capacity Expansion
- 6.4 Mixing Wagon Competitive Benchmarking Matrix
- 6.4.1 Revenue, Growth, Profitability & Operating Metric Comparison
- 6.4.2 Channel Revenue Mix
- 6.4.3 Geographic Revenue Exposure
- 6.4.4 R&D Intensity
- 6.4.5 Sustainability Maturity
- 6.5 Strategic Developments in Mixing Wagon (Last 24 Months)
- 6.5.1 Mergers, Acquisitions & Divestments
- 6.5.2 New Products, Services & Solutions in Mixing Wagon
- 6.5.3 Operational & Infrastructure Expansions
- 6.5.4 Strategic Alliances, Joint Ventures & Partnerships
- 6.5.5 Distribution Expansion & Market Entry
- 6.5.6 Sustainability & ESG Initiatives
- 6.6 Competitive Strategy Mapping
- 6.6.1 Leader, Challenger, Follower & Niche Classification
- 6.6.2 Pricing Strategy Comparison
- 6.6.3 Channel Strategy Matrix
Note: Strategic developments are included based on their materiality and the availability of reliable information.
Chapter 7. Global Mixing Wagon Market – By Sales & Delivery Channel
- 7.1 Segment Overview
- 7.1.1 Volume & Revenue Split by Channel (2024 & 2032) (Volume Where Applicable)
- 7.1.2 Channel Mix Evolution (2024-2032)
Chapter 8. Regional Market Analysis – Global Overview
- 8.1 Global Regional Overview
- 8.1.1 Regional Volume Share (Volume Where Applicable)
- 8.1.2 Regional Revenue Share
- 8.1.3 Regional Volume by Region (Volume Where Applicable)
- 8.1.4 Regional Revenue by Region
- 8.1.5 Regional Forecast Through 2032
- 8.2 Cross-Regional Segment Analysis
- 8.2.1 By Sales & Delivery Channel
- 8.2.2 By Competitive Positioning & Price Tier
Chapter 9. North America Mixing Wagon Market
- 9.1 United States
- 9.2 Canada
- 9.3 Mexico
Chapter 10. Europe Mixing Wagon Market
- 10.1 Germany
- 10.2 France
- 10.3 Italy
- 10.4 United Kingdom
- 10.5 Spain
- 10.6 Poland
- 10.7 Russia
- 10.8 Netherlands
- 10.9 Belgium
- 10.10 Sweden
- 10.11 Denmark
- 10.12 Norway
- 10.13 Rest of Europe
Chapter 11. Asia Pacific Mixing Wagon Market
- 11.1 China
- 11.2 India
- 11.3 Japan
- 11.4 South Korea
- 11.5 Thailand
- 11.6 Indonesia
- 11.7 Vietnam
- 11.8 Malaysia
- 11.9 Australia
- 11.10 Rest of Asia Pacific
Chapter 12. Latin America Mixing Wagon Market
- 12.1 Brazil
- 12.2 Argentina
- 12.3 Colombia
- 12.4 Chile
- 12.5 Rest of Latin America
Chapter 13. Middle East Mixing Wagon Market
- 13.1 Saudi Arabia
- 13.2 United Arab Emirates
- 13.3 Turkey
- 13.4 Israel
- 13.5 Iran
- 13.6 Rest of the Middle East
Chapter 14. Africa Mixing Wagon Market
- 14.1 South Africa
- 14.2 Egypt
- 14.3 Nigeria
- 14.4 Morocco
- 14.5 Rest of Africa
Chapter 15. Mixing Wagon Company Profiles
- 15.1 [Company 01]
- 15.1.1 Company Overview
- 15.1.2 Key Management Personnel
- 15.1.3 Products & Services Portfolio
- 15.1.4 Financial Performance
- 15.1.5 Key Market Focus & Geographic Presence
- 15.1.6 Recent Developments & Strategic Initiatives
Note: The company profile list is preliminary and may change based on research findings, market developments, data availability, and client requirements.
Chapter 16. Appendices
- Appendix A – List of Abbreviations & Acronyms
- Appendix B – Industry Classification Code Reference – Full Series
- Appendix C – Supply, Output & Operating Capacity Data Tables
- Appendix D – End-Use & Demand Base Tables
- Appendix E – Demand, Adoption & Usage Assumptions
- Appendix F – Pricing & Revenue Metric Reference Tables
- Appendix G – Company Operations & Infrastructure Database
- Appendix H – Cross-Border Trade & Activity Data Tables (Where Applicable)
- Appendix I – Regulatory Summary Tables
- Appendix J – Primary Research Participant List (Anonymized)
- Appendix K – Primary Research Questionnaire Framework
- Appendix L – Data Sources & Bibliography
- Appendix M – Market Size Divergence & Source Comparison
Chapter 17. Research Methodology
- 17.1 Research Framework & Philosophy
- 17.2 Secondary Research – Sources, Hierarchy & Data Extraction
- 17.3 Data Modeling – Bottom-Up & Top-Down Market Sizing
- 17.4 Primary Research – Stakeholder Framework, LOI & Sample Sizes
- 17.5 Forecast Methodology – Regression, Scenario & Sensitivity Analysis
- 17.6 Quality Control – Four-Layer Validation Framework
- 17.7 Limitations & Standard Assumptions
- 17.8 Disclaimer
