
Market Overview
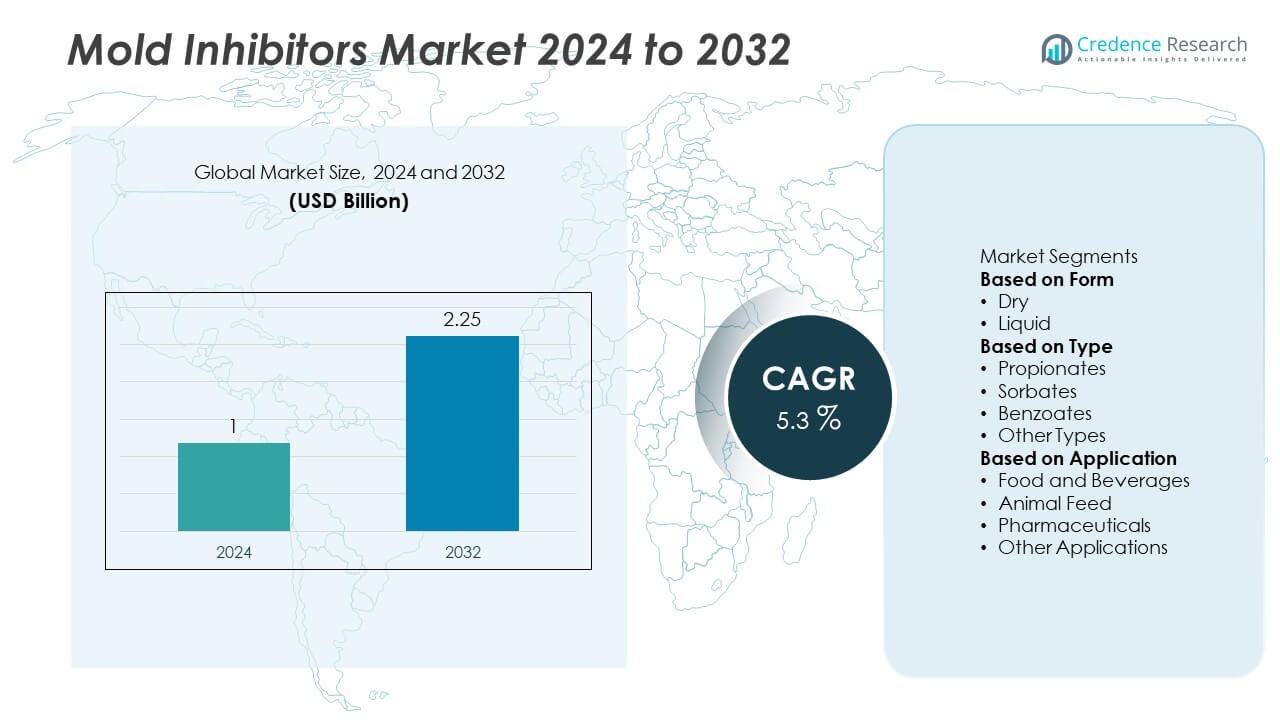
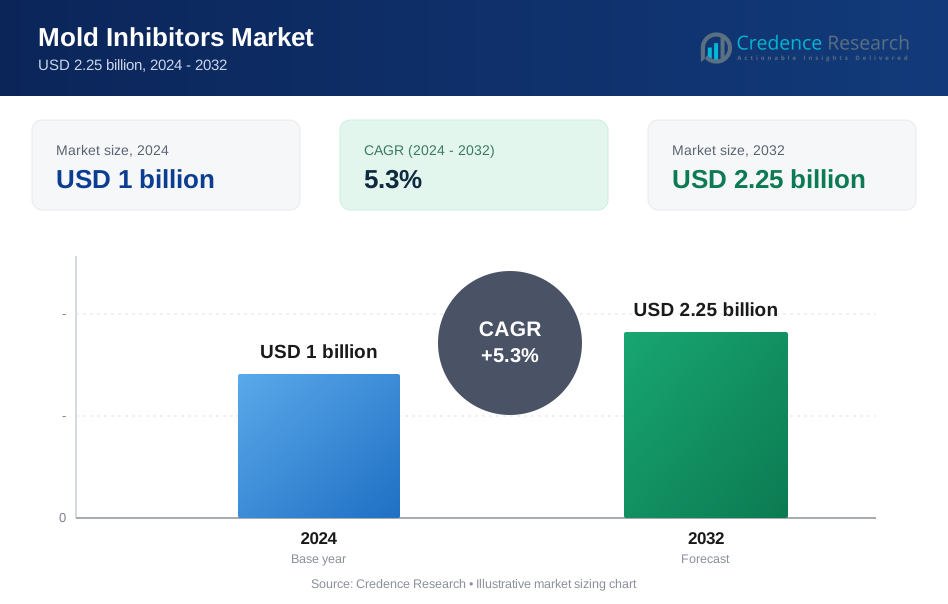
The mold inhibitors market was valued at USD 1 billion in 2024 and is projected to reach USD 2.25 billion by 2032, registering a CAGR of 5.3% during the forecast period.
| REPORT ATTRIBUTE | DETAILS |
|---|---|
| Historical Period | 2020-2023 |
| Base Year | 2024 |
| Forecast Period | 2025-2032 |
| Mold Inhibitors Market Size 2024 | USD 1 Billion |
| Mold Inhibitors Market, CAGR | 5.3% |
| Mold Inhibitors Market Size 2032 | USD 2.25 Billion |
The mold inhibitors market is led by key players such as Novozymes, BASF, Bayer, Huntsman Corporation, Monsanto, AkzoNobel, Wacker Chemie, FMC Corporation, Syngenta, and Kao Corporation. These companies focus on developing efficient propionates, sorbates, and natural solutions to meet rising demand from food, feed, and pharmaceutical sectors. Asia-Pacific leads the market with 30% share, driven by rapid urbanization, rising packaged food consumption, and expanding livestock production. North America holds 33% share, supported by strict food safety regulations and advanced processing facilities, while Europe accounts for 28% share with strong adoption of clean-label and eco-friendly mold inhibitors.
Market Insights
- The mold inhibitors market was valued at USD 1 billion in 2024 and is projected to reach USD 2.25 billion by 2032, growing at a CAGR of 5.3% during the forecast period.
- Rising demand for packaged food and animal feed drives growth, with food and beverages holding over 50% share as manufacturers focus on extending shelf life and reducing spoilage losses.
- Key trends include the shift toward natural and clean-label mold inhibitors, increased use of bio-based propionates, and investments in advanced formulations that meet global food safety standards.
- The market is competitive, with players such as Novozymes, BASF, Bayer, Huntsman Corporation, and FMC Corporation focusing on R&D, capacity expansion, and partnerships with food and feed producers to strengthen their presence.
- North America leads with 33% share, followed by Asia-Pacific with 30% and Europe with 28%, while Latin America and Middle East & Africa collectively contribute 9% share, driven by rising food processing activities.
Market Segmentation Analysis:
By Form
Dry mold inhibitors dominated the market in 2024, holding over 60% share, driven by their longer shelf life, easy storage, and cost-effectiveness. These are widely used in animal feed and packaged food products where moisture control is essential to prevent fungal growth. Dry forms provide uniform mixing and stable performance across diverse formulations, making them the preferred choice for bulk manufacturing and transport. Liquid mold inhibitors follow, finding applications in ready-to-drink beverages, sauces, and pharmaceutical solutions where rapid solubility and even distribution are critical.
- For instance, BASF produces a range of animal feed products, including organic acids like Luprosil® and buffered blends such as Luprosil® NC, that act as mold inhibitors. These products protect feed against deterioration caused by microorganisms, suppress mold reproduction, and improve the quality of stored ingredients like moist grains and silage.
By Type
Propionates led the mold inhibitors market with over 45% share in 2024, owing to their proven effectiveness against mold growth in bakery products, animal feed, and processed foods. Calcium and sodium propionate are extensively used due to their safety, low cost, and wide regulatory acceptance. Sorbates hold the next largest share, primarily used in dairy, beverages, and personal care formulations. Benzoates and other types are utilized for niche applications, including pharmaceuticals and coatings, where targeted mold prevention is required.
- For instance, BioVeritas's clean-label mold inhibitor, launched in July 2023, is produced using a proprietary fermentation process that creates a natural form of propionic acid. This type of technology is developed to preserve the flavor and texture of finished products while meeting consumer demand for clean labels. In general, potassium sorbate is a well-established preservative that is effective against yeasts and molds in acidic beverages, with effectiveness increasing at lower pH values.
By Application
Food and beverages accounted for over 50% share of the mold inhibitors market in 2024, driven by rising demand for packaged and convenience foods with extended shelf life. The growing bakery and confectionery sectors are major consumers of propionates and sorbates. The animal feed segment also holds a significant share, supported by the need to preserve nutritional quality and prevent spoilage in stored feed. Pharmaceuticals and other applications, including paints, coatings, and personal care products, contribute steadily, benefiting from increasing focus on product stability and compliance with safety standards.
Key Growth Drivers
Rising Demand for Packaged and Processed Foods
Growing consumption of packaged and convenience foods is a key driver, contributing to over 50% of mold inhibitor demand in 2024. Consumers seek products with extended shelf life and consistent quality, pushing manufacturers to adopt effective mold prevention solutions. Propionates and sorbates are widely used in bakery, dairy, and ready-to-eat products to prevent spoilage and maintain freshness. Rising urbanization, busy lifestyles, and expansion of global food supply chains continue to fuel demand for safe, cost-efficient mold inhibitors that support longer storage and reduce food waste.
- For instance, BASF has an annual propionic acid production capacity of 220,000 metric tons between its various production sites, including Ludwigshafen and an expanded facility in Nanjing.
Growth in Animal Feed Industry
The animal feed sector holds a significant share, driving over 30% of mold inhibitor consumption in 2024. Mold inhibitors are essential to prevent mycotoxin contamination, which can impact livestock health and reduce feed efficiency. The rising global demand for meat, poultry, and dairy products supports higher feed production, creating consistent demand for mold prevention additives. Producers are increasingly adopting dry mold inhibitors for their easy mixing and long-term stability, ensuring feed quality is maintained during storage and transport across diverse climatic conditions.
- For instance, Novonesis (formerly Novozymes before a 2024 merger with Chr. Hansen) developed the enzyme Balancius™ for use in poultry feed, which improves nutrient absorption and has been shown in trials to consistently improve feed conversion ratios by up to 3%.
Increasing Focus on Product Safety and Quality Compliance
Stringent food safety regulations and quality standards are boosting the adoption of mold inhibitors across industries. Regulatory bodies such as the FDA and EFSA encourage the use of approved preservatives to reduce microbial risks. This compliance trend drives steady growth in pharmaceutical and personal care applications, where product stability and consumer safety are critical. Manufacturers are investing in research to develop inhibitors with cleaner labels and reduced chemical residues to meet consumer preference for safe, transparent, and eco-friendly ingredients, supporting market expansion.
Key Trends & Opportunities
Shift Toward Natural and Clean-Label Mold Inhibitors
A major trend is the growing adoption of natural mold inhibitors derived from plant extracts and fermentation processes. Consumers prefer clean-label food products with minimal synthetic additives, encouraging manufacturers to explore bio-based solutions. This trend opens opportunities for innovation in naturally sourced propionates and sorbates, allowing producers to differentiate products while meeting regulatory and consumer expectations for safer, healthier ingredients.
- For instance, Corbion launched Verdad® Essence WH100 in April 2025, a natural bakery mold inhibitor based on fermentation-derived acids from cultured wheat, designed to extend shelf life in bread products. The company also updated its predictive modeling tool, the Natural Mold Inhibition Model (CNMIM), to help bakers achieve their shelf-life targets.
Expansion in Emerging Markets and Industrial Applications
Emerging markets in Asia-Pacific and Latin America present strong opportunities for mold inhibitor adoption due to rising packaged food consumption and growing feed industries. Additionally, industrial applications such as paints, coatings, and personal care products are expanding as demand for mold-free surfaces and longer product life increases. Manufacturers focusing on cost-effective, multi-application inhibitors are well-positioned to capture these growth segments and expand their global footprint.
- For instance, the Asia-Pacific clean label mold inhibitor market generated a revenue of $147.8 million in 2024. The market is driven by increasing bakery and dairy product manufacturing in China and India, along with rising consumer demand for natural ingredients.
Key Challenges
Stringent Regulatory Approval Processes
Regulatory compliance for mold inhibitors can be complex, with varying approval standards across regions. New product formulations often require extensive testing to meet safety and efficacy requirements, delaying market entry. This increases R&D costs and slows innovation cycles for manufacturers. Companies must maintain continuous monitoring to ensure compliance with evolving food safety and environmental regulations, adding to operational complexity.
Volatility in Raw Material Prices
Fluctuations in raw material prices used in producing mold inhibitors, such as propionic acid and sorbic acid, impact manufacturing costs and profit margins. Supply chain disruptions and rising energy costs further add to pricing pressure. These challenges can limit affordability for smaller food producers and feed manufacturers, especially in developing markets, potentially slowing adoption and overall market growth.
Regional Analysis
North America
North America held 33% share in 2024, driven by strong demand from the packaged food and animal feed industries. The United States leads the region with high adoption of propionates and sorbates in bakery, dairy, and ready-to-eat products. Stringent food safety regulations from the FDA encourage manufacturers to use effective mold prevention solutions. The feed industry also contributes significantly as producers seek to minimize mycotoxin risks and maintain livestock health. Innovation in clean-label and natural mold inhibitors is gaining traction, aligning with consumer preferences for transparency and safer food ingredients.
Europe
Europe accounted for 28% share in 2024, supported by robust regulatory frameworks and a mature food processing sector. Countries like Germany, France, and the U.K. lead adoption of mold inhibitors in bakery, confectionery, and beverage applications. The region is witnessing increased demand for natural and clean-label preservatives as consumers prioritize healthier, chemical-free products. The animal feed industry also plays a crucial role, with EU regulations emphasizing mycotoxin control and quality assurance. Investments in R&D to develop eco-friendly formulations are strengthening Europe’s position as a key market for advanced mold inhibitors.
Asia-Pacific
Asia-Pacific led the global market with 30% share in 2024, making it the fastest-growing region. Rising population, rapid urbanization, and expanding middle-class income levels are driving demand for packaged food, beverages, and animal feed. China and India dominate consumption, with growing focus on improving food safety and reducing post-harvest losses. The region is seeing a rise in local production of propionates and sorbates to meet increasing demand at competitive prices. Expansion of livestock farming and government initiatives promoting feed quality standards further contribute to sustained growth in this region.
Latin America
Latin America captured 5% share in 2024, with demand concentrated in Brazil, Mexico, and Argentina. The region benefits from a growing food and beverage industry and rising investments in animal feed production. Mold inhibitors are increasingly adopted to maintain product quality in humid climates, where fungal growth is a persistent challenge. Adoption is supported by efforts to reduce food waste and improve storage stability. However, economic fluctuations and limited consumer awareness can restrain faster market penetration, creating opportunities for affordable, easy-to-apply solutions targeting small and mid-scale producers.
Middle East & Africa
The Middle East & Africa region held 4% share in 2024, with growth driven by demand from bakery, dairy, and processed food sectors. GCC nations invest in food safety and storage solutions to reduce dependence on imports and extend shelf life. Africa is witnessing steady adoption in the feed sector as livestock production expands to meet protein demand. Challenges include limited access to advanced preservatives and higher product costs, but increasing urbanization and retail expansion are creating opportunities for suppliers to introduce cost-effective and durable mold inhibitor solutions.
Market Segmentations:
By Form
- Dry
- Liquid
By Type
- Propionates
- Sorbates
- Benzoates
- Other Types
By Application
- Food and Beverages
- Animal Feed
- Pharmaceuticals
- Other Applications
By Geography
- North America
- Europe
- Asia Pacific
- Latin America
- Middle East
- Africa
Competitive Landscape
The competitive landscape of the mold inhibitors market includes leading players such as Novozymes, BASF, Bayer, Huntsman Corporation, Monsanto, AkzoNobel, Wacker Chemie, FMC Corporation, Syngenta, and Kao Corporation. These companies focus on developing advanced propionates, sorbates, and bio-based solutions to meet growing demand for safe and sustainable mold prevention. Strategies include investing in R&D for natural and clean-label formulations, expanding production capacity, and forming partnerships with food and feed manufacturers to enhance market reach. Players are also targeting emerging markets in Asia-Pacific and Latin America, where rising food processing activities drive demand. Efforts are being made to improve formulation efficiency, extend shelf life, and comply with evolving global food safety regulations. Competitive differentiation is achieved through innovation, regulatory expertise, and technical support services, positioning these companies to capture market share while supporting manufacturers in maintaining product quality and reducing spoilage losses.
Key Player Analysis
- Novozymes
- BASF
- Bayer
- Huntsman Corporation
- Monsanto
- AkzoNobel
- Wacker Chemie
- FMC Corporation
- Syngenta
- Kao Corporation
Recent Developments
- In August 2025, Kao Corporation opened a new tertiary amine production plant in the U.S. with capacity of 20,000 tons annually. This helps stable supply of certain chemical intermediates (which may be used in preservatives, mold inhibitors, or related fields)
- In June 2025, Novozymes completed a share buyback program worth up to EUR 100 million (DKK 746 million) as part of its strategic investments to fuel innovation in biotechnology, including enzyme-based mold inhibition solutions focusing on improving food preservation efficiency.
- In April 2024, Kao Corporation will launch LUNAFLOW RA, a solvent- and fluorine-free, water-based mold release agent (using cellulose nanofibers) for easier removal of rubber or resin products from molds.
- In March 2024, BASF, actively investing in clean label mold inhibitors, has developed starch-based mold inhibitors targeting improved shelf life in baked goods and dairy, with pilot production capacity of 2,000 tons per month and validated efficacy in reducing mold growth onset by 6 days in food trials.
Report Coverage
The research report offers an in-depth analysis based on Form, Type, Application and Geography. It details leading market players, providing an overview of their business, product offerings, investments, revenue streams, and key applications. Additionally, the report includes insights into the competitive environment, SWOT analysis, current market trends, as well as the primary drivers and constraints. Furthermore, it discusses various factors that have driven market expansion in recent years. The report also explores market dynamics, regulatory scenarios, and technological advancements that are shaping the industry. It assesses the impact of external factors and global economic changes on market growth. Lastly, it provides strategic recommendations for new entrants and established companies to navigate the complexities of the market.
Future Outlook
- Demand for mold inhibitors will grow as packaged and processed food consumption continues to rise.
- Propionates will remain the leading type due to their cost-effectiveness and regulatory approval.
- Natural and clean-label mold inhibitors will gain traction to meet consumer preference for safe ingredients.
- Asia-Pacific will see strong growth driven by food production expansion and livestock farming.
- Technological advancements will improve formulation efficiency and extend product shelf life.
- Adoption in pharmaceuticals and personal care products will expand as stability requirements increase.
- Manufacturers will invest in R&D to create eco-friendly and bio-based solutions.
- Strategic partnerships between suppliers and food producers will strengthen supply chain resilience.
- Regulatory compliance will drive innovation toward safer and residue-free preservatives.
- Growth opportunities will emerge in emerging markets with rising focus on food safety and quality.
Request a Free Sample
Fill in your details and we'll send you a free sample report.
- Sample data tables & charts
- Research methodology
Need a Custom Version of This Report?
Tailor the scope, geography, or segments to your exact requirements.
- Custom geography or segment scope
- Direct access to our analyst team
Frequently Asked Questions
What is the current market size for Mold Inhibitors market, and what is its projected size in 2032?
At what Compound Annual Growth Rate is the Mold Inhibitors market projected to grow between 2025 and 2032?
Which Mold Inhibitors market segment held the largest share in 2024?
What are the primary factors fueling the growth of the Mold Inhibitors market?
Who are the leading companies in the Mold Inhibitors market?
Which region commanded the largest share of the Mold Inhibitors market in 2024?
Table of Content
Chapter 1. Report Introduction
- 1.1 Report Description & Purpose
- 1.1.1 Report Title & Market Definition
- 1.1.2 Unique Selling Propositions (USP) & Key Differentiators
- 1.1.3 Value Proposition for Stakeholders
- 1.2 Research Objectives
- 1.2.1 Market Sizing Objectives (Volume & Revenue)
- 1.2.2 Segmentation Objectives
- 1.2.3 Competitive Intelligence Objectives
- 1.2.4 Forecast & Scenario Objectives
- 1.3 Report Scope
- 1.3.1 Mold Inhibitors Scope – Types & Subtypes Covered
- 1.3.2 Geographic Scope – Regions & Countries Covered
- 1.3.3 Historical Period, Base Year & Forecast Period (2024; forecast to 2032)
- 1.3.4 Inclusions & Exclusions
- 1.4 HS Code & Classification Framework
- 1.5 Currency, Units & Pricing Basis
- 1.6 Target Stakeholders
- 1.7 Limitations & Assumptions
Chapter 2. Executive Summary
- 2.1 Global Mold Inhibitors Market Snapshot
- 2.1.1 Market Size – Historical (2024) & Forecast (2024-2032) (2024: USD 1 billion → 2032: USD 2.25 billion)
- 2.1.2 Volume & Revenue – Global Totals
- 2.1.3 Key Market Highlights – Top Five Facts
- 2.2 Mold Inhibitors Market Segmentation Snapshot
- 2.2.1 Market Split by Region – 2024 vs. 2032
- 2.3 Competitive Snapshot
- 2.3.1 Top 10 Players by Revenue Share – 2024
- 2.3.2 Top 10 Players by Volume Share – 2024
- 2.3.3 Recent Strategic Developments (18-Month Summary)
- 2.4 Key Investment Highlights & Strategic Conclusions
Chapter 3. Mold Inhibitors Market Dynamics & Industry Analysis
- 3.1 Market Overview & Context
- 3.1.1 Mold Inhibitors Market Position in the Broader Automotive Value Chain
- 3.1.2 OEM vs. Replacement Market Dynamics
- 3.1.3 Market Maturity & Development Stage by Region
- 3.2 Mold Inhibitors Market Drivers
- 3.3 Mold Inhibitors Market Restraints & Challenges
- 3.4 Mold Inhibitors Market Opportunities
- 3.5 Porter's Five Forces Analysis
- 3.5.1 Threat of New Entrants
- 3.5.2 Bargaining Power of Suppliers
- 3.5.3 Bargaining Power of Buyers
- 3.5.4 Threat of Substitutes
- 3.5.5 Competitive Rivalry – Intensity Assessment
- 3.6 Mold Inhibitors Value Chain Analysis
- 3.6.1 Upstream – Raw Material/Input Suppliers
- 3.6.1.1 Raw Material/Input 1
- 3.6.1.2 Raw Material/Input 2
- 3.6.1.3 Raw Material/Input 3
- 3.6.2 Midstream – Production/Manufacturing/Service Delivery
- 3.6.2.1 Production/Process Overview
- 3.6.2.2 Key Facility Locations & Capacity by Manufacturer
- 3.6.3 Downstream – Distribution & End Consumer
- 3.6.3.1 Primary Channel – B2B/OEM
- 3.6.3.2 Secondary Channels – Dealer, Retail, Online, Direct
- 3.6.4 Value Chain Profitability Analysis
- 3.6.1 Upstream – Raw Material/Input Suppliers
- 3.7 PESTEL Analysis
- 3.7.1 Political Factors
- 3.7.2 Economic Factors
- 3.7.3 Social Factors
- 3.7.4 Technological Factors
- 3.7.5 Environmental Factors
- 3.7.6 Legal Factors
- 3.8 Mold Inhibitors Supply Chain Analysis
- 3.8.1 Raw Material/Input Supply Risk Assessment
- 3.8.2 Manufacturing Concentration Risk (Geographic Exposure)
- 3.8.3 Trade Disruption Impact Analysis
- 3.9 Regulatory & Policy Landscape
Note: The regulatory and policy landscape section covers regulations based on their applicability to the market, Mold Inhibitors category, geography, and scope of the study. Only regulatory frameworks with a material impact on operations, compliance, trade, sustainability, or market access are analyzed in detail.
Chapter 4. Key Investment Pockets & Opportunity Analysis
- 4.1 Mold Inhibitors Market Attractiveness Analysis
- 4.1.1 By Region – Investment Attractiveness Matrix (Volume × CAGR)
- 4.2 Absolute Revenue Growth Opportunity
- 4.2.1 By Region – Absolute USD Growth Through 2032
- 4.3 Incremental Volume Opportunity
- 4.3.1 By Region – Incremental Volume Through 2032
- 4.3.2 Segment – Incremental Volume
- 4.4 Emerging Submarket Opportunity Deep Dive (Subject to Applicability)
- 4.5 Emerging Market Opportunity Scorecards
- 4.5.1 United States
- 4.5.2 Europe
- 4.5.3 Asia
- 4.5.4 Middle East & Africa
Note: Emerging Market Opportunity Scorecards will be included based on relevance and strategic importance. Regions listed are indicative and may vary depending on data availability and market dynamics.
Chapter 5. Mold Inhibitors Import-Export Analysis & Trade Flows
- 5.1 Global Trade Overview
- 5.1.1 Global Export Value by Country (2024)
- 5.1.2 Global Export Volume by Country (2024)
- 5.1.3 Global Import Value by Country (2024)
- 5.1.4 Global Import Volume by Country (2024)
- 5.1.5 Net Trade Balance by Country (2024)
- 5.2 Export Analysis – Segment
- 5.2.1 Type 1 (HS Code)
- 5.2.2 Type 2 (HS Code)
- 5.2.3 Type 3 (HS Code)
- 5.2.4 Type 4 (HS Code)
- 5.2.5 Type 5 (HS Code)
- 5.3 Import Analysis – Segment
- 5.3.1 Type 1 (HS Code)
- 5.3.2 Type 2 (HS Code)
- 5.3.3 Type 3 (HS Code)
- 5.3.4 Type 4 (HS Code)
- 5.3.5 Type 5 (HS Code)
- 5.4 Average Unit Trade Prices
- 5.4.1 Average Export Price – Segment & Country
- 5.4.2 Average Import Price – Segment & Source Country
- 5.4.3 Price Trends (2024)
- 5.5 Key Trade Route Analysis
- 5.5.1 Trade Route 1
- 5.5.2 Trade Route 2
- 5.5.3 Trade Route 3
- 5.5.4 Trade Route 4
- 5.5.5 Trade Route 5
- 5.6 Trade Policy Impact Assessment
- 5.6.1 US Anti-Dumping & Section 301 Tariffs
- 5.6.2 EU Customs Union Impact
- 5.6.3 Major Free Trade Agreements
- 5.6.4 USMCA Rules of Origin
Note: Trade policy analysis will be included only where relevant to the Mold Inhibitors market.
Chapter 6. Competitive Landscape & Company Benchmarking
- 6.1 Mold Inhibitors Market Concentration & Structure
- 6.1.1 Herfindahl-Hirschman Index (HHI) – vs. 2024
- 6.1.2 Tier 1, Tier 2 & Tier 3 Market Structure
- 6.1.3 Global, Regional & Local Player Dynamics
- 6.2 Mold Inhibitors Market Share Analysis – 2024
- 6.2.1 Global Revenue Share by Company
- 6.2.2 Global Volume Share by Company
- 6.2.3 Regional Revenue Share
- 6.2.4 Market Share Evolution ( vs. 2024)
- 6.2.5 OEM Segment Share by Company
- 6.2.6 Replacement Segment Share by Company
- 6.3 Production/Delivery Capacity & Facility Analysis
- 6.3.1 Global Installed Capacity
- 6.3.2 Capacity Utilization Rates
- 6.3.3 Production/Output Volume
- 6.3.4 Facility Locations & Capacity Map
- 6.3.5 Planned Capacity Additions
- 6.4 Mold Inhibitors Competitive Benchmarking Matrix
- 6.4.1 Revenue, Volume, CAGR & Profitability Comparison
- 6.4.2 Channel Revenue Mix
- 6.4.3 Geographic Revenue Exposure
- 6.4.4 R&D Intensity
- 6.4.5 Sustainability Maturity
- 6.5 Strategic Developments in Mold Inhibitors (Last 24 Months)
- 6.5.1 Mergers, Acquisitions & Divestments
- 6.5.2 New Mold Inhibitors Launches
- 6.5.3 Facility Expansions
- 6.5.4 Strategic Alliances, Joint Ventures & Partnerships
- 6.5.5 Distribution Expansion & Market Entry
- 6.5.6 Sustainability & ESG Initiatives
- 6.6 Competitive Strategy Mapping
- 6.6.1 Leader, Challenger, Follower & Niche Classification
- 6.6.2 Pricing Strategy Comparison
- 6.6.3 Channel Strategy Matrix
Note: Strategic developments are included based on their materiality and the availability of reliable information.
Chapter 7. Global Mold Inhibitors Market – By Distribution Channel
- 7.1 Segment Overview
- 7.1.1 Volume & Revenue Split by Channel (2024 & 2032)
- 7.1.2 Channel Mix Evolution (2024-2032)
Chapter 8. Regional Market Analysis – Global Overview
- 8.1 Global Regional Overview
- 8.1.1 Regional Volume Share
- 8.1.2 Regional Revenue Share
- 8.1.3 Regional Volume by Region
- 8.1.4 Regional Revenue by Region
- 8.1.5 Regional Forecast Through 2032
- 8.2 Cross-Regional Segment Analysis
- 8.2.1 By Distribution Channel
- 8.2.2 By Brand/Price Tier
Chapter 9. North America Mold Inhibitors Market
- 9.1 United States
- 9.2 Canada
- 9.3 Mexico
Chapter 10. Europe Mold Inhibitors Market
- 10.1 Germany
- 10.2 France
- 10.3 Italy
- 10.4 United Kingdom
- 10.5 Spain
- 10.6 Poland
- 10.7 Russia
- 10.8 Netherlands
- 10.9 Belgium
- 10.10 Sweden
- 10.11 Denmark
- 10.12 Norway
- 10.13 Rest of Europe
Chapter 11. Asia Pacific Mold Inhibitors Market
- 11.1 China
- 11.2 India
- 11.3 Japan
- 11.4 South Korea
- 11.5 Thailand
- 11.6 Indonesia
- 11.7 Vietnam
- 11.8 Malaysia
- 11.9 Australia
- 11.10 Rest of Asia Pacific
Chapter 12. Latin America Mold Inhibitors Market
- 12.1 Brazil
- 12.2 Argentina
- 12.3 Colombia
- 12.4 Chile
- 12.5 Rest of Latin America
Chapter 13. Middle East Mold Inhibitors Market
- 13.1 Saudi Arabia
- 13.2 United Arab Emirates
- 13.3 Turkey
- 13.4 Israel
- 13.5 Iran
- 13.6 Rest of the Middle East
Chapter 14. Africa Mold Inhibitors Market
- 14.1 South Africa
- 14.2 Egypt
- 14.3 Nigeria
- 14.4 Morocco
- 14.5 Rest of Africa
Chapter 15. Mold Inhibitors Company Profiles
- 15.1 [Company 01]
- 15.1.1 Company Overview
- 15.1.2 Key Management Personnel
- 15.1.3 Products & Services Portfolio
- 15.1.4 Financial Performance
- 15.1.5 Key Market Focus & Geographic Presence
- 15.1.6 Recent Developments & Strategic Initiatives
Note: The company profile list is preliminary and may change based on research findings, market developments, data availability, and client requirements.
Chapter 16. Appendices
- Appendix A – List of Abbreviations & Acronyms
- Appendix B – Industry Classification Code Reference – Full Series
- Appendix C – Production & Capacity Data Tables
- Appendix D – End-Use & Demand Base Tables
- Appendix E – Consumption & Replacement Rate Assumptions
- Appendix F – ASP Reference Tables
- Appendix G – Manufacturing & Facility Database
- Appendix H – Import-Export Data Tables
- Appendix I – Regulatory Summary Tables
- Appendix J – Primary Research Participant List (Anonymized)
- Appendix K – Primary Research Questionnaire Framework
- Appendix L – Data Sources & Bibliography
- Appendix M – Market Size Divergence & Source Comparison
Chapter 17. Research Methodology
- 17.1 Research Framework & Philosophy
- 17.2 Secondary Research – Sources, Hierarchy & Data Extraction
- 17.3 Data Modeling – Bottom-Up & Top-Down Market Sizing
- 17.4 Primary Research – Stakeholder Framework, LOI & Sample Sizes
- 17.5 Forecast Methodology – Regression, Scenario & Sensitivity Analysis
- 17.6 Quality Control – Four-Layer Validation Framework
- 17.7 Limitations & Standard Assumptions
- 17.8 Disclaimer
