| REPORT ATTRIBUTE |
DETAILS |
| Historical Period |
2020-2023 |
| Base Year |
2024 |
| Forecast Period |
2025-2032 |
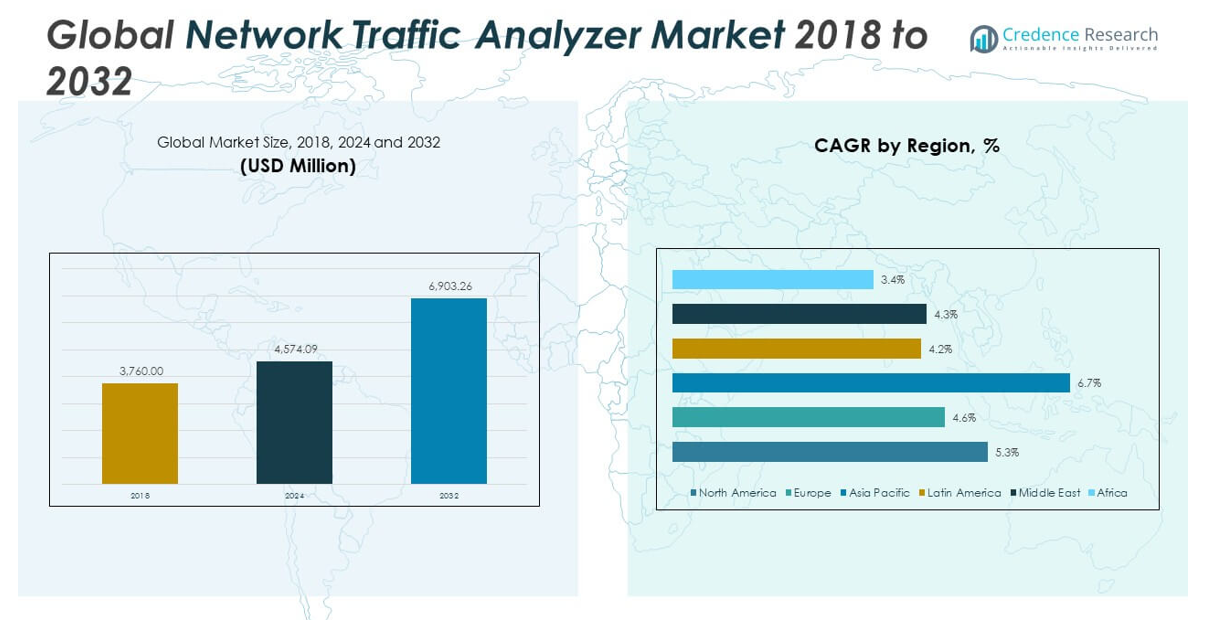
| Network Traffic Analyzer Market Size 2024 |
USD 4,574.09 million |
| Network Traffic Analyzer Market, CAGR |
5.31% |
| Network Traffic Analyzer Market Size 2032 |
USD 6,903.26 million |
Market Overview:
The Global Network Traffic Analyzer Market size was valued at USD 3,760.00 million in 2018 to USD 4,574.09 million in 2024 and is anticipated to reach USD 6,903.26 million by 2032, at a CAGR of 5.31% during the forecast period.
Several core factors are driving the growth of the network traffic analyzer market. One of the primary drivers is the escalating number of cyber threats and data breaches, which compel businesses to invest in tools that offer real-time visibility into their network traffic. Enterprises require solutions that can detect anomalies, prevent breaches, and ensure operational continuity. As networks grow more complex—driven by the proliferation of IoT devices, remote work environments, and multi-cloud deployments—the demand for sophisticated traffic analysis tools intensifies. Cloud-based infrastructure and remote working models have introduced new vulnerabilities and management challenges, increasing the need for agile, centralized monitoring solutions. In addition, the rise of 5G networks and edge computing has added layers of complexity to data flow, making high-performance analysis solutions critical for ensuring network stability. The integration of artificial intelligence and machine learning is further enhancing the capabilities of network traffic analyzers by enabling predictive insights, automated response mechanisms, and smarter data management.
Regionally, North America is the leading market for network traffic analyzers, with strong demand originating from the United States and Canada. This dominance is supported by mature IT ecosystems, high cybersecurity awareness, and strong enterprise investments in digital infrastructure. Companies in the region are early adopters of emerging technologies, including AI-driven analytics, making North America a consistent revenue generator for vendors. Europe holds the second-largest share of the global market, with consistent demand fueled by regulatory mandates, such as the General Data Protection Regulation (GDPR), and widespread initiatives to modernize IT and telecom networks. Countries like Germany, France, and the UK continue to invest heavily in security and digital performance management tools. In contrast, the Asia-Pacific region is emerging as the fastest-growing market. Countries such as China, India, Japan, and South Korea are undergoing rapid digital transformation, expanding internet penetration, and large-scale implementation of smart infrastructure. This is accelerating the adoption of network traffic monitoring tools across telecom, government, and enterprise sectors. Latin America, the Middle East, and Africa are gradually gaining traction in the market as digital adoption deepens and organizations begin to invest more actively in IT security and performance solutions.
Market Insights:
- The Global Network Traffic Analyzer Market size grew from USD 3,760 million in 2018 to USD 4,574.09 million in 2024 and is projected to reach USD 6,903.26 million by 2032, expanding steadily with a CAGR of 5.31% during the forecast period.
- Cybersecurity threats remain a central growth catalyst, with rising data breaches and sophisticated attacks prompting enterprises to invest in real-time network visibility and advanced threat detection tools.
- Cloud-first strategies and hybrid infrastructure adoption are driving demand for centralized network analysis platforms that ensure visibility, control, and secure data flows across distributed IT environments.
- IoT expansion and device proliferation across industries such as manufacturing, healthcare, and smart cities are increasing the need for scalable traffic analysis solutions that can handle high data volumes and diverse protocols.
- Performance optimization is a top enterprise priority, and organizations rely on traffic analyzers to reduce latency, prevent downtime, and streamline bandwidth usage to support real-time applications and digital operations.
- High implementation costs and limited budgets continue to challenge small and mid-sized enterprises, making affordability and modular solutions essential for broader market adoption.
- North America leads the market in revenue, supported by strong enterprise IT spending and early tech adoption, while the Asia-Pacific region emerges as the fastest-growing, driven by digital infrastructure investments in China, India, and Southeast Asia.
Access crucial information at unmatched prices!
Request your sample report today & start making informed decisions powered by Credence Research Inc.!
Download Sample
Market Drivers:
Rising Cybersecurity Threats and the Demand for Proactive Network Visibility:
The increasing volume and sophistication of cyberattacks are prompting organizations to prioritize proactive network security. Enterprises seek solutions that offer continuous visibility into network behavior to detect anomalies, prevent breaches, and respond in real time. Traditional firewalls and antivirus tools are no longer sufficient to counteract evolving threats. The Global Network Traffic Analyzer Market is gaining traction due to its ability to identify malicious activity at both the application and network levels. Organizations across sectors, including finance, healthcare, and government, are deploying traffic analyzers to strengthen their cybersecurity posture. It plays a critical role in minimizing vulnerabilities and maintaining regulatory compliance across digital operations.
- For instance, Cisco Secure Network Analytics (formerly Stealthwatch) provides enterprise-wide network visibility and advanced security analytics, using behavioral modeling and machine learning to detect threats such as command-and-control attacks, ransomware, and insider threats.
Expanding Cloud Adoption and Complexity of Hybrid Infrastructures:
Enterprises are shifting toward cloud-first strategies, leading to a rise in hybrid and multi-cloud environments. These architectures increase the complexity of network traffic, making it harder to manage data flows and ensure service continuity. The Global Network Traffic Analyzer Market benefits from this transition by providing centralized tools that monitor dispersed networks in real time. It enables organizations to analyze traffic across on-premises, cloud, and edge environments with precision. This visibility is essential for maintaining performance and ensuring secure data transmission. As digital transformation accelerates, network traffic analyzers become indispensable for modern IT operations.
- For instance, VMware NSX and its associated vRealize Network Insight collect and centralize detailed network performance metrics from NSX Edge nodes and ESXi hosts.
Growth in Connected Devices and Internet of Things (IoT) Ecosystems:
The rapid proliferation of connected devices is driving exponential growth in network traffic across industries. From smart factories to healthcare systems, IoT deployments demand robust network monitoring to manage congestion and secure communication channels. The Global Network Traffic Analyzer Market addresses this demand by offering solutions that support high device density and diverse protocols. It helps network teams ensure efficient data flow and detect unauthorized or malfunctioning devices. Enterprises require this intelligence to scale operations without compromising stability or security. Traffic analyzers are critical for ensuring the integrity of distributed and sensor-rich infrastructures.
Demand for Performance Optimization and Operational Efficiency:
Increased reliance on real-time applications such as video conferencing, cloud-based collaboration tools, and online services underscores the need for network performance optimization. Downtime or latency can lead to financial losses and damage user experience. The Global Network Traffic Analyzer Market supports organizations by identifying bandwidth bottlenecks, latency sources, and misconfigured assets. It empowers IT teams to act quickly and optimize resource allocation. Performance insights also contribute to long-term capacity planning and infrastructure investment decisions. By improving operational efficiency, traffic analyzers become vital to maintaining business continuity in a digital-first environment.
Market Trends:
Integration of Artificial Intelligence and Machine Learning for Predictive Analytics:
Vendors are increasingly embedding artificial intelligence (AI) and machine learning (ML) algorithms into network traffic analyzers to move from reactive to predictive analytics. These technologies enable systems to learn from historical traffic patterns and automatically flag anomalies before they impact operations. Predictive capabilities reduce manual intervention and accelerate incident response. The Global Network Traffic Analyzer Market is evolving to offer intelligent automation that improves threat detection and streamlines troubleshooting. It allows enterprises to identify patterns, detect hidden issues, and anticipate capacity constraints. AI-driven analyzers enhance decision-making by offering actionable insights in real time.
- For instance, Darktrace’s Enterprise Immune System leverages AI and ML to analyze network traffic patterns, processing over 100 terabytes of data daily and detecting anomalies with a false positive rate below 2%, enabling predictive threat detection and reducing manual security interventions by 40%.
Shift Toward Cloud-Native and SaaS-Based Traffic Analysis Platforms:
Organizations are replacing legacy, hardware-bound systems with scalable, cloud-native network monitoring solutions. This shift aligns with broader enterprise migration to cloud-based services and decentralized architectures. Software-as-a-Service (SaaS) traffic analyzers offer flexibility, lower upfront costs, and ease of deployment across multiple sites. The Global Network Traffic Analyzer Market is embracing this transition, with vendors developing subscription-based platforms that support multi-cloud visibility and remote administration. It helps IT teams monitor hybrid infrastructures without physical constraints. Cloud-native tools also simplify integration with other digital services and analytics frameworks.
- For instance, Netscout’s SaaS-based nGeniusONE platform offers multi-cloud traffic analysis with support for over 500,000 endpoints, delivering real-time insights with sub-second latency and enabling IT teams to manage hybrid infrastructures efficiently without physical hardware constraints.
Growing Adoption of Encrypted Traffic Analysis Capabilities:
With increasing adoption of HTTPS, VPNs, and other encryption protocols, a large portion of network traffic is now encrypted. This poses a challenge to traditional traffic analyzers that rely on clear-text inspection. The Global Network Traffic Analyzer Market is responding by incorporating encrypted traffic analysis (ETA) features that inspect metadata, behavioral patterns, and packet headers without decryption. It enables enterprises to maintain visibility without compromising user privacy or violating data protection laws. ETA tools enhance anomaly detection and support compliance monitoring in regulated industries. These capabilities are becoming essential for monitoring modern, secure communications.
Convergence of Network Performance Monitoring and Security Analytics:
Enterprises are seeking unified platforms that merge performance monitoring with security analytics to reduce operational silos. This convergence supports faster incident detection, better root-cause analysis, and streamlined network operations. The Global Network Traffic Analyzer Market is aligning with this trend by offering integrated solutions that provide a holistic view of both performance and threat landscapes. It empowers IT and security teams to collaborate more effectively and make informed decisions using a single source of truth. Unified analytics platforms improve visibility and reduce tool sprawl in complex network environments. This integration is becoming a standard feature across advanced traffic analysis solutions.
Market Challenges Analysis:
High Implementation Costs and Limited Budget Flexibility for Small Enterprises:
One of the major challenges facing the Global Network Traffic Analyzer Market is the high cost associated with acquiring, deploying, and maintaining advanced traffic analysis solutions. Many enterprises require specialized hardware, skilled personnel, and continuous software updates to ensure optimal functionality. While large organizations can absorb these expenses, small and medium-sized businesses often lack the financial resources or technical infrastructure to adopt comprehensive network monitoring systems. This disparity limits market penetration across cost-sensitive sectors. It also creates a gap in security and visibility between large enterprises and smaller firms. Vendors must address this challenge by offering scalable, cost-effective solutions tailored to varied organizational sizes.
Complexity of Managing Encrypted and Distributed Network Environments:
The growing use of encryption and distributed networks creates technical challenges for traffic analysis tools. Encrypted data flows limit the visibility of traditional analyzers, which rely on deep packet inspection to detect anomalies and threats. In multi-cloud or hybrid environments, traffic originates from numerous sources, making it difficult to establish a unified monitoring strategy. The Global Network Traffic Analyzer Market must adapt to these complexities by developing tools capable of analyzing encrypted traffic metadata and correlating events across diverse platforms. It requires advanced analytics, seamless integration, and high levels of automation to maintain performance and security standards. Without such capabilities, IT teams struggle to ensure consistent oversight in dynamic environments.
Market Opportunities:
Rising Demand for Scalable Solutions in Emerging Markets:
Emerging economies are witnessing rapid digital transformation across sectors such as government, education, manufacturing, and healthcare. These regions present strong opportunities for vendors to introduce scalable, cloud-based traffic analysis tools that cater to growing networks and limited infrastructure. The Global Network Traffic Analyzer Market can expand its footprint by targeting regions like Southeast Asia, Latin America, and Africa where digital adoption is accelerating. It can offer subscription-based models and lightweight solutions to meet local enterprise needs. Vendors that localize offerings and build strategic distribution channels stand to gain significant market share. The demand for secure, efficient network performance monitoring will continue to rise in these underserved regions.
Integration with Next-Generation Technologies and Edge Architectures:
The deployment of 5G networks and the expansion of edge computing create new frontiers for network traffic analysis. Enterprises need visibility into decentralized environments where data processing occurs closer to endpoints. The Global Network Traffic Analyzer Market has the opportunity to develop edge-compatible tools that support real-time traffic monitoring and threat detection. It can align with AI, IoT, and automation initiatives to deliver value-added insights across complex digital ecosystems. Solutions that integrate seamlessly with next-generation architectures will appeal to innovation-driven industries. This creates long-term opportunities for market differentiation and revenue growth.
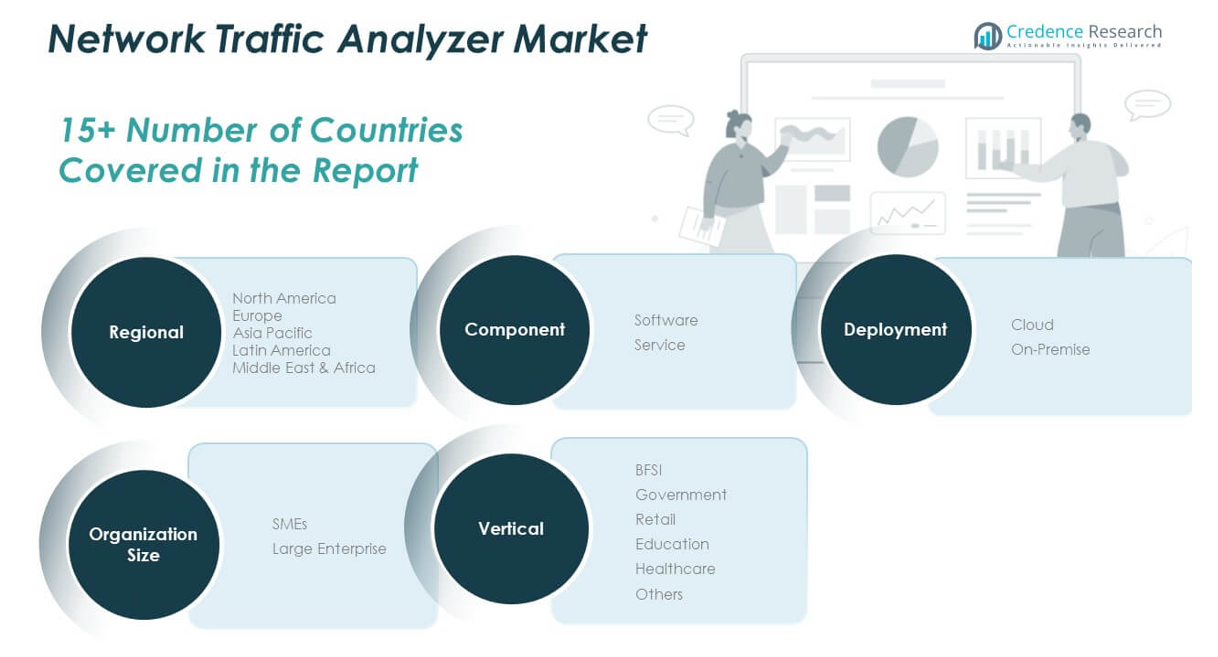
Market Segmentation Analysis:
By Component
The market is segmented into software and service components. Software dominates due to its ability to deliver deep network visibility, real-time packet analysis, and traffic management. It enables enterprises to detect threats and optimize performance across hybrid environments. The service segment supports deployment, configuration, training, and technical support, making it essential for maximizing software utility and long-term performance.
- For instance, SolarWinds’ Network Performance Monitor software supports real-time packet analysis for networks exceeding 100,000 devices, providing customizable dashboards and automated alerts that help enterprises optimize network performance and detect threats proactively.
By Deployment
Deployment models include cloud and on-premise solutions. Cloud-based deployment is growing significantly due to its flexibility, remote accessibility, and scalability, making it suitable for dynamic IT infrastructures. On-premise deployment remains relevant in organizations with strict data governance, privacy concerns, or legacy system dependencies, particularly in finance and defense sectors.
- For instance, Palo Alto Networks’ Prisma Access offers cloud-based deployment for secure, remote network access, supporting flexible onboarding, real-time deployment status tracking, and compliance with stringent data privacy regulations.
By Organization Size
The market is categorized into small and medium enterprises (SMEs) and large enterprises. Large enterprises currently lead due to their complex networks and high-volume data environments that demand advanced analytics. SMEs are adopting cost-effective, scalable traffic analysis tools, aided by the rise of cloud-native and subscription-based models that reduce entry barriers.
By Vertical
Key industry verticals include BFSI, government, retail, education, healthcare, and others. BFSI remains the leading segment due to high regulatory pressure and the need for secure, real-time monitoring. Government and healthcare follow, prioritizing secure communication and uninterrupted services. Retail, education, and others are gradually adopting traffic analyzers to support digital platforms and ensure network reliability.
Segmentation:
By Component
By Deployment
By Organization Size
- Small and Medium Enterprises (SMEs)
- Large Enterprises
By Vertical
- BFSI
- Government
- Retail
- Education
- Healthcare
- Others
By Region
- North America
- Europe
- UK
- France
- Germany
- Italy
- Spain
- Russia
- Rest of Europe
- Asia Pacific
- China
- Japan
- South Korea
- India
- Australia
- Southeast Asia
- Rest of Asia Pacific
- Latin America
- Brazil
- Argentina
- Rest of Latin America
- Middle East
- GCC Countries
- Israel
- Turkey
- Rest of Middle East
- Africa
- South Africa
- Egypt
- Rest of Africa
Regional Analysis:
North America
The North America Network Traffic Analyzer Market size was valued at USD 1,408.12 million in 2018 to USD 1,692.84 million in 2024 and is anticipated to reach USD 2,551.46 million by 2032, at a CAGR of 5.3% during the forecast period. North America holds the largest share of the Global Network Traffic Analyzer Market, contributing over one-third of global revenue in 2024. The region is driven by mature IT infrastructure, high cybersecurity spending, and the early adoption of advanced technologies. The United States leads in demand, supported by compliance mandates, frequent cyber threats, and strong enterprise investment. It benefits from a high concentration of global vendors and continuous innovation in AI-driven traffic monitoring. BFSI, healthcare, and government remain key adopters of network analysis tools. The market shows steady growth with an ongoing shift to hybrid and cloud-native solutions.
Europe
The Europe Network Traffic Analyzer Market size was valued at USD 1,011.06 million in 2018 to USD 1,183.19 million in 2024 and is anticipated to reach USD 1,688.90 million by 2032, at a CAGR of 4.6% during the forecast period. Europe ranks as the second-largest region, with nearly one-quarter market share. Demand is supported by stringent data protection laws like GDPR and increasing digital modernization across banking, public services, and manufacturing. Countries such as Germany, France, and the UK are leading users, driven by their focus on infrastructure security and regulatory compliance. It continues to evolve with growing preference for cloud-integrated and encrypted traffic analysis platforms. Organizations are prioritizing unified network visibility and real-time risk detection. Local governments and telecom providers are investing in performance-driven monitoring tools.
Asia Pacific
The Asia Pacific Network Traffic Analyzer Market size was valued at USD 851.64 million in 2018 to USD 1,085.64 million in 2024 and is anticipated to reach USD 1,821.09 million by 2032, at a CAGR of 6.7% during the forecast period. Asia Pacific is the fastest-growing regional market, led by rapid digitalization and infrastructure upgrades in China, India, Japan, and Southeast Asia. The expansion of 5G, IoT ecosystems, and cloud deployments is creating complex networks that require advanced traffic monitoring. It is witnessing strong adoption in telecom, education, and smart city projects. Governments and enterprises are prioritizing network stability and threat mitigation across critical infrastructure. Regional investments in cybersecurity awareness and policy enforcement are expanding market opportunities. Both global and regional vendors are scaling operations to meet the rising demand for intelligent network visibility tools.
Latin America
The Latin America Network Traffic Analyzer Market size was valued at USD 204.17 million in 2018 to USD 245.58 million in 2024 and is anticipated to reach USD 339.43 million by 2032, at a CAGR of 4.2% during the forecast period. Latin America shows steady growth in the network traffic analyzer space, led by Brazil and Mexico. Public sector digitization, growing e-commerce activity, and rising data center development are key drivers of adoption. It faces some barriers in terms of funding and technical readiness, but cloud-based models are making network analysis more accessible. Enterprises across BFSI and government sectors are adopting tools to address compliance, threat detection, and service uptime. The market is gradually expanding through regional tech partnerships and targeted deployment in mid-tier organizations. It remains an emerging opportunity for scalable, cost-sensitive traffic analysis solutions.
Middle East
The Middle East Network Traffic Analyzer Market size was valued at USD 179.73 million in 2018 to USD 207.63 million in 2024 and is anticipated to reach USD 289.28 million by 2032, at a CAGR of 4.3% during the forecast period. The Middle East is steadily expanding its presence in the Global Network Traffic Analyzer Market. Countries like the UAE and Saudi Arabia are investing in smart city frameworks and digital transformation agendas. It experiences rising demand for secure network environments across energy, telecom, and government segments. Organizations are seeking advanced monitoring tools that ensure business continuity and regulatory adherence. The market benefits from regional cybersecurity programs and increasing cloud services adoption. Global players are strengthening partnerships with local providers to enhance deployment efficiency and customer support.
Africa
The Africa Network Traffic Analyzer Market size was valued at USD 105.28 million in 2018 to USD 159.20 million in 2024 and is anticipated to reach USD 213.10 million by 2032, at a CAGR of 3.4% during the forecast period. Africa represents the smallest regional share but offers long-term potential due to rising digital penetration and infrastructure investments. South Africa and Egypt are leading the regional market, with growing adoption in finance, telecom, and government. It faces challenges such as limited IT capacity and funding gaps, which slow deployment in rural and underserved areas. Cloud-based and SaaS platforms are helping bridge these gaps by lowering capital costs. Awareness around cybersecurity and data protection is increasing, creating opportunities for traffic analyzer solutions. Local initiatives supported by international partnerships are critical to unlocking regional growth.
Shape Your Report to Specific Countries or Regions & Enjoy 30% Off!
Key Player Analysis:
- Arista Networks, Inc.
- Broadcom
- Cloudflare, Inc.
- Fortra, LLC
- Kentik
- Zoho Corporation Pvt. Ltd.
- NEC Corporation
- NETSCOUT
- Netreo
- Progress Software Corporation
Competitive Analysis:
The Global Network Traffic Analyzer Market is highly competitive, with key players focusing on innovation, strategic partnerships, and cloud-based product development. Leading companies such as Arista Networks, Broadcom, Cloudflare, NETSCOUT, and Zoho Corporation drive market growth through robust product portfolios and global reach. It features intense competition across software and service segments, with vendors differentiating through real-time analytics, AI integration, and cross-platform compatibility. Startups and niche providers are entering with scalable, cost-effective solutions tailored for SMEs and emerging markets. Large enterprises prefer vendors with proven performance, security certifications, and flexible deployment models. Strategic acquisitions and collaborations continue to shape the market, enhancing technology capabilities and expanding regional presence. It reflects a balanced mix of established companies and innovative entrants, positioning the market for steady advancement driven by evolving cybersecurity needs and infrastructure modernization.
Recent Developments:
- In July 2025, Arista Networks expanded its AI-driven campus and branch networking offerings by launching new switching, Wi-Fi 7 access point, and WAN products. Notably, Arista acquired the VeloCloud SD-WAN portfolio from Broadcom, enhancing its cognitive branch edge capabilities. This move aims to deliver zero-touch operations, proactive monitoring, and automated troubleshooting across client-to-cloud networking domains, supporting organizations as they scale AI and distributed data strategies.
- In June 2025, Fortra announced the launch of its new global partner program, Fortra Protect, at the EMEA Partner Summit. The program enables value-added resellers and distributors to offer Fortra’s complete cybersecurity portfolio, supporting a unified approach to breaking the attack chain. The initiative includes standardized incentives, sales enablement, and enhanced support for partners. Additionally, in May 2025, Fortra divested its JAMS job automation solution to PSG, sharpening its focus on core cybersecurity offerings.
- In May 2025, Zoho Corporation launched Ulaa Enterprise, a privacy-focused browser designed for enterprise security and network visibility, featuring AI-driven threat prevention at the browser level. At Zoholics 2025, Zoho also introduced deeper AI capabilities in its CRM for Everyone platform and unveiled Zoho Payments, a unified payment solution natively integrated with Zoho’s business apps, supporting secure and seamless financial operations.
- In May 2025, NETSCOUT reported strong performance in its cybersecurity product line and announced executive transitions, with new COO and CFO appointments effective June 2025. The company’s product backlog grew to $33.1 million, driven by demand for enterprise performance management and carrier service assurance solutions. NETSCOUT remains a key provider of DDoS protection and network observability tools for large enterprises and service providers.
Market Concentration & Characteristics:
The Global Network Traffic Analyzer Market exhibits moderate to high market concentration, with a few dominant players controlling a significant share of global revenue. It is characterized by rapid technological evolution, high demand for real-time analytics, and growing emphasis on cybersecurity compliance. Leading vendors focus on advanced features such as AI-driven diagnostics, cloud-native integration, and encrypted traffic analysis to maintain competitive advantage. The market supports a mix of established global firms and emerging technology providers offering specialized solutions for SMEs and regional clients. It favors innovation, scalability, and interoperability, with customers prioritizing ease of deployment and vendor support. Demand is strongest in sectors with complex network environments and high data sensitivity, such as BFSI, healthcare, and government.
Report Coverage:
The research report offers an in-depth analysis based on component, deployment, organization size, and vertical. It details leading market players, providing an overview of their business, product offerings, investments, revenue streams, and key applications. Additionally, the report includes insights into the competitive environment, SWOT analysis, current market trends, as well as the primary drivers and constraints. Furthermore, it discusses various factors that have driven market expansion in recent years. The report also explores market dynamics, regulatory scenarios, and technological advancements that are shaping the industry. It assesses the impact of external factors and global economic changes on market growth. Lastly, it provides strategic recommendations for new entrants and established companies to navigate the complexities of the market.
Future Outlook:
- Increasing adoption of AI and machine learning will enhance predictive network analysis and automated threat detection.
- Cloud-native solutions will dominate future deployments, driven by hybrid work environments and multi-cloud infrastructure.
- Demand from SMEs will grow due to availability of scalable, subscription-based traffic analysis tools.
- Expansion of 5G and IoT networks will create new requirements for high-volume, low-latency traffic monitoring.
- Encrypted traffic analysis will become standard as more organizations prioritize privacy without compromising visibility.
- Integration with unified security and performance platforms will drive demand for all-in-one analytics solutions.
- Emerging markets in Asia, Latin America, and Africa will contribute significantly to volume-based growth.
- Regulatory compliance in data-sensitive sectors will sustain enterprise investments in real-time monitoring.
- Partnerships between global vendors and regional service providers will accelerate localized adoption.
- Continued innovation in edge computing will create new use cases for distributed network traffic analysis.


