
Market Overview
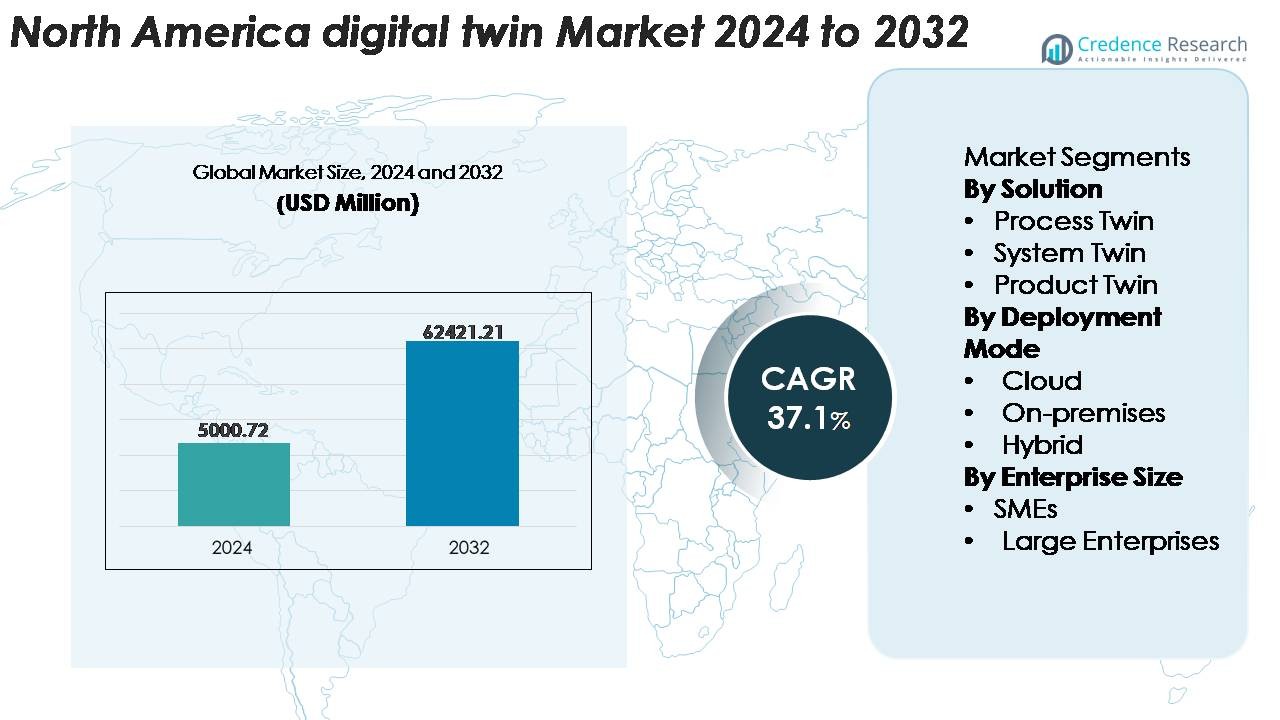
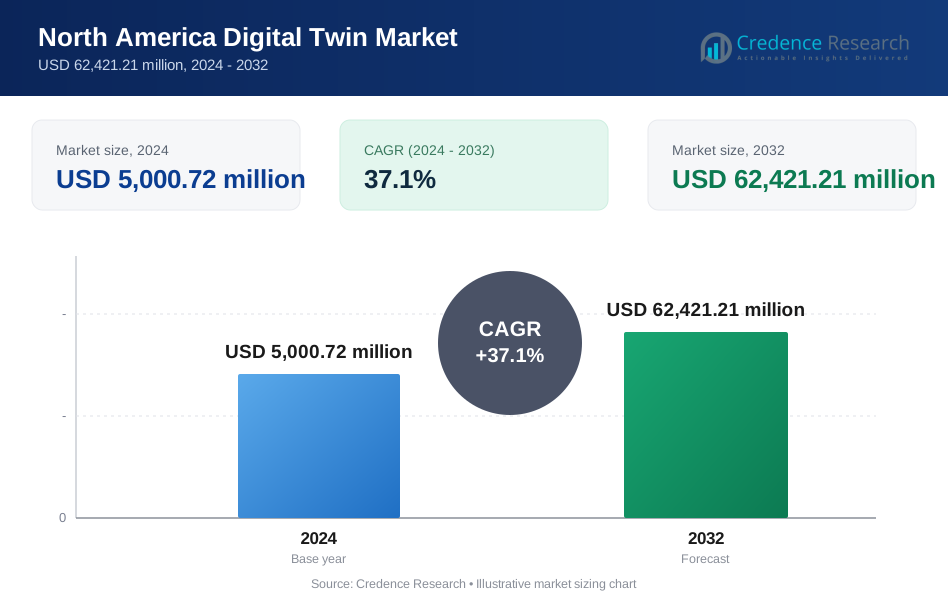
The North America digital twin market was valued at USD 5,000.72 million in 2024 and is projected to reach USD 62,421.21 million by 2032, expanding at a CAGR of 37.1% during the forecast period (2025–2032).
| REPORT ATTRIBUTE | DETAILS |
|---|---|
| Historical Period | 2020-2023 |
| Base Year | 2024 |
| Forecast Period | 2025-2032 |
| North America digital twin market Size 2024 | USD 5,000.72 Million |
| North America digital twin market, CAGR | 37.1% |
| North America digital twin market Size 2032 | USD 62,421.21 Million |
The North America digital twin market is shaped by leading technology and industrial players such as IBM, Microsoft, PTC, Siemens, General Electric, Oracle, Autodesk, ANSYS, and Dassault Systèmes, each offering advanced simulation, IoT integration, and AI-driven predictive analytics platforms. These companies strengthen their regional presence through cloud-based digital twin suites, real-time operational intelligence tools, and sector-specific engineering solutions. The United States remains the dominant regional market, capturing approximately 82% of the total North American share due to its strong digital transformation ecosystem, extensive industrial automation, and rapid adoption across aerospace, manufacturing, automotive, and energy sectors.
Market Insights
- The North America digital twin market was valued at USD 5,000.72 million in 2024 and is projected to reach USD 62,421.21 million by 2032, expanding at a 37.1% CAGR during 2025–2032.
- Market growth is driven by rapid industrial digitalization, strong IoT penetration, and rising adoption of AI-enabled predictive maintenance, with Product Twin leading the solution segment at over 45% share due to its extensive use in manufacturing and automotive design cycles.
- Key trends include the integration of AI-driven simulations, expansion of edge-enabled operational twins, and increasing deployment across smart infrastructure and energy systems.
- Competitive intensity is high, with IBM, Microsoft, Siemens, PTC, ANSYS, GE, and Dassault Systèmes shaping the landscape through scalable cloud platforms, real-time analytics, and sector-focused engineering solutions, though high integration costs remain a restraint.
- Regionally, the U.S. dominates with ~82% share, followed by Canada at ~12% and Mexico at ~6%, reflecting varying digital maturity and industrial automation levels across the region.
Market Segmentation Analysis:
By Solution
In the North America digital twin market, Product Twin emerges as the dominant sub-segment, holding the largest share due to its extensive use in asset performance monitoring, predictive maintenance, and lifecycle optimization across manufacturing, automotive, aerospace, and energy sectors. Organizations deploy product-level twins to simulate behavior, improve engineering precision, and reduce physical prototyping cycles. Process Twin solutions continue to gain traction in industries with complex workflows, while System Twin adoption accelerates in utilities and logistics networks. The dominance of Product Twin is driven by high adoption of digitalized product development and increasing integration with IoT and PLM platforms.
- For instance, supports large-scale product-twin deployments through its Teamcenter platform, which manages more than 7 million licensed users worldwide and handles product configurations containing over 150,000 individual components in complex programs such as aerospace assemblies.
By Deployment Mode
The Cloud deployment model accounts for the largest share in North America, propelled by rapid scalability, lower upfront investment, and seamless integration with real-time IoT data streams. Enterprises prefer cloud-based digital twin platforms for remote monitoring, multi-site operations, and continuous analytics across distributed assets. On-premises deployments remain relevant in highly regulated industries such as aerospace, defense, and pharmaceuticals due to strict data-control requirements. Hybrid deployment is expanding as organizations combine local processing for sensitive data with cloud-based analytics for complex simulations. Cloud dominance is driven by accelerated cloud-migration initiatives and high adoption of industrial SaaS ecosystems.
- For instance, Microsoft Azure Digital Twins supports graph-based environments containing millions of digital twin entities and relationships, enabling large industrial customers to simulate entire factories or utility networks in real time.
By Enterprise Size
Large enterprises represent the dominant sub-segment, capturing the highest market share owing to their strong financial capabilities, extensive asset bases, and established digital transformation roadmaps. Major players in manufacturing, energy, automotive, and utilities implement large-scale digital twin programs to optimize operations, enhance predictive maintenance, and reduce system downtime. SMEs are increasing adoption as modular, subscription-based solutions lower entry barriers; however, limited budgets and integration complexities slow their penetration. The leadership of large enterprises is driven by multi-million-dollar investments in IoT infrastructure, real-time analytics platforms, and advanced simulation technologies.
Key Growth Drivers
Rapid Industrial Digitalization and Integration of IoT–Enabled Asset Ecosystems
North America’s rapid shift toward Industry 4.0 significantly accelerates digital twin adoption as enterprises expand IoT-driven monitoring, predictive maintenance, and real-time asset optimization across industrial facilities. Manufacturers, utilities, transportation networks, and energy operators increasingly deploy sensor-rich systems that generate high-frequency telemetry essential for accurate digital twin simulations. The widespread presence of connected equipment and the region’s strong 5G rollout further enhance real-time synchronization between physical assets and digital replicas. Industries leverage these capabilities to boost equipment reliability, extend asset life, reduce operational variability, and streamline engineering cycles. As predictive analytics and condition-based maintenance become standard, digital twins evolve from optional innovation tools to mission-critical operational platforms. This deepening integration between IoT ecosystems and simulation models is a primary driver strengthening market expansion.
- For instance, Siemens' industrial IoT platform, known as Insights Hub (formerly MindSphere), processes vast amounts of data to enable high-resolution telemetry feeds for digital twin simulations and advanced analytics, supporting industrial operations and optimization.
Strong Adoption Across High-Value Sectors Such as Aerospace, Automotive, and Energy
North America’s leadership in high-value engineering sectors fuels extensive demand for digital-twin-enabled modeling, testing, and lifecycle management. Aerospace and defense organizations utilize twins to simulate propulsion systems, optimize avionics performance, and validate safety-critical components without extensive physical testing. Automotive OEMs deploy digital twins for EV battery diagnostics, thermal simulations, and autonomous vehicle development, reducing costly prototyping cycles. Meanwhile, energy operators rely on plant-level and grid-level twins to monitor turbines, transformers, substations, and offshore assets. These industries handle complex systems with high downtime costs, making digital twins essential for operational continuity and engineering agility. Their sustained investment in advanced simulation platforms, real-time analytics, and edge-cloud integration strengthens digital twin penetration across the region.
- For instance, in aerospace, Rolls-Royce’s digital twin environment monitors more than 13,000 aircraft engines in active service, generating over 70 trillion data points per year for performance modeling and predictive maintenance.
Expansion of Smart Infrastructure, Smart Cities, and Large-Scale Public Digitalization Programs
North America’s increasing investment in smart infrastructure significantly boosts digital twin market growth as governments and municipalities integrate simulation platforms to improve urban planning, resource allocation, and infrastructure resilience. Cities deploy digital twins for traffic management, utilities optimization, flood-risk modeling, and energy-efficiency forecasting. Infrastructure operators use twins to assess structural integrity of bridges, tunnels, rail networks, and public buildings through real-time monitoring systems. Digital twins also support emergency response planning, scenario testing, and environmental modeling. Federal and state-level innovation programs encourage adoption across public infrastructure modernization initiatives, stimulating vendor participation and cross-sector collaboration. As cities expand sensor networks and digital command centers, digital twins become foundational for predictive governance and long-term infrastructure planning, driving sustained regional adoption.
Key Trends & Opportunities
Rising Adoption of AI-Driven Simulation, Autonomous Optimization, and Self-Learning Twins
A key market trend centers on integrating advanced AI and machine-learning engines into digital twin platforms to enable autonomous decision-making and self-optimizing asset behavior. AI-enhanced twins continuously analyze historical, real-time, and predictive datasets to generate automated recommendations, enabling operators to minimize failures, optimize throughput, and improve accuracy of engineering simulations. North American enterprises increasingly invest in AI-powered simulation tools for anomaly detection, automated fault prediction, and real-time process forecasting. This opportunity expands further as machine-learning-enhanced twins evolve into closed-loop systems capable of self-correcting operational deviations. The convergence of AI, next-gen simulation engines, and edge intelligence positions digital twins as strategic intelligence systems rather than purely visual replicas, creating strong adoption momentum across modern industrial environments.
- For instance, BMW Group uses NVIDIA Omniverse–powered AI simulation to operate digital twins across 31 manufacturing plants, enabling factory-scale physics modeling and real-time robotics coordination.
Expansion of Cross-Industry Collaboration and Interoperable Twin Ecosystems
A growing opportunity emerges from the development of interoperable digital twin ecosystems capable of integrating data from multiple domains-manufacturing floors, energy grids, logistics networks, healthcare systems, and smart buildings. North American industries increasingly adopt open architectures, cross-platform APIs, and standardized data models to enable system-level visibility across complex, multi-stakeholder environments. This trend allows enterprises to scale from single-asset twins to multi-plant, multi-fleet, or city-wide operational replicas. Collaboration between cloud providers, simulation vendors, engineering companies, and industrial OEMs strengthens ecosystem synergies. As more organizations demand unified monitoring, shared analytics, and ecosystem-scale decision frameworks, interoperability becomes a powerful growth catalyst, transforming digital twin deployments into large integrated digital infrastructures.
- For instance, Microsoft’s Azure Digital Twins platform supports graph models containing millions of interconnected nodes and relationships, enabling multi-domain synchronization across factories, buildings, and utility networks.
Growth of Edge-Enabled and Real-Time Operational Twins
A major trend shaping the region is the rise of edge-computing-enabled digital twins capable of performing real-time modeling and local decision-making near the physical asset. Industries handling time-sensitive operations such as power distribution, autonomous logistics, heavy manufacturing, and oil & gas benefit from edge-level processing that reduces latency and enhances operational precision. The convergence of edge gateways, industrial networking, and low-latency compute solutions enables organizations to deploy twins closer to the source of data, improving responsiveness and reliability. This trend opens new opportunities for operational twins that support mission-critical processes requiring continuous synchronization and instant analytics.
Key Challenges
High Implementation Costs and Complex Integration with Legacy Infrastructure
Despite strong growth, digital twin adoption in North America faces challenges due to high initial setup costs, complex integration requirements, and the need for substantial digital infrastructure upgrades. Many industrial facilities operate legacy machines, disconnected systems, and outdated SCADA networks that require significant modernization before establishing real-time digital twin environments. Integrating heterogeneous data sources, ensuring compatibility across sensors, software, and simulation systems, and maintaining accurate synchronization demand substantial investment. Smaller enterprises face budget limitations, while large enterprises encounter long deployment cycles and complex multi-site integration. These financial and operational barriers slow scalability, particularly in asset-intensive sectors.
Rising Data Governance, Cybersecurity Risks, and Model Reliability Concerns
Digital twin platforms continuously process vast volumes of operational, engineering, and sensor-generated data, increasing concerns about cybersecurity, data integrity, and compliance. Real-time mirroring of critical infrastructure systems-such as power grids, manufacturing plants, and transportation networks-makes twins potential cyberattack targets. Ensuring data confidentiality, model reliability, and safe bidirectional communication becomes a major challenge. Additionally, inaccurate models or poorly calibrated simulation engines can result in misleading predictions, operational disruptions, or safety risks. Addressing these vulnerabilities requires robust encryption, zero-trust frameworks, continuous validation, and regulatory-compliant data handling, which adds complexity to widespread adoption.
Regional Analysis
United States
The United States dominates the North America digital twin market, accounting for approximately 82% of the regional share, driven by large-scale adoption across manufacturing, automotive, aerospace, energy, and smart infrastructure programs. The country’s strong ecosystem of cloud providers, simulation software vendors, digital engineering firms, and 5G-enabled industrial networks accelerates deployment across industrial value chains. U.S. enterprises lead in integrating AI-powered predictive maintenance, lifecycle management twins, and system-level operational twins. High investments in Industry 4.0 initiatives, federal smart infrastructure programs, and digital transformation across Fortune 500 corporations continue to position the U.S. as the core growth engine within the region.
Canada
Canada holds around 12% of the North America digital twin market, supported by increasing adoption across energy utilities, public infrastructure, mining operations, and advanced manufacturing clusters in Ontario and Quebec. Canadian enterprises leverage digital twins for asset reliability, environmental monitoring, and grid modernization initiatives. Government-backed innovation programs accelerate the use of twins in smart city development, transportation modeling, and carbon-intensive sectors such as oil & gas. Growing collaboration between universities, engineering firms, and industrial operators strengthens research-driven deployment. Although smaller than the U.S. market, Canada is steadily expanding its footprint through targeted digitalization strategies and rising industrial automation investment.
Mexico
Mexico accounts for approximately 6% of the North America digital twin market, with growth concentrated in automotive manufacturing, electronics assembly, and industrial automation hubs along major industrial corridors. The country’s expanding network of nearshoring-driven manufacturing facilities increases demand for digital twins to enhance production efficiency, minimize downtime, and improve quality control. Adoption is further supported by multinational OEMs integrating real-time monitoring and simulation tools across local plants. While digital twin penetration remains in an early stage due to infrastructure limitations, rapid industrial expansion and increasing technological investments position Mexico as a rising growth contributor within the region.
Market Segmentations:
By Solution
- Process Twin
- System Twin
- Product Twin
By Deployment Mode
- Cloud
- On-premises
- Hybrid
By Enterprise Size
- SMEs
- Large Enterprises
By Geography
- U.S.
- Canada
- Mexico
Competitive Landscape
The competitive landscape of the North America digital twin market is defined by a strong presence of global technology leaders, industrial automation providers, and engineering simulation specialists competing to deliver advanced, scalable, and sector-specific digital twin solutions. Key players such as IBM, Microsoft, PTC, Siemens, General Electric, Dassault Systèmes, ANSYS, Oracle, and Autodesk focus on integrating cloud platforms, real-time analytics, and AI-driven modeling to support multi-asset, multi-system, and enterprise-level deployments. These companies invest heavily in expanding partner ecosystems across manufacturing, aerospace, automotive, energy, and smart infrastructure domains to strengthen interoperability and accelerate customer adoption. Strategic initiatives such as platform enhancements, digital engineering collaborations, and acquisition of simulation or IoT-focused startups further intensify competition. Additionally, high-value projects in predictive maintenance, grid modernization, and virtual commissioning attract large enterprise clients, reinforcing market consolidation among established vendors. Despite strong innovation, new entrants offering specialized analytics and edge-twin capabilities continue to diversify the competitive dynamics.
Key Player Analysis
- Microsoft
- Hexagon
- GE Vernova
- Dassault Systèmes
- Amazon Web Services (AWS)
- Siemens
- Rockwell Automation
Recent Developments
- In 2025, GE Vernova also shared a dedicated article discussing digital twin technology and analytics for asset optimization.
- In 2024, Hexagon announced a collaboration with Microsoft to enhance industrial operations via a cloud-native SaaS platform.
Report Coverage
The research report offers an in-depth analysis based on Solution, Deployment mode, Enterprise size and Geography. It details leading market players, providing an overview of their business, product offerings, investments, revenue streams, and key applications. Additionally, the report includes insights into the competitive environment, SWOT analysis, current market trends, as well as the primary drivers and constraints. Furthermore, it discusses various factors that have driven market expansion in recent years. The report also explores market dynamics, regulatory scenarios, and technological advancements that are shaping the industry. It assesses the impact of external factors and global economic changes on market growth. Lastly, it provides strategic recommendations for new entrants and established companies to navigate the complexities of the market.
Future Outlook
- Demand for real-time, AI-driven digital twin models will accelerate as industries prioritize predictive operations and automation.
- Adoption of multi-system and enterprise-scale twins will grow as organizations expand digital transformation across interconnected assets.
- Edge-enabled digital twins will gain traction to support low-latency, mission-critical industrial processes.
- Integration of digital twins with 5G networks will enhance data flow, simulation accuracy, and remote operational visibility.
- Smart city and infrastructure modernization projects will increasingly rely on digital twins for planning, monitoring, and resilience management.
- Collaboration between cloud providers, simulation vendors, and industrial OEMs will deepen to create unified, interoperable platforms.
- Manufacturing, automotive, aerospace, and energy sectors will continue driving the largest deployment volumes.
- Adoption among SMEs will rise as modular, subscription-based digital twin solutions reduce implementation barriers.
- Sustainability initiatives will push industries to use twins for energy optimization and emissions monitoring.
- Regulatory momentum toward digital engineering and infrastructure digitalization will strengthen long-term market expansion.
Request a Free Sample
Fill in your details and we'll send you a free sample report.
- Sample data tables & charts
- Research methodology
Need a Custom Version of This Report?
Tailor the scope, geography, or segments to your exact requirements.
- Custom geography or segment scope
- Direct access to our analyst team
Frequently Asked Questions
What is the current market size for the North America digital twin market, and what is its projected size in 2032?
At what Compound Annual Growth Rate is the North America digital twin market projected to grow between 2025 and 2032?
Which North America digital twin segment held the largest share in 2024?
What are the primary factors fueling the growth of the North America digital twin market?
Who are the leading companies in the North America digital twin market?
Which region commanded the largest share of the North America digital twin market in 2024?
Table of Content
Chapter 1. Report Introduction
- 1.1 Report Description & Purpose
- 1.1.1 Report Title & Market Definition
- 1.1.2 Unique Selling Propositions (USP) & Key Differentiators
- 1.1.3 Value Proposition for Stakeholders
- 1.2 Research Objectives
- 1.2.1 Market Sizing Objectives (Volume & Revenue)
- 1.2.2 Segmentation Objectives
- 1.2.3 Competitive Intelligence Objectives
- 1.2.4 Forecast & Scenario Objectives
- 1.3 Report Scope
- 1.3.1 North America Digital Twin Scope – Types & Subtypes Covered
- 1.3.2 Geographic Scope – Regions & Countries Covered
- 1.3.3 Historical Period, Base Year & Forecast Period (2024; forecast to 2032)
- 1.3.4 Inclusions & Exclusions
- 1.4 HS Code & Classification Framework
- 1.5 Currency, Units & Pricing Basis
- 1.6 Target Stakeholders
- 1.7 Limitations & Assumptions
Chapter 2. Executive Summary
- 2.1 Global North America Digital Twin Market Snapshot
- 2.1.1 Market Size – Historical (2024) & Forecast (2024-2032) (2024: USD 5,000.72 million → 2032: USD 62,421.21 million)
- 2.1.2 Volume & Revenue – Global Totals
- 2.1.3 Key Market Highlights – Top Five Facts
- 2.2 North America Digital Twin Market Segmentation Snapshot
- 2.2.1 Market Split by Region – 2024 vs. 2032
- 2.3 Competitive Snapshot
- 2.3.1 Top 10 Players by Revenue Share – 2024
- 2.3.2 Top 10 Players by Volume Share – 2024
- 2.3.3 Recent Strategic Developments (18-Month Summary)
- 2.4 Key Investment Highlights & Strategic Conclusions
Chapter 3. North America Digital Twin Market Dynamics & Industry Analysis
- 3.1 Market Overview & Context
- 3.1.1 North America Digital Twin Market Position in the Broader Automotive Value Chain
- 3.1.2 OEM vs. Replacement Market Dynamics
- 3.1.3 Market Maturity & Development Stage by Region
- 3.2 North America Digital Twin Market Drivers
- 3.3 North America Digital Twin Market Restraints & Challenges
- 3.4 North America Digital Twin Market Opportunities
- 3.5 Porter's Five Forces Analysis
- 3.5.1 Threat of New Entrants
- 3.5.2 Bargaining Power of Suppliers
- 3.5.3 Bargaining Power of Buyers
- 3.5.4 Threat of Substitutes
- 3.5.5 Competitive Rivalry – Intensity Assessment
- 3.6 North America Digital Twin Value Chain Analysis
- 3.6.1 Upstream – Raw Material/Input Suppliers
- 3.6.1.1 Raw Material/Input 1
- 3.6.1.2 Raw Material/Input 2
- 3.6.1.3 Raw Material/Input 3
- 3.6.2 Midstream – Production/Manufacturing/Service Delivery
- 3.6.2.1 Production/Process Overview
- 3.6.2.2 Key Facility Locations & Capacity by Manufacturer
- 3.6.3 Downstream – Distribution & End Consumer
- 3.6.3.1 Primary Channel – B2B/OEM
- 3.6.3.2 Secondary Channels – Dealer, Retail, Online, Direct
- 3.6.4 Value Chain Profitability Analysis
- 3.6.1 Upstream – Raw Material/Input Suppliers
- 3.7 PESTEL Analysis
- 3.7.1 Political Factors
- 3.7.2 Economic Factors
- 3.7.3 Social Factors
- 3.7.4 Technological Factors
- 3.7.5 Environmental Factors
- 3.7.6 Legal Factors
- 3.8 North America Digital Twin Supply Chain Analysis
- 3.8.1 Raw Material/Input Supply Risk Assessment
- 3.8.2 Manufacturing Concentration Risk (Geographic Exposure)
- 3.8.3 Trade Disruption Impact Analysis
- 3.9 Regulatory & Policy Landscape
Note: The regulatory and policy landscape section covers regulations based on their applicability to the market, North America Digital Twin category, geography, and scope of the study. Only regulatory frameworks with a material impact on operations, compliance, trade, sustainability, or market access are analyzed in detail.
Chapter 4. Key Investment Pockets & Opportunity Analysis
- 4.1 North America Digital Twin Market Attractiveness Analysis
- 4.1.1 By Region – Investment Attractiveness Matrix (Volume × CAGR)
- 4.2 Absolute Revenue Growth Opportunity
- 4.2.1 By Region – Absolute USD Growth Through 2032
- 4.3 Incremental Volume Opportunity
- 4.3.1 By Region – Incremental Volume Through 2032
- 4.3.2 Segment – Incremental Volume
- 4.4 Emerging Submarket Opportunity Deep Dive (Subject to Applicability)
- 4.5 Emerging Market Opportunity Scorecards
- 4.5.1 United States
- 4.5.2 Europe
- 4.5.3 Asia
- 4.5.4 Middle East & Africa
Note: Emerging Market Opportunity Scorecards will be included based on relevance and strategic importance. Regions listed are indicative and may vary depending on data availability and market dynamics.
Chapter 5. North America Digital Twin Import-Export Analysis & Trade Flows
- 5.1 Global Trade Overview
- 5.1.1 Global Export Value by Country (2024)
- 5.1.2 Global Export Volume by Country (2024)
- 5.1.3 Global Import Value by Country (2024)
- 5.1.4 Global Import Volume by Country (2024)
- 5.1.5 Net Trade Balance by Country (2024)
- 5.2 Export Analysis – Segment
- 5.2.1 Type 1 (HS Code)
- 5.2.2 Type 2 (HS Code)
- 5.2.3 Type 3 (HS Code)
- 5.2.4 Type 4 (HS Code)
- 5.2.5 Type 5 (HS Code)
- 5.3 Import Analysis – Segment
- 5.3.1 Type 1 (HS Code)
- 5.3.2 Type 2 (HS Code)
- 5.3.3 Type 3 (HS Code)
- 5.3.4 Type 4 (HS Code)
- 5.3.5 Type 5 (HS Code)
- 5.4 Average Unit Trade Prices
- 5.4.1 Average Export Price – Segment & Country
- 5.4.2 Average Import Price – Segment & Source Country
- 5.4.3 Price Trends (2024)
- 5.5 Key Trade Route Analysis
- 5.5.1 Trade Route 1
- 5.5.2 Trade Route 2
- 5.5.3 Trade Route 3
- 5.5.4 Trade Route 4
- 5.5.5 Trade Route 5
- 5.6 Trade Policy Impact Assessment
- 5.6.1 US Anti-Dumping & Section 301 Tariffs
- 5.6.2 EU Customs Union Impact
- 5.6.3 Major Free Trade Agreements
- 5.6.4 USMCA Rules of Origin
Note: Trade policy analysis will be included only where relevant to the North America Digital Twin market.
Chapter 6. Competitive Landscape & Company Benchmarking
- 6.1 North America Digital Twin Market Concentration & Structure
- 6.1.1 Herfindahl-Hirschman Index (HHI) – vs. 2024
- 6.1.2 Tier 1, Tier 2 & Tier 3 Market Structure
- 6.1.3 Global, Regional & Local Player Dynamics
- 6.2 North America Digital Twin Market Share Analysis – 2024
- 6.2.1 Global Revenue Share by Company
- 6.2.2 Global Volume Share by Company
- 6.2.3 Regional Revenue Share
- 6.2.4 Market Share Evolution ( vs. 2024)
- 6.2.5 OEM Segment Share by Company
- 6.2.6 Replacement Segment Share by Company
- 6.3 Production/Delivery Capacity & Facility Analysis
- 6.3.1 Global Installed Capacity
- 6.3.2 Capacity Utilization Rates
- 6.3.3 Production/Output Volume
- 6.3.4 Facility Locations & Capacity Map
- 6.3.5 Planned Capacity Additions
- 6.4 North America Digital Twin Competitive Benchmarking Matrix
- 6.4.1 Revenue, Volume, CAGR & Profitability Comparison
- 6.4.2 Channel Revenue Mix
- 6.4.3 Geographic Revenue Exposure
- 6.4.4 R&D Intensity
- 6.4.5 Sustainability Maturity
- 6.5 Strategic Developments in North America Digital Twin (Last 24 Months)
- 6.5.1 Mergers, Acquisitions & Divestments
- 6.5.2 New North America Digital Twin Launches
- 6.5.3 Facility Expansions
- 6.5.4 Strategic Alliances, Joint Ventures & Partnerships
- 6.5.5 Distribution Expansion & Market Entry
- 6.5.6 Sustainability & ESG Initiatives
- 6.6 Competitive Strategy Mapping
- 6.6.1 Leader, Challenger, Follower & Niche Classification
- 6.6.2 Pricing Strategy Comparison
- 6.6.3 Channel Strategy Matrix
Note: Strategic developments are included based on their materiality and the availability of reliable information.
Chapter 7. Global North America Digital Twin Market – By Distribution Channel
- 7.1 Segment Overview
- 7.1.1 Volume & Revenue Split by Channel (2024 & 2032)
- 7.1.2 Channel Mix Evolution (2024-2032)
Chapter 8. Regional Market Analysis – Global Overview
- 8.1 Global Regional Overview
- 8.1.1 Regional Volume Share
- 8.1.2 Regional Revenue Share
- 8.1.3 Regional Volume by Region
- 8.1.4 Regional Revenue by Region
- 8.1.5 Regional Forecast Through 2032
- 8.2 Cross-Regional Segment Analysis
- 8.2.1 By Distribution Channel
- 8.2.2 By Brand/Price Tier
Chapter 9. North America North America Digital Twin Market
- 9.1 United States
- 9.2 Canada
- 9.3 Mexico
Chapter 10. Europe North America Digital Twin Market
- 10.1 Germany
- 10.2 France
- 10.3 Italy
- 10.4 United Kingdom
- 10.5 Spain
- 10.6 Poland
- 10.7 Russia
- 10.8 Netherlands
- 10.9 Belgium
- 10.10 Sweden
- 10.11 Denmark
- 10.12 Norway
- 10.13 Rest of Europe
Chapter 11. Asia Pacific North America Digital Twin Market
- 11.1 China
- 11.2 India
- 11.3 Japan
- 11.4 South Korea
- 11.5 Thailand
- 11.6 Indonesia
- 11.7 Vietnam
- 11.8 Malaysia
- 11.9 Australia
- 11.10 Rest of Asia Pacific
Chapter 12. Latin America North America Digital Twin Market
- 12.1 Brazil
- 12.2 Argentina
- 12.3 Colombia
- 12.4 Chile
- 12.5 Rest of Latin America
Chapter 13. Middle East North America Digital Twin Market
- 13.1 Saudi Arabia
- 13.2 United Arab Emirates
- 13.3 Turkey
- 13.4 Israel
- 13.5 Iran
- 13.6 Rest of the Middle East
Chapter 14. Africa North America Digital Twin Market
- 14.1 South Africa
- 14.2 Egypt
- 14.3 Nigeria
- 14.4 Morocco
- 14.5 Rest of Africa
Chapter 15. North America Digital Twin Company Profiles
- 15.1 [Company 01]
- 15.1.1 Company Overview
- 15.1.2 Key Management Personnel
- 15.1.3 Products & Services Portfolio
- 15.1.4 Financial Performance
- 15.1.5 Key Market Focus & Geographic Presence
- 15.1.6 Recent Developments & Strategic Initiatives
Note: The company profile list is preliminary and may change based on research findings, market developments, data availability, and client requirements.
Chapter 16. Appendices
- Appendix A – List of Abbreviations & Acronyms
- Appendix B – Industry Classification Code Reference – Full Series
- Appendix C – Production & Capacity Data Tables
- Appendix D – End-Use & Demand Base Tables
- Appendix E – Consumption & Replacement Rate Assumptions
- Appendix F – ASP Reference Tables
- Appendix G – Manufacturing & Facility Database
- Appendix H – Import-Export Data Tables
- Appendix I – Regulatory Summary Tables
- Appendix J – Primary Research Participant List (Anonymized)
- Appendix K – Primary Research Questionnaire Framework
- Appendix L – Data Sources & Bibliography
- Appendix M – Market Size Divergence & Source Comparison
Chapter 17. Research Methodology
- 17.1 Research Framework & Philosophy
- 17.2 Secondary Research – Sources, Hierarchy & Data Extraction
- 17.3 Data Modeling – Bottom-Up & Top-Down Market Sizing
- 17.4 Primary Research – Stakeholder Framework, LOI & Sample Sizes
- 17.5 Forecast Methodology – Regression, Scenario & Sensitivity Analysis
- 17.6 Quality Control – Four-Layer Validation Framework
- 17.7 Limitations & Standard Assumptions
- 17.8 Disclaimer
