Market Overview:
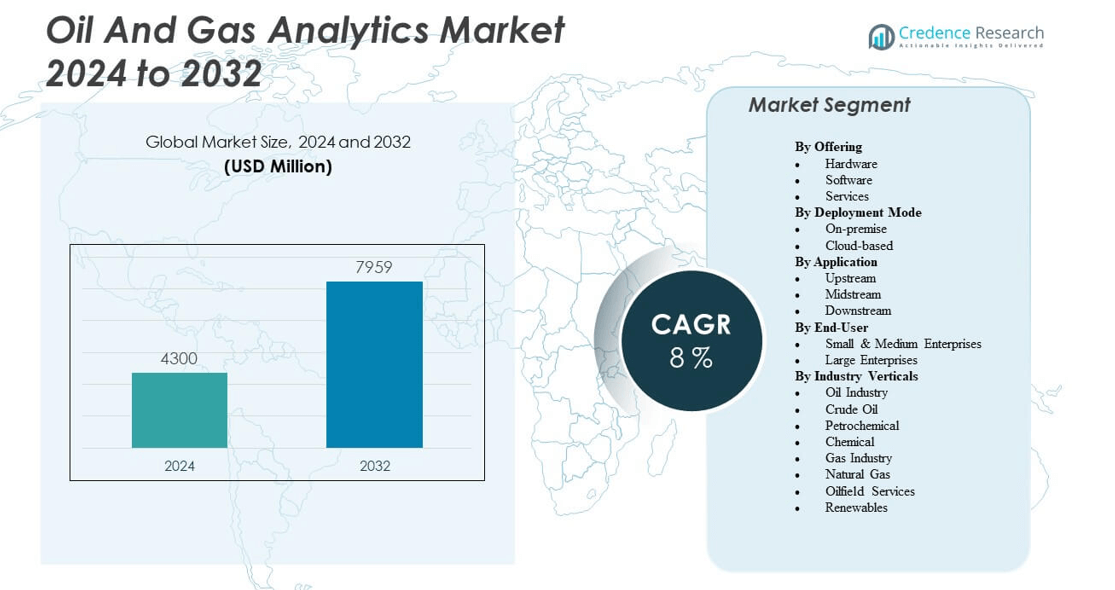
The Oil and Gas Analytics Market is projected to grow from USD 4,300 million in 2024 to an estimated USD 7,959 million by 2032, with a compound annual growth rate (CAGR) of 8% from 2024 to 2032.
| REPORT ATTRIBUTE |
DETAILS |
| Historical Period |
2020-2023 |
| Base Year |
2024 |
| Forecast Period |
2025-2032 |
| Oil and Gas Analytics Market Size 2024 |
USD 4,300 million |
| Oil and Gas Analytics Market, CAGR |
8% |
| Oil and Gas Analytics Market Size 2032 |
USD 7,959 million |
The growth of the Oil and Gas Analytics Market is driven by rising demand for efficient operations, safety, and cost optimization in the industry. Companies are leveraging analytics to enhance exploration, production, and refining processes by integrating advanced tools such as predictive maintenance, reservoir modeling, and real-time monitoring. The increasing adoption of digital oilfields, coupled with the need for operational transparency, is fueling demand. Additionally, the rise in unstructured data volumes and the integration of AI and machine learning into analytics platforms strengthen decision-making and efficiency across upstream, midstream, and downstream sectors.
North America leads the Oil and Gas Analytics Market due to strong digital adoption and the presence of major oil and gas companies investing in advanced technologies. Europe follows with increased focus on sustainability, energy efficiency, and smart operations. Asia-Pacific is an emerging region, with countries like China and India accelerating adoption of analytics to meet rising energy needs and optimize exploration efforts. The Middle East also shows growing interest as national oil companies modernize their infrastructure and integrate analytics for higher productivity, making it another important emerging region in this market.
Market Insights:
- The Oil and Gas Analytics Market is projected to grow from USD 4,300 million in 2024 to USD 7,959 million by 2032, at a CAGR of 8%.
- Rising demand for operational efficiency and cost reduction drives adoption across upstream, midstream, and downstream operations.
- Predictive maintenance and AI integration improve asset reliability, reducing downtime and extending equipment lifecycle.
- High capital costs and lack of skilled workforce restrain adoption among small and medium enterprises.
- North America leads with 36% share due to shale exploration and strong digital infrastructure.
- Europe accounts for 27% with emphasis on sustainability, transparency, and regulatory compliance in oil and gas operations.
- Asia-Pacific holds 22% share and shows fastest growth driven by industrialization, energy demand, and national oil company investments.
Access crucial information at unmatched prices!
Request your sample report today & start making informed decisions powered by Credence Research Inc.!
Download Sample
Market Drivers:
Rising Demand for Operational Efficiency and Productivity in Complex Oilfield Environments
The Oil And Gas Analytics Market benefits from the industry’s focus on optimizing operations to reduce downtime and maximize production. Companies adopt analytics tools to improve asset utilization, streamline workflows, and strengthen decision-making. Real-time monitoring helps in minimizing disruptions and ensures consistent output from upstream and downstream operations. Predictive analytics supports proactive maintenance, reducing equipment failure and costly delays. It is enabling enterprises to manage fluctuating demand and enhance efficiency across large-scale operations. Growing complexity of oilfield environments makes digital insights critical for success. The increasing reliance on data-driven solutions accelerates adoption across global operators.
- For instance, Schlumberger’s Real-Time Acquisition and Control (RTAC) system integrates permanent downhole pressure and temperature gauges with surface intelligent completion equipment, enabling operators to monitor and control downhole tools in real time.
Growing Adoption of Predictive Maintenance and Asset Reliability Solutions
Analytics plays a vital role in improving asset performance through predictive maintenance solutions. The Oil And Gas Analytics Market experiences growth from the shift toward reducing unplanned outages and extending equipment lifecycle. Predictive models analyze machine behavior to anticipate failures before they occur. It improves reliability while lowering operational expenses and replacement costs. Operators focus on asset health monitoring to ensure compliance with safety standards. Data-driven predictive maintenance offers measurable benefits in terms of performance stability and workforce safety. This trend reduces costly downtime across drilling, transportation, and refining activities. The ability to foresee and mitigate risks enhances operational confidence.
- For instance, Aker Solutions installed an autonomous drone system on Aker BP’s Edvard Grieg platform in the North Sea, enabling frequent remote inspections from shore via an onshore control center. This innovative operation, which includes autonomous navigation and advanced sensors, reduces inspection costs by up to 70% and accelerates the detection of wear or corrosion,facilitating timely maintenance before failures occur.
Increasing Integration of Artificial Intelligence and Machine Learning in Analytics
The use of artificial intelligence and machine learning strengthens the analytical capabilities of oil and gas operators. The Oil And Gas Analytics Market grows as companies adopt AI-driven models for reservoir simulation, seismic interpretation, and production forecasting. Intelligent algorithms provide accurate insights into exploration data and operational metrics. It empowers operators to make informed investment and drilling decisions. AI enhances automation, enabling faster analysis of complex datasets. The integration of smart analytics improves resource allocation and reduces human error. Energy companies invest in AI systems to remain competitive in volatile markets. This integration creates opportunities for predictive and prescriptive analytics solutions.
Rising Demand for Transparency, Compliance, and Sustainable Practices in Operations
Global energy players adopt analytics to meet stringent regulatory requirements and sustainability goals. The Oil And Gas Analytics Market benefits from increased focus on emissions tracking, resource efficiency, and transparent reporting. Data-driven insights help companies align with environmental standards and investor expectations. It also enhances operational visibility, enabling accurate reporting on performance and compliance. Analytics supports energy transition strategies by optimizing processes with reduced environmental impact. Companies use digital tools to balance profitability with sustainability initiatives. Transparency builds stakeholder confidence and improves corporate accountability. Rising global pressure for cleaner energy accelerates the shift toward data-enabled compliance frameworks.
Market Trends:
Growing Implementation of Cloud-Based Analytics Platforms for Scalability and Flexibility
Oil companies increasingly shift toward cloud-based platforms to manage complex datasets with greater flexibility. The Oil and Gas Analytics Market observes a rising preference for cloud solutions that enable cost efficiency and faster deployment. Cloud technology enhances collaboration across geographically dispersed teams. It supports real-time data access for improved operational decision-making. Enterprises value the scalability of cloud models, which adjust resources according to demand. Cloud analytics also reduces dependency on physical infrastructure and improves accessibility. The integration of hybrid and multi-cloud models strengthens security and performance. Adoption continues to expand as firms prioritize agile solutions in dynamic markets.
- For instance, Shell has developed a Monitoring Data Foundation that integrates real-time data streams with flexible interfaces, leading to an increase in data consumption from gigabytes to terabytes, while reducing processing costs sustainably across their operations. This approach has simplified proactive monitoring and phased out legacy IT tools, achieving significant operational cost savings.
Increasing Role of Digital Twins and Virtual Modeling in Energy Operations
Virtual modeling through digital twins is becoming a transformative trend across the sector. The Oil And Gas Analytics Market gains momentum as operators use digital replicas of assets and processes. Digital twins provide real-time performance tracking, enabling simulations and predictive analysis. It allows companies to identify inefficiencies and test scenarios before implementing changes. Virtual models enhance operational safety by simulating equipment performance under extreme conditions. Energy operators integrate digital twins with IoT platforms for stronger insights. The trend helps reduce risks in exploration and refining projects. Global adoption is expanding as firms recognize the value of proactive planning.
- For instance, BP employs the APEX system, a highly-sophisticated digital twin technology, across its North Sea operations and globally. APEX enables rapid production optimization by simulating thousands of production scenarios, improving operational efficiency and safety, while supporting an additional 30,000 barrels of oil and gas production at their Gulf of Mexico Argos platform
Rising Focus on Cybersecurity Analytics to Safeguard Energy Infrastructure
Growing digitalization increases the risk of cyber threats within critical oil and gas infrastructure. The Oil and Gas Analytics Market witnesses rising investment in cybersecurity analytics solutions. Companies deploy tools to detect anomalies, prevent breaches, and protect sensitive operational data. It supports uninterrupted production while ensuring compliance with strict security standards. Predictive security analytics helps in identifying vulnerabilities before exploitation. Energy companies prioritize safeguarding supervisory control and data acquisition (SCADA) systems. The focus on cyber resilience strengthens the trust of regulators and stakeholders. Cybersecurity analytics has become a core component of long-term digital strategies across the industry.
Expanding Utilization of Edge Analytics for Faster Decision-Making in Remote Operations
The need for real-time analysis in remote oilfields fuels the growth of edge analytics. The Oil and Gas Analytics Market benefits from the shift toward processing data at the source. Edge analytics enables faster decision-making without relying on central systems. It ensures operational continuity in offshore platforms and isolated drilling sites. The approach improves efficiency in bandwidth-limited environments. It reduces latency by delivering instant insights into safety, production, and equipment performance. Operators rely on edge solutions for mission-critical applications. Expanding deployments across remote and harsh locations accelerate adoption of edge-enabled analytics platforms.
Market Challenges Analysis:
Data Integration Complexities and Limited Interoperability Across Platforms
The Oil And Gas Analytics Market faces challenges due to fragmented data sources and diverse technology systems. Companies struggle to integrate legacy systems with advanced analytics platforms. It often leads to data silos and limited visibility across upstream, midstream, and downstream activities. Inconsistent data formats complicate analysis and reduce the accuracy of insights. Operators face higher costs and delays in system integration efforts. The lack of interoperability across solutions hinders collaboration between vendors and enterprises. Managing data from multiple sources requires significant expertise and resources. This complexity remains a major obstacle for smooth adoption of analytics solutions.
High Capital Costs, Skills Shortage, and Organizational Resistance
High initial investments in analytics infrastructure create barriers for small and medium enterprises. The Oil And Gas Analytics Market encounters difficulties due to limited budgets and long return cycles. Workforce shortages in data science and analytics expertise further slow adoption. It becomes challenging to align existing staff with advanced technologies. Resistance to cultural change within organizations limits the effectiveness of analytics-driven transformation. Concerns about data security and privacy also discourage adoption. The high cost of training and development programs adds to operational strain. These challenges continue to delay full-scale integration across many industry players.
Market Opportunities:
Expanding Role of Analytics in Supporting Energy Transition and Sustainability Initiatives
The Oil And Gas Analytics Market is well positioned to support energy transition strategies. Companies leverage analytics to optimize renewable energy integration, emissions reduction, and carbon reporting. It allows firms to track sustainability metrics while maintaining operational profitability. Analytics tools provide insights for balancing traditional oil production with cleaner alternatives. Operators explore opportunities to improve water management, waste reduction, and resource efficiency. The emphasis on sustainable operations opens doors for advanced analytics applications. Stakeholders increasingly prioritize investments in eco-friendly analytics platforms. Rising pressure for environmental responsibility creates long-term growth opportunities across global markets.
Increasing Growth Potential from Emerging Markets and Digital Infrastructure Expansion
Rapid industrialization and rising energy demand across developing economies create significant opportunities. The Oil And Gas Analytics Market gains momentum in regions modernizing their energy infrastructure. Expanding digital connectivity supports wider adoption of advanced analytics solutions. It helps operators improve exploration success rates and optimize refining capacity. Governments in emerging economies encourage digitalization in oil and gas projects. Enterprises recognize the potential of analytics for cost savings and safety improvements. Infrastructure expansion in Asia-Pacific, the Middle East, and Latin America provides growth prospects. The ability to deliver scalable, adaptable solutions positions analytics providers for strong regional expansion.
Market Segmentation Analysis:
The Oil And Gas Analytics Market demonstrates strong growth potential across multiple segments, driven by increasing digital adoption.
By offering, software holds the largest share due to the demand for advanced analytics platforms, while services including integration and maintenance continue to expand with rising deployment needs. Hardware adoption remains steady, supporting sensors and connected devices across exploration and refining operations.
By deployment mode, cloud-based solutions are gaining prominence for scalability and cost efficiency, while on-premise systems remain relevant for enterprises prioritizing data control and security.
- For instance, cloud4C highlights how cloud-managed services in oil and gas optimize IT operations by replacing on-premise infrastructure with scalable, energy-efficient cloud platforms. Cloud adoption enhances operational agility while reducing carbon footprint by up to 88%, and power consumption by 84%, according to recent IDC reports
By application, upstream operations dominate adoption, with analytics improving exploration accuracy, drilling performance, and reservoir engineering. Midstream use is expanding through pipeline management, logistics, and storage optimization. Downstream operations apply analytics to pricing strategies, demand forecasting, refinery performance, and distribution efficiency.
By end-user, large enterprises lead adoption due to significant budgets and infrastructure investments, while small and medium enterprises increasingly embrace cloud solutions to gain competitive advantages.
By industry verticals, oil and crude oil segments represent the largest share, with petrochemical and chemical industries adopting analytics to enhance efficiency and compliance. Gas industry adoption is strengthening through applications in natural gas and LNG operations, while oilfield services utilize analytics for performance improvement and asset monitoring. Renewables emerge as a growing vertical, reflecting diversification strategies and the integration of cleaner energy. The segmentation highlights how it continues to expand across value chains, aligning with evolving digital strategies and operational requirements within the global energy sector.
- For instance, ICIS provides advanced LNG market analytics and live tracking of over 700 LNG cargo vessels globally, helping stakeholders make data-driven decisions that address pricing, logistics, and supply chain optimization in the natural gas sector.
Segmentation:
By Offering
- Hardware
- Software
- Services
By Deployment Mode
By Application
- Upstream (Exploration, Drilling, Reservoir Engineering, Seismic Data Management)
- Midstream (Transport and Logistics, Pipeline Management, Storage Optimization)
- Downstream (Pricing Analytics, Demand Forecasting, Refinery Management, Distribution Management, Asset Management)
By End-User
- Small & Medium Enterprises
- Large Enterprises
By Industry Verticals
- Oil Industry
- Crude Oil
- Petrochemical
- Chemical
- Gas Industry
- Natural Gas
- Oilfield Services
- Renewables
By Region
- North America
- Europe
- UK
- France
- Germany
- Italy
- Spain
- Russia
- Belgium
- Netherlands
- Austria
- Sweden
- Poland
- Denmark
- Switzerland
- Rest of Europe
- Asia Pacific
- China
- Japan
- South Korea
- India
- Australia
- Thailand
- Indonesia
- Vietnam
- Malaysia
- Philippines
- Taiwan
- Rest of Asia Pacific
- Latin America
- Brazil
- Argentina
- Peru
- Chile
- Colombia
- Rest of Latin America
- Middle East
- UAE
- KSA
- Israel
- Turkey
- Iran
- Rest of Middle East
- Africa
- Egypt
- Nigeria
- Algeria
- Morocco
- Rest of Africa
Regional Analysis:
North America holds the largest share of the Oil And Gas Analytics Market, accounting for 36% of the global revenue. Strong adoption of advanced technologies across upstream, midstream, and downstream sectors drives regional dominance. Leading oilfield operators and service providers deploy analytics to improve asset performance, reduce downtime, and meet stringent safety regulations. The presence of major technology vendors and strong digital infrastructure further strengthens adoption. It also benefits from regulatory emphasis on sustainability and efficiency, which pushes operators toward digital solutions. Shale oil and gas exploration in the U.S. continues to create demand for predictive and real-time analytics platforms.
Europe captures 27% of the market, supported by growing focus on clean energy transition and operational transparency. Oil and gas companies in the region integrate analytics to optimize refining processes and manage emissions effectively. Strong emphasis on compliance with environmental regulations fuels investment in digital solutions. The presence of established players in Norway, the U.K., and Germany enhances regional market maturity. It gains further traction from government-backed sustainability programs that encourage innovation. Europe’s offshore exploration projects also stimulate demand for predictive analytics and risk management tools.
Asia-Pacific accounts for 22% of the market and demonstrates the fastest growth rate. Rapid industrialization, increasing energy consumption, and large-scale exploration projects drive analytics adoption in China, India, and Australia. National oil companies invest heavily in digital transformation to optimize production and manage growing demand. It also benefits from expansion of refining capacity and midstream infrastructure across the region. Rising investments in LNG projects and integration of AI-driven solutions strengthen regional momentum. The Middle East and Africa together hold 10%, while South America captures 5%, reflecting emerging adoption driven by modernization of energy infrastructure.
Shape Your Report to Specific Countries or Regions & Enjoy 30% Off!
Key Player Analysis:
- Schlumberger (SLB)
- Halliburton
- Baker Hughes
- Palantir Technologies
- TIBCO Software
- Wipro
- Informatica
- Aspen Technology (AspenTech)
- Kongsberg Digital
- AVEVA Group
- Microsoft Corporation
- Oracle Corporation
- IBM Corporation
- SAP SE
- Tableau Software (Salesforce)
Competitive Analysis:
The Oil and Gas Analytics Market is highly competitive, with global technology providers and specialized service firms driving innovation. Leading players focus on offering advanced software platforms, predictive analytics, and AI-powered solutions to strengthen operational efficiency across exploration, production, and refining. It is characterized by continuous investment in cloud-based services, cybersecurity tools, and edge analytics to meet rising demand for real-time decision-making. Partnerships and acquisitions are common strategies, enabling companies to expand geographic reach and enhance solution portfolios. Established players compete by integrating digital twins, machine learning, and risk management features into their offerings. Regional firms also gain traction by delivering cost-effective and industry-specific analytics solutions. Competitive intensity remains high, with differentiation centered on scalability, customization, and strong technical support. The market outlook suggests that innovation and collaboration will define leadership positions across the evolving digital energy landscape.
Recent Developments:
- In July 2025, SLB (Schlumberger) launched the OnWave Autonomous Logging Platform, a cable-free technology designed to streamline well logging, accelerate data acquisition, and assure more reliable analytics-driven workflows for oil and gas exploration and production. The platform enables efficient formation evaluation and integrates seamlessly into E&P digital workflows, reducing deployment time and operational risk
- In January 2024, SLB (Schlumberger) and Nabors introduced new automated drilling solutions designed for oil and gas operators. This launch focuses on drilling automation applications and rig operating systems, aiming to deliver heightened efficiency and improved operating margins in field operations.
- In July 2024, Halliburton entered a global partnership with AIQ to integrate the RoboWell Autonomous Well Control (AWC) platform into its Landmark iEnergy hybrid cloud ecosystem. This AI-driven platform optimizes gas-lift control and boosts both efficiency and production of existing wells using advanced process control, positioning Halliburton as a leader in autonomous data analytics for well management.
- In September 2023, Datagration and Origem Energia formed a partnership to integrate advanced analytics, machine learning, and artificial intelligence in the Brazilian oil and gas industry. Additionally, in May 2023, Essar Oil and Gas Exploration and Production Ltd partnered with Sensia to drive digitalization of oil and gas field operations using analytics platforms tailored for operational optimization.
Report Coverage:
The research report offers an in-depth analysis based on Offering, Deployment Mode, Application, End-User and Industry Verticals. It details leading market players, providing an overview of their business, product offerings, investments, revenue streams, and key applications. Additionally, the report includes insights into the competitive environment, SWOT analysis, current market trends, as well as the primary drivers and constraints. Furthermore, it discusses various factors that have driven market expansion in recent years. The report also explores market dynamics, regulatory scenarios, and technological advancements that are shaping the industry. It assesses the impact of external factors and global economic changes on market growth. Lastly, it provides strategic recommendations for new entrants and established companies to navigate the complexities of the market.
Future Outlook:
- The Oil and Gas Analytics Market will advance with increased adoption of AI-powered predictive tools that optimize performance and reduce risks.
- Real-time analytics will become central to managing exploration, production, and refining activities with higher efficiency.
- The growing use of digital twins will provide accurate simulations and enable operators to make confident decisions in critical projects.
- Cloud-based solutions will expand further, offering scalable deployments that enhance collaboration across geographically distributed teams.
- Edge analytics will gain momentum by supporting faster decisions in offshore fields and remote drilling sites.
- Cybersecurity-focused analytics will strengthen defenses, ensuring protection of vital energy infrastructure against rising digital threats.
- Sustainability-driven analytics will grow, enabling companies to track emissions, reduce waste, and align with global environmental standards.
- National oil companies in Asia-Pacific, the Middle East, and Latin America will accelerate digital adoption to modernize infrastructure.
- Partnerships between leading technology providers and oil majors will create integrated solutions, driving innovation across the sector.
- Advances in machine learning and cognitive computing will set new performance benchmarks, reshaping operations and improving competitiveness across global markets.


