
Oral Macromolecular Formulation Market Overview:
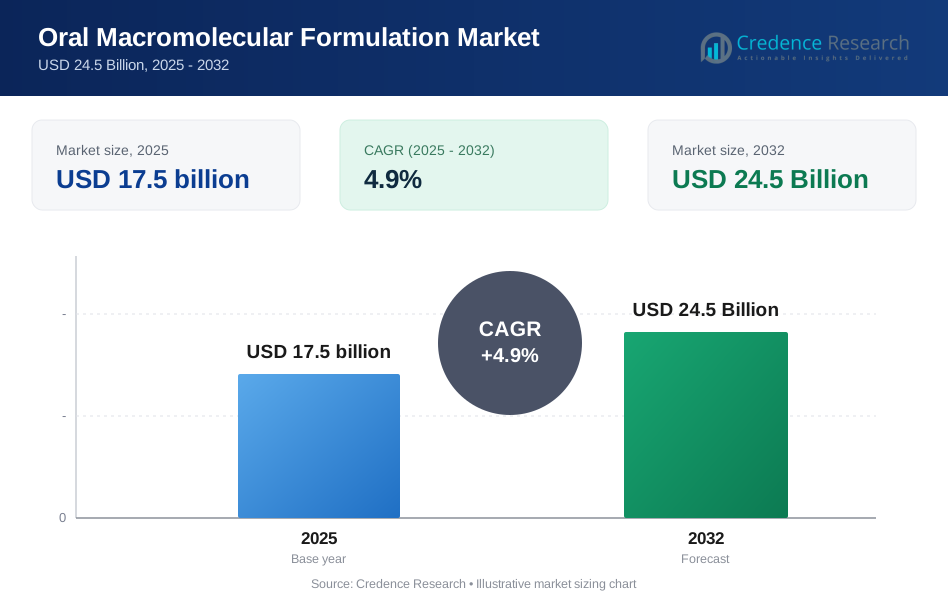
The Oral Macromolecular Formulation market size was valued at USD 17.5 Billion in 2025 and is projected to reach USD 24.5 Billion by 2032, reflecting a CAGR of 4.9% during the forecast period.
| REPORT ATTRIBUTE | DETAILS |
|---|---|
| Historical Period | 2020-2025 |
| Base Year | 2025 |
| Forecast Period | 2026-2032 |
| Oral Macromolecular Formulation Market Size 2024 | USD 17.5 billion |
| Oral Macromolecular Formulation Market, CAGR | 4.9% |
| Oral Macromolecular Formulation Market Size 2032 | USD 24.5 billion |
Oral Macromolecular Formulation Market Insights
- Demand rises as oral delivery offers better patient comfort and stronger treatment adherence, supported by high use of proteins, which lead the molecule type segment with a 46% share.
- Technology innovation drives market trends, with nanoparticle-based delivery leading the technology segment at 49% due to improved stability, encapsulation, and bioavailability.
- Leading companies enhance competitive strength through formulation research, delivery platform partnerships, and biologic conversion projects, while low oral bioavailability and development cost challenges act as major restraints.
- North America leads regional demand with a 41% share, followed by Europe at 32% and Asia Pacific at 21%, supported by strong clinical pipelines, expanding funding, and increasing chronic disease treatment needs.
Oral Macromolecular Formulation Market Segmentation Analysis:
By Molecule Type
Proteins lead the molecule type segment with a 46% share, driven by strong research activity in oral biologics and increasing demand for non-invasive delivery options. Development focuses on stabilising protein structures to improve absorption and protect against gastrointestinal degradation. Peptides show steady growth in metabolic and hormonal therapies. Nucleic acids gain attention through advancements in oral RNA and DNA technologies, while polysaccharides remain used mainly in targeted delivery research. The dominance of proteins reflects expanded clinical interest in replacing injectable formats with more patient-friendly oral alternatives.
- For instance, Novo Nordisk completed a Phase 3 study evaluating oral semaglutide in a 14 mg tablet, enrolling 1,606 patients to validate therapeutic performance.
By Technology
Nanoparticle-based delivery dominates the technology segment with a 49% share, supported by strong uptake in controlled release and targeted delivery research. Lipid-based systems follow due to improved bioavailability and compatibility with sensitive macromolecules. Enteric coating remains essential for acid protection, enabling safe passage through the stomach. Enzyme inhibitor systems support enhanced absorption and stability across therapeutic areas. The rise of nanoparticles reflects clear benefits in encapsulation efficiency, structural preservation, and improved delivery outcomes, driving clinical and commercial progress.
- For instance, Rani Therapeutics demonstrated oral biologic delivery using RaniPill capsules containing 3 mg payloads during clinical evaluation.
By Application
Metabolic disorders hold a 52% share of the application segment, driven by high prevalence and strong therapeutic need for oral biologic alternatives. Oral insulin, GLP-1 therapies, and related metabolic treatments drive pipeline investment. Oncology applications expand through research into oral chemotherapeutic and immunotherapy delivery. Autoimmune diseases show interest in biologic reformulation, while gastrointestinal disorders benefit from targeted local delivery. The metabolic disorders segment leads due to large patient populations and clear advantages over injections, supporting increased research funding and clinical development.
Key Growth Drivers
Rising Demand for Non-Invasive Drug Delivery
Growing preference for oral medication over injectable formats drives strong progress in oral macromolecular formulations. Patients benefit from improved comfort, reduced administration complexity, and fewer clinical visits. These advantages support better treatment adherence, especially for long-term therapies. Drug developers focus on converting injectable biologics into effective oral formats for conditions such as diabetes and autoimmune disorders. Advances in formulation chemistry strengthen stability and absorption, supporting commercial momentum. This shift improves patient experience and opens broader market access.
- For instance, Eli Lilly advanced oral GLP-1 therapy research using orforglipron, which showed measurable exposure across multiple subjects during clinical testing.
Advancements in Delivery Technologies and Nanocarriers
Technology enhancements significantly improve oral delivery potential for large molecules. Nanoparticles, lipid carriers, and polymer systems protect macromolecules against digestive breakdown, enabling higher absorption through the gastrointestinal tract. These platforms enhance bioavailability, support controlled release, and improve structural integrity. Ongoing research increases encapsulation efficiency and enables precision targeting, strengthening therapeutic outcomes. Strong interest from pharma companies accelerates pipeline expansion and technology licensing. These developments create clear competitive advantages across metabolic, oncology, and autoimmune applications.
- For instance, Enteris BioPharma applied Peptelligence technology to an oral formulation of salmon calcitonin to enhance its absorption and bioavailability.
Increasing Focus on Metabolic and Chronic Disease Treatment
Rising prevalence of metabolic disorders strengthens demand for oral biologic treatment options. Oral insulin and GLP-1 therapies demonstrate strong clinical and commercial potential due to improved adherence and reduced discomfort compared to injection-based regimens. Chronic disease management benefits from easier dosing, patient independence, and long-term compliance. Growing research investment accelerates clinical progress and enhances delivery effectiveness. These opportunities support expanding product pipelines and sustained market growth.
Key Trends & Opportunities
Expansion in Oral Biologic Pipelines and Collaboration Models
The oral biologics pipeline continues to expand as pharmaceutical companies pursue collaborative research and licensing partnerships. These alliances combine expertise in formulation science, delivery systems, and regulatory planning. Development focuses on oral versions of existing injectable biologics, including metabolic and oncologic therapies. Increased clinical activity strengthens investor confidence and accelerates market entry timelines. This collaborative trend supports broader therapeutic access and long-term commercial scalability.
- For instance, Oramed partnered with Hefei Tianhui Biotech to advance oral insulin programs, progressing ORMD-0801 through a study involving 710 participants to support clinical validation.
Growth in Precision Formulation and Personalised Medicine
Precision medicine creates new opportunities for targeted oral macromolecular delivery. Formulation strategies increasingly align with individual patient needs, improving dosing accuracy, absorption performance, and therapeutic outcomes. Advances in biomarkers, genetic profiling, and patient monitoring enhance customisation potential. These technologies support specialised therapies across metabolic, autoimmune, and gastrointestinal disorders. As platforms mature, personalised oral biologics are expected to expand into new clinical areas, strengthening market relevance.
- For instance, Chiasma evaluated oral octreotide capsules in a Phase 3 trial involving 155 patients to support personalised dosing outcomes in acromegaly treatment.
Key Challenges
Low Bioavailability and Physiological Barriers
Achieving reliable absorption of macromolecules remains a major scientific challenge. The gastrointestinal tract exposes molecules to enzymatic degradation, pH variation, and limited permeability. These conditions reduce bioavailability and demand complex protective technologies. Formulation success requires balancing stability, release control, and absorption enhancement. Overcoming these biological barriers increases development time and scientific risk.
High Development Costs and Regulatory Complexity
Developing oral biologics requires extensive clinical validation, high investment, and robust safety testing. Regulatory expectations demand strong evidence of efficacy, stability, and long-term safety, increasing trial duration and cost. Manufacturing standards add further complexity as production must ensure consistent molecule integrity. These challenges raise entry barriers and influence commercial decision-making.
Regional Analysis
North America
North America holds a 41% share of the oral macromolecular formulation market, driven by strong R&D investment, advanced clinical infrastructure, and high biologics adoption. The United States leads development activity with active clinical pipelines in metabolic and autoimmune therapies. Regulatory support for breakthrough drug delivery technologies enhances development timelines. Collaboration between research institutes and pharmaceutical companies strengthens innovation, while patient preference for oral alternatives encourages long-term commercial potential. Growing healthcare spending and chronic disease prevalence support ongoing market expansion.
Europe
Europe accounts for a 32% share of the market, supported by strong pharmaceutical research networks and growing interest in oral biologics. Germany, the United Kingdom, and France lead development due to mature biologics markets and strong funding access. Increasing focus on personalised medicine enhances demand for targeted oral delivery platforms. Regulatory initiatives support technological advancement and product safety. The region continues to expand clinical activity in metabolic, gastrointestinal, and autoimmune disease areas, supported by strong collaboration between industry and academic research groups.
Asia Pacific
Asia Pacific holds a 21% share of the market, driven by rising demand for advanced biologic therapies and growing investment in drug delivery research. China, Japan, and India expand development activity through public and private funding. Increasing chronic disease prevalence accelerates demand for oral treatment alternatives. Local manufacturing capability supports cost efficiency and technology access, enhancing long-term growth. Regional institutions explore nanoparticle and lipid-based delivery systems to address gastrointestinal absorption challenges. Rising healthcare infrastructure and digital clinical platforms contribute to broader adoption.
Latin America
Latin America represents a 4% share of the market, supported by moderate biologic therapy adoption and expanding pharmaceutical research interest. Brazil and Mexico lead regional participation through partnerships with global drug developers. Chronic disease patterns support interest in long-term oral treatment options. Limited clinical infrastructure and funding constraints slow large-scale development, but wider technology transfer opportunities are emerging. Market growth aligns with healthcare system upgrades and broader biologics accessibility across urban populations.
Middle East & Africa
Middle East and Africa hold a 2% share, reflecting early-stage market development and limited access to advanced biologics. Regional interest grows in metabolic and autoimmune treatments, supported by rising healthcare investment in Gulf countries. Partnerships with international research organizations improve technology exposure and scientific capability. Clinical adoption remains gradual due to cost constraints and infrastructure gaps. Market progression aligns with increasing demand for innovative therapies and improved patient outcomes.
Oral Macromolecular Formulation Market Segmentations:
By Molecule Type
- Proteins
- Peptides
- Nucleic Acids
- Polysaccharides
By Technology
- Nanoparticle-Based Delivery
- Lipid-Based Delivery
- Enteric Coating
- Enzyme Inhibitor Systems
By Application
- Metabolic Disorders
- Oncology
- Autoimmune Diseases
- Gastrointestinal Disorders
By End User
- Hospitals
- Specialty Clinics
- Research Centers
- Academic Institutes
By Geography
- North America
- U.S.
- Canada
- Mexico
- Europe
- Germany
- France
- U.K.
- Italy
- Spain
- Rest of Europe
- Asia Pacific
- China
- Japan
- India
- South Korea
- South-east Asia
- Rest of Asia Pacific
- Latin America
- Brazil
- Argentina
- Rest of Latin America
- Middle East & Africa
- GCC Countries
- South Africa
- Rest of the Middle East and Africa
Competitive Landscape
Competitive landscape analysis highlights key players including Novo Nordisk, Eli Lilly and Company, Biocon Ltd., Oramed Pharmaceuticals Inc., Enteris BioPharma Inc., Chiasma Inc., Proxima Concepts Ltd., Rani Therapeutics, Emisphere Technologies, and Avacta Group Plc. The market remains research-driven, with companies focusing on oral biologic development, delivery optimisation, and clinical validation across metabolic, autoimmune, and gastrointestinal disorders. Strategic priorities include enhancing bioavailability, improving molecular stability, and overcoming gastrointestinal absorption barriers. Partnerships between pharma companies and technology developers strengthen pipeline progress and support access to advanced delivery platforms. Clinical collaboration and licensing agreements accelerate innovation and reduce development timelines. Competition also centers on intellectual property strength, formulation expertise, and regulatory progression. Companies invest in nanoparticle, lipid, and enzyme-inhibiting systems to differentiate performance. As demand for non-invasive therapeutics grows, manufacturers position oral macromolecular delivery as a long-term alternative to injectable treatments, shaping future market expansion.
Key Player Analysis
- Novo Nordisk
- Eli Lilly and Company
- Biocon Ltd.
- Oramed Pharmaceuticals Inc.
- Enteris BioPharma Inc.
- Chiasma Inc.
- Proxima Concepts Ltd.
- Rani Therapeutics
- Emisphere Technologies
- Avacta Group Plc
Recent Developments
- In October 2025, Novo Nordisk received FDA approval for oral semaglutide 14 mg (Rybelsus) tablets to reduce major adverse cardiovascular events in high-risk adults with type 2 diabetes, confirming the GLP-1 tablet as a flagship oral macromolecular formulation.
- In April 2025, Biocon Ltd. published multiple-ascending-dose clinical data for oral insulin tregopil, demonstrating rapid onset of action and strong one-hour post-prandial glucose control in type 1 diabetes patients, but the study concluded that the fixed-dose formulation was not a viable stand-alone option for daily management of T1DM.
- In May 2024, Rani Therapeutics presented clinical and preclinical data at Digestive Disease Week showing that its RaniPill robotic capsule safely delivered an ustekinumab biosimilar (RT-111) with high bioavailability, advancing a device-based oral system for injectable-grade macromolecular biologics.
Report Coverage
The research report offers an in-depth analysis based on Molecule Type, Technology, Application, End User and Geography. It details leading market players, providing an overview of their business, product offerings, investments, revenue streams, and key applications. Additionally, the report includes insights into the competitive environment, SWOT analysis, current market trends, as well as the primary drivers and constraints. Furthermore, it discusses various factors that have driven market expansion in recent years. The report also explores market dynamics, regulatory scenarios, and technological advancements that are shaping the industry. It assesses the impact of external factors and global economic changes on market growth. Lastly, it provides strategic recommendations for new entrants and established companies to navigate the complexities of the market.
Future Outlook
- Demand for oral biologic alternatives will continue to grow across chronic therapies.
- Protein and peptide development pipelines will expand as absorption technologies improve.
- Nanoparticle and lipid delivery platforms will gain wider clinical adoption.
- Partnerships between pharma companies and delivery innovators will accelerate product launches.
- Personalised dosing and precision formulation will strengthen treatment outcomes.
- Clinical focus will broaden beyond metabolic disorders to oncology and autoimmune care.
- Regulatory guidance for oral biologics will evolve toward clearer approval pathways.
- Manufacturing innovation will enhance stability, scalability, and cost efficiency.
- Research investment will increase as oral delivery replaces select injectable formats.
- Long-term commercial success will depend on overcoming bioavailability and stability barriers.
Request a Free Sample
Fill in your details and we'll send you a free sample report.
- Sample data tables & charts
- Research methodology
Need a Custom Version of This Report?
Tailor the scope, geography, or segments to your exact requirements.
- Custom geography or segment scope
- Direct access to our analyst team
Frequently Asked Questions
What is the current market size for Oral Macromolecular Formulation market, and what is its projected size in 2032?
At what Compound Annual Growth Rate is the Oral Macromolecular Formulation market projected to grow between 2024 and 2032?
Which Oral Macromolecular Formulation market segment held the largest share in 2024?
What are the primary factors fueling the growth of the Oral Macromolecular Formulation market?
Who are the leading companies in the Oral Macromolecular Formulation market?
Which region commanded the largest share of the Oral Macromolecular Formulation market in 2024?
Table of Content
Chapter 1. Report Introduction
- 1.1 Report Description & Purpose
- 1.1.1 Report Title & Market Definition
- 1.1.2 Unique Selling Propositions (USP) & Key Differentiators
- 1.1.3 Value Proposition for Stakeholders
- 1.2 Research Objectives
- 1.2.1 Market Sizing Objectives (Volume & Revenue)
- 1.2.2 Segmentation Objectives
- 1.2.3 Competitive Intelligence Objectives
- 1.2.4 Forecast & Scenario Objectives
- 1.3 Report Scope
- 1.3.1 Oral Macromolecular Formulation Scope – Types & Subtypes Covered
- 1.3.2 Geographic Scope – Regions & Countries Covered
- 1.3.3 Historical Period, Base Year & Forecast Period (2025; forecast to 2032)
- 1.3.4 Inclusions & Exclusions
- 1.4 HS Code & Classification Framework
- 1.5 Currency, Units & Pricing Basis
- 1.6 Target Stakeholders
- 1.7 Limitations & Assumptions
Chapter 2. Executive Summary
- 2.1 Global Oral Macromolecular Formulation Market Snapshot
- 2.1.1 Market Size – Historical (2025) & Forecast (2025-2032) (2025: USD 17.5 billion → 2032: USD 24.5 Billion)
- 2.1.2 Volume & Revenue – Global Totals
- 2.1.3 Key Market Highlights – Top Five Facts
- 2.2 Oral Macromolecular Formulation Market Segmentation Snapshot
- 2.2.1 Market Split by Region – 2025 vs. 2032
- 2.3 Competitive Snapshot
- 2.3.1 Top 10 Players by Revenue Share – 2025
- 2.3.2 Top 10 Players by Volume Share – 2025
- 2.3.3 Recent Strategic Developments (18-Month Summary)
- 2.4 Key Investment Highlights & Strategic Conclusions
Chapter 3. Oral Macromolecular Formulation Market Dynamics & Industry Analysis
- 3.1 Market Overview & Context
- 3.1.1 Oral Macromolecular Formulation Market Position in the Broader Automotive Value Chain
- 3.1.2 OEM vs. Replacement Market Dynamics
- 3.1.3 Market Maturity & Development Stage by Region
- 3.2 Oral Macromolecular Formulation Market Drivers
- 3.3 Oral Macromolecular Formulation Market Restraints & Challenges
- 3.4 Oral Macromolecular Formulation Market Opportunities
- 3.5 Porter's Five Forces Analysis
- 3.5.1 Threat of New Entrants
- 3.5.2 Bargaining Power of Suppliers
- 3.5.3 Bargaining Power of Buyers
- 3.5.4 Threat of Substitutes
- 3.5.5 Competitive Rivalry – Intensity Assessment
- 3.6 Oral Macromolecular Formulation Value Chain Analysis
- 3.6.1 Upstream – Raw Material/Input Suppliers
- 3.6.1.1 Raw Material/Input 1
- 3.6.1.2 Raw Material/Input 2
- 3.6.1.3 Raw Material/Input 3
- 3.6.2 Midstream – Production/Manufacturing/Service Delivery
- 3.6.2.1 Production/Process Overview
- 3.6.2.2 Key Facility Locations & Capacity by Manufacturer
- 3.6.3 Downstream – Distribution & End Consumer
- 3.6.3.1 Primary Channel – B2B/OEM
- 3.6.3.2 Secondary Channels – Dealer, Retail, Online, Direct
- 3.6.4 Value Chain Profitability Analysis
- 3.6.1 Upstream – Raw Material/Input Suppliers
- 3.7 PESTEL Analysis
- 3.7.1 Political Factors
- 3.7.2 Economic Factors
- 3.7.3 Social Factors
- 3.7.4 Technological Factors
- 3.7.5 Environmental Factors
- 3.7.6 Legal Factors
- 3.8 Oral Macromolecular Formulation Supply Chain Analysis
- 3.8.1 Raw Material/Input Supply Risk Assessment
- 3.8.2 Manufacturing Concentration Risk (Geographic Exposure)
- 3.8.3 Trade Disruption Impact Analysis
- 3.9 Regulatory & Policy Landscape
Note: The regulatory and policy landscape section covers regulations based on their applicability to the market, Oral Macromolecular Formulation category, geography, and scope of the study. Only regulatory frameworks with a material impact on operations, compliance, trade, sustainability, or market access are analyzed in detail.
Chapter 4. Key Investment Pockets & Opportunity Analysis
- 4.1 Oral Macromolecular Formulation Market Attractiveness Analysis
- 4.1.1 By Region – Investment Attractiveness Matrix (Volume × CAGR)
- 4.2 Absolute Revenue Growth Opportunity
- 4.2.1 By Region – Absolute USD Growth Through 2032
- 4.3 Incremental Volume Opportunity
- 4.3.1 By Region – Incremental Volume Through 2032
- 4.3.2 Segment – Incremental Volume
- 4.4 Emerging Submarket Opportunity Deep Dive (Subject to Applicability)
- 4.5 Emerging Market Opportunity Scorecards
- 4.5.1 United States
- 4.5.2 Europe
- 4.5.3 Asia
- 4.5.4 Middle East & Africa
Note: Emerging Market Opportunity Scorecards will be included based on relevance and strategic importance. Regions listed are indicative and may vary depending on data availability and market dynamics.
Chapter 5. Oral Macromolecular Formulation Import-Export Analysis & Trade Flows
- 5.1 Global Trade Overview
- 5.1.1 Global Export Value by Country (2025)
- 5.1.2 Global Export Volume by Country (2025)
- 5.1.3 Global Import Value by Country (2025)
- 5.1.4 Global Import Volume by Country (2025)
- 5.1.5 Net Trade Balance by Country (2025)
- 5.2 Export Analysis – Segment
- 5.2.1 Type 1 (HS Code)
- 5.2.2 Type 2 (HS Code)
- 5.2.3 Type 3 (HS Code)
- 5.2.4 Type 4 (HS Code)
- 5.2.5 Type 5 (HS Code)
- 5.3 Import Analysis – Segment
- 5.3.1 Type 1 (HS Code)
- 5.3.2 Type 2 (HS Code)
- 5.3.3 Type 3 (HS Code)
- 5.3.4 Type 4 (HS Code)
- 5.3.5 Type 5 (HS Code)
- 5.4 Average Unit Trade Prices
- 5.4.1 Average Export Price – Segment & Country
- 5.4.2 Average Import Price – Segment & Source Country
- 5.4.3 Price Trends (2025)
- 5.5 Key Trade Route Analysis
- 5.5.1 Trade Route 1
- 5.5.2 Trade Route 2
- 5.5.3 Trade Route 3
- 5.5.4 Trade Route 4
- 5.5.5 Trade Route 5
- 5.6 Trade Policy Impact Assessment
- 5.6.1 US Anti-Dumping & Section 301 Tariffs
- 5.6.2 EU Customs Union Impact
- 5.6.3 Major Free Trade Agreements
- 5.6.4 USMCA Rules of Origin
Note: Trade policy analysis will be included only where relevant to the Oral Macromolecular Formulation market.
Chapter 6. Competitive Landscape & Company Benchmarking
- 6.1 Oral Macromolecular Formulation Market Concentration & Structure
- 6.1.1 Herfindahl-Hirschman Index (HHI) – vs. 2025
- 6.1.2 Tier 1, Tier 2 & Tier 3 Market Structure
- 6.1.3 Global, Regional & Local Player Dynamics
- 6.2 Oral Macromolecular Formulation Market Share Analysis – 2025
- 6.2.1 Global Revenue Share by Company
- 6.2.2 Global Volume Share by Company
- 6.2.3 Regional Revenue Share
- 6.2.4 Market Share Evolution ( vs. 2025)
- 6.2.5 OEM Segment Share by Company
- 6.2.6 Replacement Segment Share by Company
- 6.3 Production/Delivery Capacity & Facility Analysis
- 6.3.1 Global Installed Capacity
- 6.3.2 Capacity Utilization Rates
- 6.3.3 Production/Output Volume
- 6.3.4 Facility Locations & Capacity Map
- 6.3.5 Planned Capacity Additions
- 6.4 Oral Macromolecular Formulation Competitive Benchmarking Matrix
- 6.4.1 Revenue, Volume, CAGR & Profitability Comparison
- 6.4.2 Channel Revenue Mix
- 6.4.3 Geographic Revenue Exposure
- 6.4.4 R&D Intensity
- 6.4.5 Sustainability Maturity
- 6.5 Strategic Developments in Oral Macromolecular Formulation (Last 24 Months)
- 6.5.1 Mergers, Acquisitions & Divestments
- 6.5.2 New Oral Macromolecular Formulation Launches
- 6.5.3 Facility Expansions
- 6.5.4 Strategic Alliances, Joint Ventures & Partnerships
- 6.5.5 Distribution Expansion & Market Entry
- 6.5.6 Sustainability & ESG Initiatives
- 6.6 Competitive Strategy Mapping
- 6.6.1 Leader, Challenger, Follower & Niche Classification
- 6.6.2 Pricing Strategy Comparison
- 6.6.3 Channel Strategy Matrix
Note: Strategic developments are included based on their materiality and the availability of reliable information.
Chapter 7. Global Oral Macromolecular Formulation Market – By Distribution Channel
- 7.1 Segment Overview
- 7.1.1 Volume & Revenue Split by Channel (2025 & 2032)
- 7.1.2 Channel Mix Evolution (2025-2032)
Chapter 8. Regional Market Analysis – Global Overview
- 8.1 Global Regional Overview
- 8.1.1 Regional Volume Share
- 8.1.2 Regional Revenue Share
- 8.1.3 Regional Volume by Region
- 8.1.4 Regional Revenue by Region
- 8.1.5 Regional Forecast Through 2032
- 8.2 Cross-Regional Segment Analysis
- 8.2.1 By Distribution Channel
- 8.2.2 By Brand/Price Tier
Chapter 9. North America Oral Macromolecular Formulation Market
- 9.1 United States
- 9.2 Canada
- 9.3 Mexico
Chapter 10. Europe Oral Macromolecular Formulation Market
- 10.1 Germany
- 10.2 France
- 10.3 Italy
- 10.4 United Kingdom
- 10.5 Spain
- 10.6 Poland
- 10.7 Russia
- 10.8 Netherlands
- 10.9 Belgium
- 10.10 Sweden
- 10.11 Denmark
- 10.12 Norway
- 10.13 Rest of Europe
Chapter 11. Asia Pacific Oral Macromolecular Formulation Market
- 11.1 China
- 11.2 India
- 11.3 Japan
- 11.4 South Korea
- 11.5 Thailand
- 11.6 Indonesia
- 11.7 Vietnam
- 11.8 Malaysia
- 11.9 Australia
- 11.10 Rest of Asia Pacific
Chapter 12. Latin America Oral Macromolecular Formulation Market
- 12.1 Brazil
- 12.2 Argentina
- 12.3 Colombia
- 12.4 Chile
- 12.5 Rest of Latin America
Chapter 13. Middle East Oral Macromolecular Formulation Market
- 13.1 Saudi Arabia
- 13.2 United Arab Emirates
- 13.3 Turkey
- 13.4 Israel
- 13.5 Iran
- 13.6 Rest of the Middle East
Chapter 14. Africa Oral Macromolecular Formulation Market
- 14.1 South Africa
- 14.2 Egypt
- 14.3 Nigeria
- 14.4 Morocco
- 14.5 Rest of Africa
Chapter 15. Oral Macromolecular Formulation Company Profiles
- 15.1 [Company 01]
- 15.1.1 Company Overview
- 15.1.2 Key Management Personnel
- 15.1.3 Products & Services Portfolio
- 15.1.4 Financial Performance
- 15.1.5 Key Market Focus & Geographic Presence
- 15.1.6 Recent Developments & Strategic Initiatives
Note: The company profile list is preliminary and may change based on research findings, market developments, data availability, and client requirements.
Chapter 16. Appendices
- Appendix A – List of Abbreviations & Acronyms
- Appendix B – Industry Classification Code Reference – Full Series
- Appendix C – Production & Capacity Data Tables
- Appendix D – End-Use & Demand Base Tables
- Appendix E – Consumption & Replacement Rate Assumptions
- Appendix F – ASP Reference Tables
- Appendix G – Manufacturing & Facility Database
- Appendix H – Import-Export Data Tables
- Appendix I – Regulatory Summary Tables
- Appendix J – Primary Research Participant List (Anonymized)
- Appendix K – Primary Research Questionnaire Framework
- Appendix L – Data Sources & Bibliography
- Appendix M – Market Size Divergence & Source Comparison
Chapter 17. Research Methodology
- 17.1 Research Framework & Philosophy
- 17.2 Secondary Research – Sources, Hierarchy & Data Extraction
- 17.3 Data Modeling – Bottom-Up & Top-Down Market Sizing
- 17.4 Primary Research – Stakeholder Framework, LOI & Sample Sizes
- 17.5 Forecast Methodology – Regression, Scenario & Sensitivity Analysis
- 17.6 Quality Control – Four-Layer Validation Framework
- 17.7 Limitations & Standard Assumptions
- 17.8 Disclaimer
