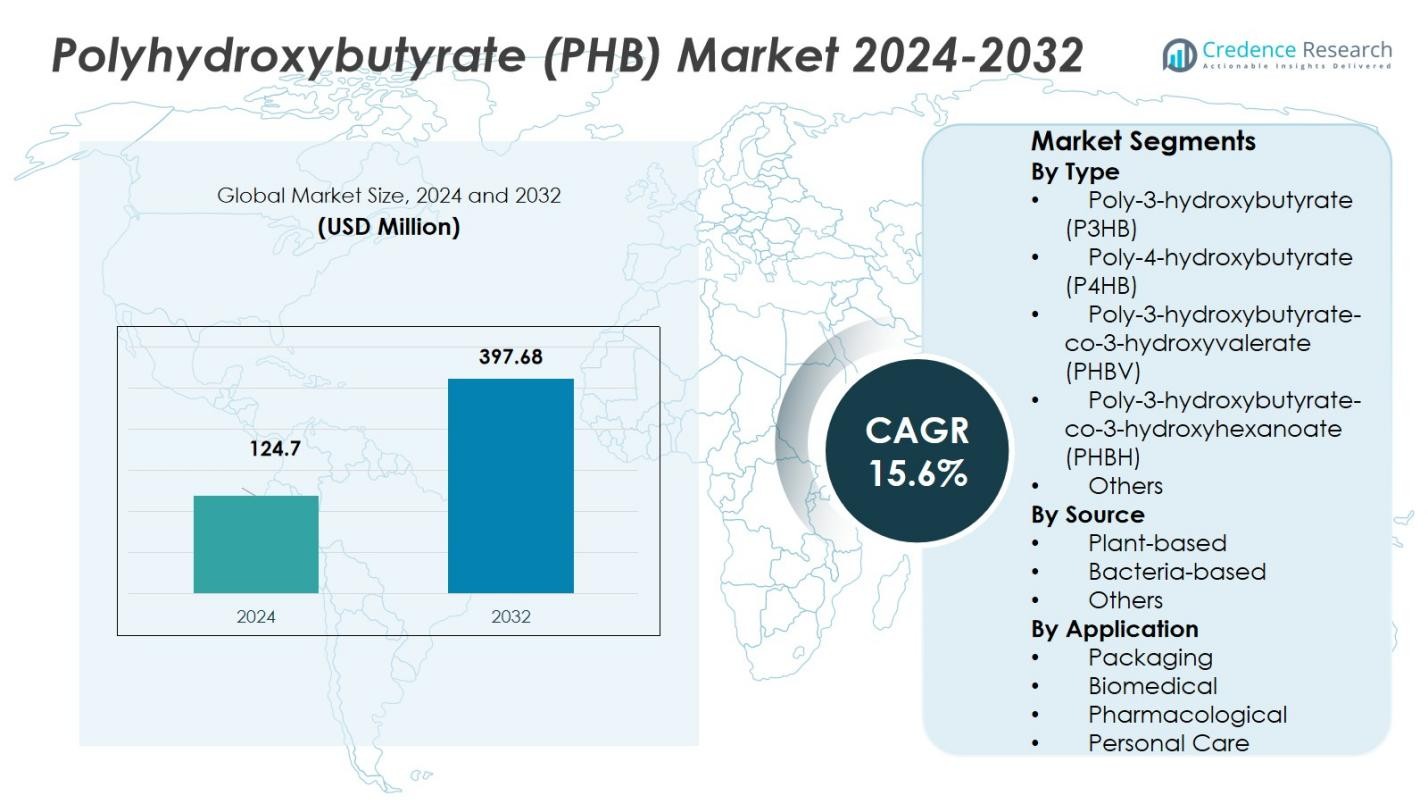
CHAPTER NO. 1 : INTRODUCTION 35
1.1. Report Description 35
1.1.1. Purpose of the Report 35
1.1.2. USP & Key Offerings 35
1.2. Key Benefits for Stakeholders 35
1.3. Target Audience 36
1.4. Report Scope 37
CHAPTER NO. 2 : EXECUTIVE SUMMARY 39
2.1. Polyhydroxybutyrate (PHB) Market Snapshot 39
2.2. Global Polyhydroxybutyrate (PHB) Market, 2017 – 2022 (Kilo Tons) (USD Million) 41
2.1. Insights from Primary Respondents 41
CHAPTER NO. 3 : IMPACT ANALYSIS OF COVID 19 & RUSSIA-UKRAINE WAR ON POLYHYDROXYBUTYRATE (PHB) MARKET 42
3.1. Impact Assessment of COVID-19 Pandemic, By Region 42
3.1.1. Supply chain disruptions 42
3.1.2. Demand fluctuations 42
3.1.3. Shift in product mix 42
3.1.4. Reduced industrial activity 42
3.1.5. Temporary disruptions and delays 42
3.1.6. Shift in focus towards essential services 42
3.2. Russia-Ukraine War Impacts 43
3.2.1. Uncertainty and economic instability 43
3.2.2. Supply chain disruptions 43
3.2.3. Regional market shifts 43
3.2.4. Shift in government priorities 43
CHAPTER NO. 4 : POLYHYDROXYBUTYRATE (PHB) MARKET – INDUSTRY ANALYSIS 44
4.1. Introduction 44
4.2. Market Drivers 45
4.2.1. Driving Factor 1 Analysis 45
4.2.2. Driving Factor 2 Analysis 46
4.3. Market Restraints 47
4.3.1. Restraining Factor Analysis 47
4.4. Market Opportunities 48
4.4.1. Market Opportunity Analysis 48
4.5. Porter’s Five Forces Analysis 49
4.6. Value Chain Analysis 50
4.7. Buying Criteria 51
CHAPTER NO. 5 : IMPORT EXPORT ANALYSIS 52
5.1. Import Analysis by Region 52
5.1.1. Global Polyhydroxybutyrate (PHB) Market Import Volume/Revenue, By Region, 2017 – 2022 52
5.2. Export Analysis by Region 53
5.2.1. Global Polyhydroxybutyrate (PHB) Market Export Volume/Revenue, By Region, 2017 – 2022 53
CHAPTER NO. 6 : DEMAND SUPPLY ANALYSIS 54
6.1. Demand Analysis by Region 54
6.1.1. Global Polyhydroxybutyrate (PHB) Market Demand Volume/Revenue, By Region, 2017 – 2022 54
6.2. Supply Analysis by Region 55
6.2.1. Global Polyhydroxybutyrate (PHB) Market Supply Volume/Revenue, By Region, 2017 – 2022 55
CHAPTER NO. 7 : PRODUCTION ANALYSIS 56
7.1. Production Analysis by Region 56
7.1.1. Global Polyhydroxybutyrate (PHB) Market Production, By Region, 2017 – 2022 56
7.1.2. Global Polyhydroxybutyrate (PHB) Market Production Volume, By Region, 2017 – 2022 (Kilo Tons) 56
CHAPTER NO. 8 : PRICE ANALYSIS 57
8.1. Price Analysis by Region 57
8.1.1. Global Polyhydroxybutyrate (PHB) Market Price, By Region, 2017 – 2022 57
8.1.2. Global Type Market Price, By Region, 2017 – 2022 57
8.2. Price Analysis by Type 58
8.2.1. Global Polyhydroxybutyrate (PHB) Market Price, By Type, 2017 – 2022 58
8.2.2. Global Type Market Price, By Type, 2017 – 2022 58
CHAPTER NO. 9 : RAW MATERIALS ANALYSIS 59
9.1. Key Raw Materials and Suppliers 59
9.2. Key Raw Materials Price Trend 59
CHAPTER NO. 10 : MANUFACTURING COST ANALYSIS 60
10.1. Manufacturing Cost Analysis 60
10.1.1. Manufacturing Cost Analysis 60
10.2. Manufacturing Process 60
10.2.1. Manufacturing Process 60
CHAPTER NO. 11 : ANALYSIS COMPETITIVE LANDSCAPE 61
11.1. Company Market Share Analysis – 2022 61
11.1.1. Global Polyhydroxybutyrate (PHB) Market: Company Market Share, by Volume, 2022 61
11.1.2. Global Polyhydroxybutyrate (PHB) Market: Company Market Share, by Revenue2022 61
11.1.3. Global Polyhydroxybutyrate (PHB) Market: Top 6 Company Market Share, by Revenue2022 62
11.1.4. Global Polyhydroxybutyrate (PHB) Market: Top 3 Company Market Share, by Revenue2022 62
11.1.5 Global Polyhydroxybutyrate (PHB) Market Company Volume Market Share, 2022 64
11.2. Global Polyhydroxybutyrate (PHB) Market Company Revenue Market Share, 2022 65
11.3. Company Assessment Metrics, 2022 66
11.3.1. Stars 66
11.3.2. Emerging Leaders 66
11.3.3. Pervasive Players 66
11.3.4. Participants 66
11.4. Start-ups /SMEs Assessment Metrics, 2022 66
11.4.1. Progressive Companies 66
11.4.2. Responsive Companies 66
11.4.3. Dynamic Companies 66
11.4.4. Starting Blocks 66
11.5. Strategic Developments 67
11.5.1. Acquisitions & Mergers 67
11.5.2. New Product Launch 67
11.5.3. Regional Expansion 67
11.6. Key Players Product Matrix 68
CHAPTER NO. 12 : PESTEL & ADJACENT MARKET ANALYSIS 69
12.1. PESTEL 69
12.1.1. Political Factors 69
12.1.2. Economic Factors 69
12.1.3. Social Factors 69
12.1.4. Technological Factors 69
12.1.5. Environmental Factors 69
12.1.6. Legal Factors 69
12.2. Adjacent Market Analysis 69
CHAPTER NO. 13 : POLYHYDROXYBUTYRATE (PHB) MARKET – BY TYPE SEGMENT ANALYSIS 70
13.1. Polyhydroxybutyrate (PHB) Market Overview, by Type Segment 70
13.1.1. Polyhydroxybutyrate (PHB) Market Volume Share, By Type, 2022 & 2030 71
13.1.2. Polyhydroxybutyrate (PHB) Market Revenue Share, By Type, 2022 & 2030 71
13.1.3. Polyhydroxybutyrate (PHB) Market Attractiveness Analysis, By Type 72
13.1.4. Incremental Revenue Growth Opportunity, by Type, 2023 – 2030 72
13.1.5. Polyhydroxybutyrate (PHB) Market Revenue, By Type, 2017, 2022, 2026 & 2030 73
13.2. Powder 74
13.2.1. Global Powder Polyhydroxybutyrate (PHB) Market Volume & Revenue, By Region, 2017 – 2022 (Kilo Tons) (USD Million) 75
13.2.2. Global Powder Polyhydroxybutyrate (PHB) Market Volume & Revenue, By Region, 2017 – 2022 (Kilo Tons) (USD Million) 75
13.3. Film 76
13.3.1. Global Film Polyhydroxybutyrate (PHB) Market Volume & Revenue, By Region, 2017 – 2022 (Kilo Tons) (USD Million) 77
13.3.2. Global Film Polyhydroxybutyrate (PHB) Market Volume & Revenue, By Region, 2017 – 2022 (Kilo Tons) (USD Million) 77
13.4. Sheet 78
13.4.1. Global Sheet Polyhydroxybutyrate (PHB) Market Volume & Revenue, By Region, 2017 – 2022 (Kilo Tons) (USD Million) 79
13.4.2. Global Sheet Polyhydroxybutyrate (PHB) Market Volume & Revenue, By Region, 2017 – 2022 (Kilo Tons) (USD Million) 79
13.5. Granules 80
13.5.1. Global Granules Polyhydroxybutyrate (PHB) Market Volume & Revenue, By Region, 2017 – 2022 (Kilo Tons) (USD Million) 81
13.5.2. Global Granules Polyhydroxybutyrate (PHB) Market Volume & Revenue, By Region, 2017 – 2022 (Kilo Tons) (USD Million) 81
13.6. Others 82
13.6.1. Global Others Polyhydroxybutyrate (PHB) Market Volume & Revenue, By Region, 2017 – 2022 (Kilo Tons) (USD Million) 83
13.6.2. Global Others Polyhydroxybutyrate (PHB) Market Volume & Revenue, By Region, 2017 – 2022 (Kilo Tons) (USD Million) 83
CHAPTER NO. 14 : POLYHYDROXYBUTYRATE (PHB) MARKET – BY APPLICATION SEGMENT ANALYSIS 84
14.1. Polyhydroxybutyrate (PHB) Market Overview, by Application Segment 84
14.1.1. Polyhydroxybutyrate (PHB) Market Volume Share, By Application, 2022 & 2030 85
14.1.2. Polyhydroxybutyrate (PHB) Market Revenue Share, By Application, 2022 & 2030 85
14.1.3. Polyhydroxybutyrate (PHB) Market Attractiveness Analysis, By Application 86
14.1.4. Incremental Revenue Growth Opportunity, by Application, 2023 – 2030 86
14.1.5. Polyhydroxybutyrate (PHB) Market Revenue, By Application, 2017, 2022, 2026 & 2030 87
14.2. Medical Devices 88
14.2.1. Global Medical Devices Polyhydroxybutyrate (PHB) Market Volume & Revenue, By Region, 2017 – 2022 (Kilo Tons) (USD Million) 89
14.2.2. Global Medical Devices Polyhydroxybutyrate (PHB) Market Volume & Revenue, By Region, 2017 – 2022 (Kilo Tons) (USD Million) 89
14.3. Mulch Films 90
14.3.1. Global Mulch Films Polyhydroxybutyrate (PHB) Market Volume & Revenue, By Region, 2017 – 2022 (Kilo Tons) (USD Million) 91
14.3.2. Global Mulch Films Polyhydroxybutyrate (PHB) Market Volume & Revenue, By Region, 2017 – 2022 (Kilo Tons) (USD Million) 91
14.4. Packaging 92
14.4.1. Global Packaging Polyhydroxybutyrate (PHB) Market Volume & Revenue, By Region, 2017 – 2022 (Kilo Tons) (USD Million) 93
14.4.2. Global Packaging Polyhydroxybutyrate (PHB) Market Volume & Revenue, By Region, 2017 – 2022 (Kilo Tons) (USD Million) 93
14.5. Consumer Good 94
14.5.1. Global Consumer Good Polyhydroxybutyrate (PHB) Market Volume & Revenue, By Region, 2017 – 2022 (Kilo Tons) (USD Million) 95
14.5.2. Global Consumer Good Polyhydroxybutyrate (PHB) Market Volume & Revenue, By Region, 2017 – 2022 (Kilo Tons) (USD Million) 95
14.6. Others 96
14.6.1. Global Others Polyhydroxybutyrate (PHB) Market Volume & Revenue, By Region, 2017 – 2022 (Kilo Tons) (USD Million) 97
14.6.2. Global Others Polyhydroxybutyrate (PHB) Market Volume & Revenue, By Region, 2017 – 2022 (Kilo Tons) (USD Million) 97
CHAPTER NO. 15 : POLYHYDROXYBUTYRATE (PHB) MARKET – BY END-USER SEGMENT ANALYSIS 98
15.1. Polyhydroxybutyrate (PHB) Market Overview, by End-user Segment 98
15.1.1. Polyhydroxybutyrate (PHB) Market Volume Share, By End-user, 2022 & 2030 99
15.1.2. Polyhydroxybutyrate (PHB) Market Revenue Share, By End-user, 2022 & 2030 99
15.1.3. Polyhydroxybutyrate (PHB) Market Attractiveness Analysis, By End-user 100
15.1.4. Incremental Revenue Growth Opportunity, by End-user, 2023 – 2030 100
15.1.5. Polyhydroxybutyrate (PHB) Market Revenue, By End-user, 2017, 2022, 2026 & 2030 101
15.2. Food & Beverage 102
15.2.1. Global Food & Beverage Polyhydroxybutyrate (PHB) Market Volume & Revenue, By Region, 2017 – 2022 (Kilo Tons) (USD Million) 103
15.2.2. Global Food & Beverage Polyhydroxybutyrate (PHB) Market Volume & Revenue, By Region, 2023 – 2030 (Kilo Tons) (USD Million) 103
15.3. Automotive 104
15.3.1. Global Automotive Polyhydroxybutyrate (PHB) Market Volume & Revenue, By Region, 2017 – 2022 (Kilo Tons) (USD Million) 105
15.3.2. Global Automotive Polyhydroxybutyrate (PHB) Market Volume & Revenue, By Region, 2023 – 2030 (Kilo Tons) (USD Million) 105
15.4. Pharmaceutical 106
15.4.1. Global Pharmaceutical Polyhydroxybutyrate (PHB) Market Volume & Revenue, By Region, 2017 – 2022 (Kilo Tons) (USD Million) 107
15.4.2. Global Pharmaceutical Polyhydroxybutyrate (PHB) Market Volume & Revenue, By Region, 2023 – 2030 (Kilo Tons) (USD Million) 107
15.5. Agriculture 108
15.5.1. Global Agriculture Polyhydroxybutyrate (PHB) Market Volume & Revenue, By Region, 2017 – 2022 (Kilo Tons) (USD Million) 109
15.5.2. Global Agriculture Polyhydroxybutyrate (PHB) Market Volume & Revenue, By Region, 2023 – 2030 (Kilo Tons) (USD Million) 109
15.6. Others 110
15.6.1. Global Others Polyhydroxybutyrate (PHB) Market Volume & Revenue, By Region, 2017 – 2022 (Kilo Tons) (USD Million) 111
15.6.2. Global Others Polyhydroxybutyrate (PHB) Market Volume & Revenue, By Region, 2023 – 2030 (Kilo Tons) (USD Million) 111
CHAPTER NO. 16 : POLYHYDROXYBUTYRATE (PHB) MARKET – BY PRODUCTION PROCESS SEGMENT ANALYSIS 112
16.1. Polyhydroxybutyrate (PHB) Market Overview, by Production Process Segment 112
16.1.1. Polyhydroxybutyrate (PHB) Market Revenue Share, By Production Process, 2022 & 2030 113
16.1.2. Polyhydroxybutyrate (PHB) Market Revenue Share, By Production Process, 2022 & 2030 113
16.1.3. Polyhydroxybutyrate (PHB) Market Attractiveness Analysis, By Production Process 114
16.1.4. Incremental Revenue Growth Opportunity, by Production Process, 2023 – 2030 114
16.1.5. Polyhydroxybutyrate (PHB) Market Revenue, By Production Process, 2017, 2022, 2026 & 2030 115
16.2. Fermentation 116
16.2.1. Global Fermentation Polyhydroxybutyrate (PHB) Market Volume & Revenue, By Region, 2017 – 2022 (Kilo Tons) (USD Million) 117
16.2.2. Global Fermentation Polyhydroxybutyrate (PHB) Market Volume & Revenue, By Region, 2023 – 2030 (Kilo Tons) (USD Million) 117
16.3. Chemical Synthesis 118
16.3.1. Global Chemical Synthesis Polyhydroxybutyrate (PHB) Market Volume & Revenue, By Region, 2017 – 2022 (Kilo Tons) (USD Million) 119
16.3.2. Global Chemical Synthesis Polyhydroxybutyrate (PHB) Market Volume & Revenue, By Region, 2023 – 2030 (Kilo Tons) (USD Million) 119
CHAPTER NO. 17 : POLYHYDROXYBUTYRATE (PHB) MARKET – BY SOURCE SEGMENT ANALYSIS 120
17.1. Polyhydroxybutyrate (PHB) Market Overview, by Source Segment 120
17.1.1. Polyhydroxybutyrate (PHB) Market Revenue Share, By Source, 2022 & 2030 121
17.1.2. Polyhydroxybutyrate (PHB) Market Revenue Share, By Source, 2022 & 2030 121
17.1.3. Polyhydroxybutyrate (PHB) Market Attractiveness Analysis, By Source 122
17.1.4. Incremental Revenue Growth Opportunity, by Source, 2023 – 2030 122
17.1.5. Polyhydroxybutyrate (PHB) Market Revenue, By Source, 2017, 2022, 2026 & 2030 123
17.2. Plant-Based PHB 124
17.2.1. Global Plant-Based PHB Polyhydroxybutyrate (PHB) Market Volume & Revenue, By Region, 2017 – 2022 (Kilo Tons) (USD Million) 125
17.2.2. Global Plant-Based PHB Polyhydroxybutyrate (PHB) Market Volume & Revenue, By Region, 2023 – 2030 (Kilo Tons) (USD Million) 125
17.3. Microbial PHB 126
17.3.1. Global Microbial PHB Polyhydroxybutyrate (PHB) Market Volume & Revenue, By Region, 2017 – 2022 (Kilo Tons) (USD Million) 127
17.3.2. Global Microbial PHB Polyhydroxybutyrate (PHB) Market Volume & Revenue, By Region, 2023 – 2030 (Kilo Tons) (USD Million) 127
CHAPTER NO. 18 : POLYHYDROXYBUTYRATE (PHB) MARKET – REGIONAL ANALYSIS 128
18.1. Polyhydroxybutyrate (PHB) Market Overview, by Regional Segments 128
18.2. Region 129
18.2.1. Global Polyhydroxybutyrate (PHB) Market Volume Share, By Region, 2022 & 2030 129
18.2.2. Global Polyhydroxybutyrate (PHB) Market Revenue Share, By Region, 2022 & 2030 129
18.2.3. Polyhydroxybutyrate (PHB) Market Attractiveness Analysis, By Region 130
18.2.4. Incremental Revenue Growth Opportunity, by Region, 2023 – 2030 130
18.2.5. Polyhydroxybutyrate (PHB) Market Revenue, By Region, 2017, 2022, 2026 & 2030 131
18.2.6. Global Polyhydroxybutyrate (PHB) Market Volume & Revenue, By Region, 2017 – 2022 (Kilo Tons) (USD Million) 132
18.2.7. Global Polyhydroxybutyrate (PHB) Market Volume & Revenue, By Region, 2023 – 2030 (Kilo Tons) (USD Million) 132
18.3. Type 133
18.3.1. Global Polyhydroxybutyrate (PHB) Market Volume & Revenue, By Type, 2017 – 2022 (Kilo Tons) (USD Million) 133
18.3.2. Global Polyhydroxybutyrate (PHB) Market Volume & Revenue, By Type, 2023 – 2030 (Kilo Tons) (USD Million) 133
18.4. Application 134
18.4.1. Global Polyhydroxybutyrate (PHB) Market Volume & Revenue, By Application, 2017 – 2022 (Kilo Tons) (USD Million) 134
18.4.2. Global Polyhydroxybutyrate (PHB) Market Volume & Revenue, By Application, 2023 – 2030 (Kilo Tons) (USD Million) 134
18.5. End-user 135
18.5.1. Global Polyhydroxybutyrate (PHB) Market Volume & Revenue, By End-user, 2017 – 2022 (Kilo Tons) (USD Million) 135
18.5.2. Global Polyhydroxybutyrate (PHB) Market Volume & Revenue, By End-user, 2023 – 2030 (Kilo Tons) (USD Million) 135
18.6. Production Process 136
18.6.1. Global Polyhydroxybutyrate (PHB) Market Volume & Revenue, By Production Process, 2017 – 2022 (Kilo Tons) (USD Million) 136
18.6.2. Global Polyhydroxybutyrate (PHB) Market Volume & Revenue, By Production Process, 2023 – 2030 (Kilo Tons) (USD Million) 136
18.7. Source 137
18.7.1. Global Polyhydroxybutyrate (PHB) Market Volume & Revenue, By Source, 2017 – 2022 (Kilo Tons) (USD Million) 137
18.7.2. Global Polyhydroxybutyrate (PHB) Market Volume & Revenue, By Source, 2023 – 2030 (Kilo Tons) (USD Million) 137
CHAPTER NO. 19 : POLYHYDROXYBUTYRATE (PHB) MARKET – NORTH AMERICA 138
19.1. North America 138
19.1. Key Highlights 138
19.1.1. North America Polyhydroxybutyrate (PHB) Market Volume, By Country, 2017 – 2022 (Kilo Tons) 139
19.1.2. North America Polyhydroxybutyrate (PHB) Market Revenue, By Country, 2017 – 2022 (USD Million) 140
19.1.2.1. North America Polyhydroxybutyrate (PHB) Market Volume, By Type, 2017 – 2022 (Kilo Tons) 141
19.1.3. North America Polyhydroxybutyrate (PHB) Market Revenue, By Type, 2017 – 2022 (USD Million) 142
19.1.4. North America Polyhydroxybutyrate (PHB) Market Volume, By Application, 2017 – 2022 (Kilo Tons) 143
19.1.5. North America Polyhydroxybutyrate (PHB) Market Revenue, By Application, 2017 – 2022 (USD Million) 144
19.1.6. North America Polyhydroxybutyrate (PHB) Market Volume, By End-user, 2017 – 2022 (Kilo Tons) 145
19.1.7. North America Polyhydroxybutyrate (PHB) Market Revenue, By End-user, 2017 – 2022 (USD Million) 146
19.1.8. North America Polyhydroxybutyrate (PHB) Market Volume, By Production Process, 2017 – 2022 (Kilo Tons) 147
19.1.9. North America Polyhydroxybutyrate (PHB) Market Revenue, By Production Process, 2017 – 2022 (USD Million) 148
19.1.10. North America Polyhydroxybutyrate (PHB) Market Volume, By Source, 2017 – 2022 (Kilo Tons) 149
19.1.11. North America Polyhydroxybutyrate (PHB) Market Revenue, By Source, 2017 – 2022 (USD Million) 150
19.1.12. U.S. 151
19.1.13. Canada 151
19.1.14. Mexico 151
CHAPTER NO. 20 : POLYHYDROXYBUTYRATE (PHB) MARKET – EUROPE 152
20.1. Europe 152
20.2. Key Highlights 152
20.2.1. Europe Polyhydroxybutyrate (PHB) Market Volume, By Country, 2017 – 2022 (Kilo Tons) 153
20.2.2. Europe Polyhydroxybutyrate (PHB) Market Revenue, By Country, 2017 – 2022 (USD Million) 154
20.2.3. Europe Polyhydroxybutyrate (PHB) Market Volume, By Type, 2017 – 2022 (Kilo Tons) 155
20.2.4. Europe Polyhydroxybutyrate (PHB) Market Revenue, By Type, 2017 – 2022 (USD Million) 156
20.2.5. Europe Polyhydroxybutyrate (PHB) Market Volume, By Application, 2017 – 2022 (Kilo Tons) 157
20.2.6. Europe Polyhydroxybutyrate (PHB) Market Revenue, By Application, 2017 – 2022 (USD Million) 158
20.2.7. Europe Polyhydroxybutyrate (PHB) Market Volume, By End-user, 2017 – 2022 (Kilo Tons) 159
20.2.8. Europe Polyhydroxybutyrate (PHB) Market Revenue, By End-user, 2017 – 2022 (USD Million) 160
20.2.9. Europe Polyhydroxybutyrate (PHB) Market Volume, By Production Process, 2017 – 2022 (Kilo Tons) 161
20.2.10. Europe Polyhydroxybutyrate (PHB) Market Revenue, By Production Process, 2017 – 2022 (USD Million) 162
20.2.11. Europe Polyhydroxybutyrate (PHB) Market Volume, By Source, 2017 – 2022 (Kilo Tons) 163
20.2.12. Europe Polyhydroxybutyrate (PHB) Market Revenue, By Source, 2017 – 2022 (USD Million) 164
20.2.13. UK 165
20.2.14. France 165
20.2.15. Germany 165
20.2.16. Italy 165
20.2.17. Spain 165
20.2.18. Russia 165
20.2.19. BENELUX 165
20.2.20. Sweden 165
20.2.21. Denmark 165
20.2.22. Poland 165
20.2.23. Austria 165
20.2.24. Rest of Europe 165
CHAPTER NO. 21 : POLYHYDROXYBUTYRATE (PHB) MARKET – ASIA PACIFIC 166
21.1. Asia Pacific 166
21.2. Key Highlights 166
21.2.1. Asia Pacific Polyhydroxybutyrate (PHB) Market Volume, By Country, 2017 – 2022 (Kilo Tons) 167
21.2.2. Asia Pacific Polyhydroxybutyrate (PHB) Market Revenue, By Country, 2017 – 2022 (USD Million) 168
21.2.3. Asia Pacific Polyhydroxybutyrate (PHB) Market Volume, By Type, 2017 – 2022 (Kilo Tons) 169
21.2.4. Asia Pacific Polyhydroxybutyrate (PHB) Market Revenue, By Type, 2017 – 2022 (USD Million) 170
21.2.5. Asia Pacific Polyhydroxybutyrate (PHB) Market Volume, By Application, 2017 – 2022 (Kilo Tons) 171
21.2.6. Asia Pacific Polyhydroxybutyrate (PHB) Market Revenue, By Application, 2017 – 2022 (USD Million) 172
21.2.7. Asia Pacific Polyhydroxybutyrate (PHB) Market Volume, By End-user, 2017 – 2022 (Kilo Tons) 173
21.2.8. Asia Pacific Polyhydroxybutyrate (PHB) Market Revenue, By End-user, 2017 – 2022 (USD Million) 174
21.2.9. Asia Pacific Polyhydroxybutyrate (PHB) Market Volume, By Production Process, 2017 – 2022 (Kilo Tons) 175
21.2.10. Asia Pacific Polyhydroxybutyrate (PHB) Market Revenue, By Production Process, 2017 – 2022 (USD Million) 176
21.2.11. Asia Pacific Polyhydroxybutyrate (PHB) Market Volume, By Source, 2017 – 2022 (Kilo Tons) 177
21.2.12. Asia Pacific Polyhydroxybutyrate (PHB) Market Revenue, By Source, 2017 – 2022 (USD Million) 178
21.2.13. China 179
21.2.14. Japan 179
21.2.15. South Korea 179
21.2.16. India 179
21.2.17. Thailand 179
21.2.18. Indonesia 179
21.2.19. Vietnam 179
21.2.20. Malaysia 179
21.2.21. Philippines 179
21.2.22. Taiwan 179
21.2.23. Rest of Asia Pacific 179
CHAPTER NO. 22 : POLYHYDROXYBUTYRATE (PHB) MARKET – LATIN AMERICA 180
22.1. Latin America 180
22.2. Key Highlights 180
22.2.1. Latin America Polyhydroxybutyrate (PHB) Market Volume, By Country, 2017 – 2022 (Kilo Tons) 181
22.2.2. Latin America Polyhydroxybutyrate (PHB) Market Revenue, By Country, 2017 – 2022 (USD Million) 182
22.2.3. Latin America Polyhydroxybutyrate (PHB) Market Volume, By Type, 2017 – 2022 (Kilo Tons) 183
22.2.4. Latin America Polyhydroxybutyrate (PHB) Market Revenue, By Type, 2017 – 2022 (USD Million) 184
22.2.5. Latin America Polyhydroxybutyrate (PHB) Market Volume, By Application, 2017 – 2022 (Kilo Tons) 185
22.2.6. Latin America Polyhydroxybutyrate (PHB) Market Revenue, By Application, 2017 – 2022 (USD Million) 186
22.2.7. Latin America Polyhydroxybutyrate (PHB) Market Volume, By End-user, 2017 – 2022 (Kilo Tons) 187
22.2.8. Latin America Polyhydroxybutyrate (PHB) Market Revenue, By End-user, 2017 – 2022 (USD Million) 188
22.2.9. Latin America Polyhydroxybutyrate (PHB) Market Volume, By Production Process, 2017 – 2022 (Kilo Tons) 189
22.2.10. Latin America Polyhydroxybutyrate (PHB) Market Revenue, By Production Process, 2017 – 2022 (USD Million) 190
22.2.11. Latin America Polyhydroxybutyrate (PHB) Market Volume, By Source, 2017 – 2022 (Kilo Tons) 191
22.2.12. Latin America Polyhydroxybutyrate (PHB) Market Revenue, By Source, 2017 – 2022 (USD Million) 192
22.2.13. Brazil 193
22.2.14. Argentina 193
22.2.15. Colombia 193
22.2.16. Chile 193
22.2.17. Peru 193
22.2.18. Rest of Latin America 193
CHAPTER NO. 23 : POLYHYDROXYBUTYRATE (PHB) MARKET – MIDDLE EAST 194
23.1. The Middle-East 194
23.2. Key Highlights 194
23.2.1. Middle East Polyhydroxybutyrate (PHB) Market Volume, By Country, 2017 – 2022 (Kilo Tons) 195
23.2.2. Middle East Polyhydroxybutyrate (PHB) Market Revenue, By Country, 2017 – 2022 (USD Million) 196
23.2.3. Middle East Polyhydroxybutyrate (PHB) Market Volume, By Type, 2017 – 2022 (Kilo Tons) 197
23.2.4. Middle East Polyhydroxybutyrate (PHB) Market Revenue, By Type, 2017 – 2022 (USD Million) 198
23.2.5. Middle East Polyhydroxybutyrate (PHB) Market Volume, By Application, 2017 – 2022 (Kilo Tons) 199
23.2.6. Middle East Polyhydroxybutyrate (PHB) Market Revenue, By Application, 2017 – 2022 (USD Million) 200
23.2.7. Middle East Polyhydroxybutyrate (PHB) Market Volume, By End-user, 2017 – 2022 (Kilo Tons) 201
23.2.8. Middle East Polyhydroxybutyrate (PHB) Market Revenue, By End-user, 2017 – 2022 (USD Million) 202
23.2.9. Middle East Polyhydroxybutyrate (PHB) Market Volume, By Production Process, 2017 – 2022 (Kilo Tons) 203
23.2.10. Middle East Polyhydroxybutyrate (PHB) Market Revenue, By Production Process, 2017 – 2022 (USD Million) 204
23.2.11. Middle East Polyhydroxybutyrate (PHB) Market Volume, By Source, 2017 – 2022 (Kilo Tons) 205
23.2.12. Middle East Polyhydroxybutyrate (PHB) Market Revenue, By Source, 2017 – 2022 (USD Million) 206
23.2.13. GCC Countries 207
23.2.14. Israel 207
23.2.15. Turkey 207
23.2.16. Iran 207
23.2.17. Rest of Middle East & Africa 207
CHAPTER NO. 24 : POLYHYDROXYBUTYRATE (PHB) MARKET – AFRICA 208
24.1. Africa 208
24.2. Key Highlights 208
24.2.1. Africa Polyhydroxybutyrate (PHB) Market Volume, By Country, 2017 – 2022 (Kilo Tons) 209
24.2.2. Africa Polyhydroxybutyrate (PHB) Market Revenue, By Country, 2017 – 2022 (USD Million) 210
24.2.3. Africa Polyhydroxybutyrate (PHB) Market Volume, By Type, 2017 – 2022 (Kilo Tons) 211
24.2.4. Africa Polyhydroxybutyrate (PHB) Market Revenue, By Type, 2017 – 2022 (USD Million) 212
24.2.5. Africa Polyhydroxybutyrate (PHB) Market Volume, By Application, 2017 – 2022 (Kilo Tons) 213
24.2.6. Africa Polyhydroxybutyrate (PHB) Market Revenue, By Application, 2017 – 2022 (USD Million) 214
24.2.7. Africa Polyhydroxybutyrate (PHB) Market Volume, By End-user, 2017 – 2022 (Kilo Tons) 215
24.2.8. Africa Polyhydroxybutyrate (PHB) Market Revenue, By End-user, 2017 – 2022 (USD Million) 216
24.2.9. Africa Polyhydroxybutyrate (PHB) Market Volume, By Production Process, 2017 – 2022 (Kilo Tons) 217
24.2.10. Africa Polyhydroxybutyrate (PHB) Market Revenue, By Production Process, 2017 – 2022 (USD Million) 218
24.2.11. Africa Polyhydroxybutyrate (PHB) Market Volume, By Source, 2017 – 2022 (Kilo Tons) 219
24.2.12. Africa Polyhydroxybutyrate (PHB) Market Revenue, By Source, 2017 – 2022 (USD Million) 220
24.2.13. South Africa 221
24.2.14. Egypt 221
24.2.15. Nigeria 221
24.2.16. Algeria 221
24.2.17. Morocco 221
24.2.18. Rest of Africa 221
CHAPTER NO. 25 : COMPANY PROFILES 222
25.1. BASF SE 222
25.1.1. Company Overview 222
25.1.2. Product Portfolio 222
25.1.3. Swot Analysis 222
25.1.4. Business Strategy 223
25.1.5. Financial Overview 223
25.2. Biomer 224
25.3. TianAn Biologic Materials Co., Ltd. 224
25.4. POLYHYDROXYBUTYRATE Industrial S.A 224
25.5. BIO-ON 224
25.6. Telles, LLC 224
25.7. TEPHA INC 224
25.8. Wacker Chemie AG 224
25.9. Triveni Interchem Pvt Ltd 224
CHAPTER NO. 26 : RESEARCH METHODOLOGY 225
26.1. Research Methodology 225
26.2. Phase I – Secondary Research 226
26.3. Phase II – Data Modeling 226
26.3.1. Company Share Analysis Model 227
26.3.2. Revenue Based Modeling 227
26.4. Phase III – Primary Research 228
26.5. Research Limitations 229
26.5.1. Assumptions 229
List of Figures
FIG NO. 1. Global Polyhydroxybutyrate (PHB) Market Volume & Revenue, 2017 – 2022 (Kilo Tons) (USD Million) 41
FIG NO. 2. Porter’s Five Forces Analysis for Global Polyhydroxybutyrate (PHB) Market 49
FIG NO. 3. Value Chain Analysis for Global Polyhydroxybutyrate (PHB) Market 50
FIG NO. 4. Global Polyhydroxybutyrate (PHB) Market Import Volume/Revenue, By Region, 2017 – 2022 52
FIG NO. 5. Global Polyhydroxybutyrate (PHB) Market Export Volume/Revenue, By Region, 2017 – 2022 53
FIG NO. 6. Global Polyhydroxybutyrate (PHB) Market Demand Volume/Revenue, By Region, 2017 – 2022 54
FIG NO. 7. Global Polyhydroxybutyrate (PHB) Market Supply Volume/Revenue, By Region, 2017 – 2022 55
FIG NO. 8. Global Polyhydroxybutyrate (PHB) Market Production, By Region, 2017 – 2022 56
FIG NO. 9. Global Polyhydroxybutyrate (PHB) Market Price, By Region, 2017 – 2022 57
FIG NO. 10. Global Polyhydroxybutyrate (PHB) Market Price, By Type, 2017 – 2022 58
FIG NO. 11. Raw Materials Price Trend Analysis, 2017 – 2022 59
FIG NO. 12. Manufacturing Cost Analysis 60
FIG NO. 13. Manufacturing Process 60
FIG NO. 14. Company Share Analysis, 2022 61
FIG NO. 15. Company Share Analysis, 2022 61
FIG NO. 16. Company Share Analysis, 2022 62
FIG NO. 17. Company Share Analysis, 2022 62
FIG NO. 18. Polyhydroxybutyrate (PHB) Market – Company Volume Market Share, 2022 64
FIG NO. 19. Polyhydroxybutyrate (PHB) Market – Company Revenue Market Share, 2022 65
FIG NO. 20. Polyhydroxybutyrate (PHB) Market Volume Share, By Type, 2022 & 2030 71
FIG NO. 21. Polyhydroxybutyrate (PHB) Market Revenue Share, By Type, 2022 & 2030 71
FIG NO. 22. Market Attractiveness Analysis, By Type 72
FIG NO. 23. Incremental Revenue Growth Opportunity by Type 72
FIG NO. 24. Polyhydroxybutyrate (PHB) Market Revenue, By Type, 2017, 2022, 2026 & 2030 73
FIG NO. 25. Global Polyhydroxybutyrate (PHB) Market for Powder, Volume & Revenue (Kilo Tons) (USD Million) 2017 – 2030 74
FIG NO. 26. Global Polyhydroxybutyrate (PHB) Market for Film, Volume & Revenue (Kilo Tons) (USD Million) 2017 – 2030 76
FIG NO. 27. Global Polyhydroxybutyrate (PHB) Market for Sheet, Volume & Revenue (Kilo Tons) (USD Million) 2017 – 2030 78
FIG NO. 28. Global Polyhydroxybutyrate (PHB) Market for Granules, Volume & Revenue (Kilo Tons) (USD Million) 2017 – 2030 80
FIG NO. 29. Global Polyhydroxybutyrate (PHB) Market for Others, Volume & Revenue (Kilo Tons) (USD Million) 2017 – 2030 82
FIG NO. 30. Polyhydroxybutyrate (PHB) Market Volume Share, By Application, 2022 & 2030 85
FIG NO. 31. Polyhydroxybutyrate (PHB) Market Revenue Share, By Application, 2022 & 2030 85
FIG NO. 32. Market Attractiveness Analysis, By Application 86
FIG NO. 33. Incremental Revenue Growth Opportunity by Application 86
FIG NO. 34. Polyhydroxybutyrate (PHB) Market Revenue, By Application, 2017, 2022, 2026 & 2030 87
FIG NO. 35. Global Polyhydroxybutyrate (PHB) Market for Medical Devices, Volume & Revenue (Kilo Tons) (USD Million) 2017 – 2030 88
FIG NO. 36. Global Polyhydroxybutyrate (PHB) Market for Mulch Films, Volume & Revenue (Kilo Tons) (USD Million) 2017 – 2030 90
FIG NO. 37. Global Polyhydroxybutyrate (PHB) Market for Packaging, Volume & Revenue (Kilo Tons) (USD Million) 2017 – 2030 92
FIG NO. 38. Global Polyhydroxybutyrate (PHB) Market for Consumer Good, Volume & Revenue (Kilo Tons) (USD Million) 2017 – 2030 94
FIG NO. 39. Global Polyhydroxybutyrate (PHB) Market for Others, Volume & Revenue (Kilo Tons) (USD Million) 2017 – 2030 96
FIG NO. 40. Polyhydroxybutyrate (PHB) Market Volume Share, By End-user, 2022 & 2030 99
FIG NO. 41. Polyhydroxybutyrate (PHB) Market Revenue Share, By End-user, 2022 & 2030 99
FIG NO. 42. Market Attractiveness Analysis, By End-user 100
FIG NO. 43. Incremental Revenue Growth Opportunity by End-user 100
FIG NO. 44. Polyhydroxybutyrate (PHB) Market Revenue, By End-user, 2017, 2022, 2026 & 2030 101
FIG NO. 45. Global Polyhydroxybutyrate (PHB) Market for Food & Beverage, Volume & Revenue (Kilo Tons) (USD Million) 2017 – 2030 102
FIG NO. 46. Global Polyhydroxybutyrate (PHB) Market for Automotive, Volume & Revenue (Kilo Tons) (USD Million) 2017 – 2030 104
FIG NO. 47. Global Polyhydroxybutyrate (PHB) Market for Pharmaceutical, Volume & Revenue (Kilo Tons) (USD Million) 2017 – 2030 106
FIG NO. 48. Global Polyhydroxybutyrate (PHB) Market for Agriculture, Volume & Revenue (Kilo Tons) (USD Million) 2017 – 2030 108
FIG NO. 49. Global Polyhydroxybutyrate (PHB) Market for Others, Volume & Revenue (Kilo Tons) (USD Million) 2017 – 2030 110
FIG NO. 50. Polyhydroxybutyrate (PHB) Market Revenue Share, By Production Process, 2022 & 2030 113
FIG NO. 51. Polyhydroxybutyrate (PHB) Market Revenue Share, By Production Process, 2022 & 2030 113
FIG NO. 52. Market Attractiveness Analysis, By Production Process 114
FIG NO. 53. Incremental Revenue Growth Opportunity by Production Process 114
FIG NO. 54. Polyhydroxybutyrate (PHB) Market Revenue, By Production Process, 2017, 2022, 2026 & 2030 115
FIG NO. 55. Global Polyhydroxybutyrate (PHB) Market for Fermentation, Volume & Revenue (Kilo Tons) (USD Million) 2017 – 2030 116
FIG NO. 56. Global Polyhydroxybutyrate (PHB) Market for Chemical Synthesis, Volume & Revenue (Kilo Tons) (USD Million) 2017 – 2030 118
FIG NO. 57. Polyhydroxybutyrate (PHB) Market Revenue Share, By Source, 2022 & 2030 121
FIG NO. 58. Polyhydroxybutyrate (PHB) Market Revenue Share, By Source, 2022 & 2030 121
FIG NO. 59. Market Attractiveness Analysis, By Source 122
FIG NO. 60. Incremental Revenue Growth Opportunity by Source 122
FIG NO. 61. Polyhydroxybutyrate (PHB) Market Revenue, By Source, 2017, 2022, 2026 & 2030 123
FIG NO. 62. Global Polyhydroxybutyrate (PHB) Market for Plant-Based PHB, Volume & Revenue (Kilo Tons) (USD Million) 2017 – 2030 124
FIG NO. 63. Global Polyhydroxybutyrate (PHB) Market for Microbial PHB, Volume & Revenue (Kilo Tons) (USD Million) 2017 – 2030 126
FIG NO. 64. Global Polyhydroxybutyrate (PHB) Market Volume Share, By Region, 2022 & 2030 129
FIG NO. 65. Global Polyhydroxybutyrate (PHB) Market Revenue Share, By Region, 2022 & 2030 129
FIG NO. 66. Market Attractiveness Analysis, By Region 130
FIG NO. 67. Incremental Revenue Growth Opportunity by Region 130
FIG NO. 68. Polyhydroxybutyrate (PHB) Market Revenue, By Region, 2017, 2022, 2026 & 2030 131
FIG NO. 69. North America Polyhydroxybutyrate (PHB) Market Volume & Revenue, 2017 – 2022 (Kilo Tons) (USD Million) 138
FIG NO. 70. Europe Polyhydroxybutyrate (PHB) Market Volume & Revenue, 2017 – 2022 (Kilo Tons) (USD Million) 152
FIG NO. 71. Asia Pacific Polyhydroxybutyrate (PHB) Market Volume & Revenue, 2017 – 2022 (Kilo Tons) (USD Million) 166
FIG NO. 72. Latin America Polyhydroxybutyrate (PHB) Market Volume & Revenue, 2017 – 2022 (Kilo Tons) (USD Million) 180
FIG NO. 73. The Middle-East Polyhydroxybutyrate (PHB) Market Volume & Revenue, 2017 – 2022 (Kilo Tons) (USD Million) 194
FIG NO. 74. Africa Polyhydroxybutyrate (PHB) Market Volume & Revenue, 2017 – 2022 (Kilo Tons) (USD Million) 208
FIG NO. 75. Research Methodology – Detailed View 225
FIG NO. 76. Research Methodology 226
List of Tables
TABLE NO. 1. : Global Polyhydroxybutyrate (PHB) Market: Snapshot 39
TABLE NO. 2. : Drivers for the Polyhydroxybutyrate (PHB) Market: Impact Analysis 45
TABLE NO. 3. : Restraints for the Polyhydroxybutyrate (PHB) Market: Impact Analysis 47
TABLE NO. 4. : Global Polyhydroxybutyrate (PHB) Market Volume & Revenue, By Region, 2017 – 2022 (Kilo Tons) 56
TABLE NO. 5. : Global Polyhydroxybutyrate (PHB) Market Volume & Revenue, By Region, 2017 – 2022 57
TABLE NO. 6. : Global Polyhydroxybutyrate (PHB) Market Volume & Revenue, By Type, 2017 – 2022 58
TABLE NO. 7. : Key Raw Materials & Suppliers 59
TABLE NO. 8. : Global Powder Polyhydroxybutyrate (PHB) Market Volume & Revenue, By Region, 2017 – 2022 (Kilo Tons) (USD Million) 75
TABLE NO. 9. : Global Powder Polyhydroxybutyrate (PHB) Market Volume & Revenue, By Region, 2023– 2030 (Kilo Tons) (USD Million) 75
TABLE NO. 10. : Global Film Polyhydroxybutyrate (PHB) Market Volume & Revenue, By Region, 2017 – 2022 (Kilo Tons) (USD Million) 77
TABLE NO. 11. : Global Film Polyhydroxybutyrate (PHB) Market Volume & Revenue, By Region, 2023– 2030 (Kilo Tons) (USD Million) 77
TABLE NO. 12. : Global Sheet Polyhydroxybutyrate (PHB) Market Volume & Revenue, By Region, 2017 – 2022 (Kilo Tons) (USD Million) 79
TABLE NO. 13. : Global Sheet Polyhydroxybutyrate (PHB) Market Volume & Revenue, By Region, 2023– 2030 (Kilo Tons) (USD Million) 79
TABLE NO. 14. : Global Granules Polyhydroxybutyrate (PHB) Market Volume & Revenue, By Region, 2017 – 2022 (Kilo Tons) (USD Million) 81
TABLE NO. 15. : Global Granules Polyhydroxybutyrate (PHB) Market Volume & Revenue, By Region, 2023– 2030 (Kilo Tons) (USD Million) 81
TABLE NO. 16. : Global Others Polyhydroxybutyrate (PHB) Market Volume & Revenue, By Region, 2017 – 2022 (Kilo Tons) (USD Million) 83
TABLE NO. 17. : Global Others Polyhydroxybutyrate (PHB) Market Volume & Revenue, By Region, 2023– 2030 (Kilo Tons) (USD Million) 83
TABLE NO. 18. : Global Medical Devices Polyhydroxybutyrate (PHB) Market Volume & Revenue, By Region, 2017 – 2022 (Kilo Tons) (USD Million) 89
TABLE NO. 19. : Global Medical Devices Polyhydroxybutyrate (PHB) Market Volume & Revenue, By Region, 2023– 2030 (Kilo Tons) (USD Million) 89
TABLE NO. 20. : Global Mulch Films Polyhydroxybutyrate (PHB) Market Volume & Revenue, By Region, 2017 – 2022 (Kilo Tons) (USD Million) 91
TABLE NO. 21. : Global Mulch Films Polyhydroxybutyrate (PHB) Market Volume & Revenue, By Region, 2023– 2030 (Kilo Tons) (USD Million) 91
TABLE NO. 22. : Global Packaging Polyhydroxybutyrate (PHB) Market Volume & Revenue, By Region, 2017 – 2022 (Kilo Tons) (USD Million) 93
TABLE NO. 23. : Global Packaging Polyhydroxybutyrate (PHB) Market Volume & Revenue, By Region, 2023– 2030 (Kilo Tons) (USD Million) 93
TABLE NO. 24. : Global Consumer Good Polyhydroxybutyrate (PHB) Market Volume & Revenue, By Region, 2017 – 2022 (Kilo Tons) (USD Million) 95
TABLE NO. 25. : Global Consumer Good Polyhydroxybutyrate (PHB) Market Volume & Revenue, By Region, 2023– 2030 (Kilo Tons) (USD Million) 95
TABLE NO. 26. : Global Others Polyhydroxybutyrate (PHB) Market Volume & Revenue, By Region, 2017 – 2022 (Kilo Tons) (USD Million) 97
TABLE NO. 27. : Global Others Polyhydroxybutyrate (PHB) Market Volume & Revenue, By Region, 2023– 2030 (Kilo Tons) (USD Million) 97
TABLE NO. 28. : Global Food & Beverage Polyhydroxybutyrate (PHB) Market Volume & Revenue, By Region, 2017 – 2022 (Kilo Tons) (USD Million) 103
TABLE NO. 29. : Global Food & Beverage Polyhydroxybutyrate (PHB) Market Volume & Revenue, By Region, 2023– 2030 (Kilo Tons) (USD Million) 103
TABLE NO. 30. : Global Automotive Polyhydroxybutyrate (PHB) Market Volume & Revenue, By Region, 2017 – 2022 (Kilo Tons) (USD Million) 105
TABLE NO. 31. : Global Automotive Polyhydroxybutyrate (PHB) Market Volume & Revenue, By Region, 2023– 2030 (Kilo Tons) (USD Million) 105
TABLE NO. 32. : Global Pharmaceutical Polyhydroxybutyrate (PHB) Market Volume & Revenue, By Region, 2017 – 2022 (Kilo Tons) (USD Million) 107
TABLE NO. 33. : Global Pharmaceutical Polyhydroxybutyrate (PHB) Market Volume & Revenue, By Region, 2023– 2030 (Kilo Tons) (USD Million) 107
TABLE NO. 34. : Global Agriculture Polyhydroxybutyrate (PHB) Market Volume & Revenue, By Region, 2017 – 2022 (Kilo Tons) (USD Million) 109
TABLE NO. 35. : Global Agriculture Polyhydroxybutyrate (PHB) Market Volume & Revenue, By Region, 2023– 2030 (Kilo Tons) (USD Million) 109
TABLE NO. 36. : Global Others Polyhydroxybutyrate (PHB) Market Volume & Revenue, By Region, 2017 – 2022 (Kilo Tons) (USD Million) 111
TABLE NO. 37. : Global Others Polyhydroxybutyrate (PHB) Market Volume & Revenue, By Region, 2023– 2030 (Kilo Tons) (USD Million) 111
TABLE NO. 38. : Global Fermentation Polyhydroxybutyrate (PHB) Market Volume & Revenue, By Region, 2017 – 2022 (Kilo Tons) (USD Million) 117
TABLE NO. 39. : Global Fermentation Polyhydroxybutyrate (PHB) Market Volume & Revenue, By Region, 2023– 2030 (Kilo Tons) (USD Million) 117
TABLE NO. 40. : Global Chemical Synthesis Polyhydroxybutyrate (PHB) Market Volume & Revenue, By Region, 2017 – 2022 (Kilo Tons) (USD Million) 119
TABLE NO. 41. : Global Chemical Synthesis Polyhydroxybutyrate (PHB) Market Volume & Revenue, By Region, 2023– 2030 (Kilo Tons) (USD Million) 119
TABLE NO. 42. : Global Plant-Based PHB Polyhydroxybutyrate (PHB) Market Volume & Revenue, By Region, 2017 – 2022 (Kilo Tons) (USD Million) 125
TABLE NO. 43. : Global Plant-Based PHB Polyhydroxybutyrate (PHB) Market Volume & Revenue, By Region, 2023– 2030 (Kilo Tons) (USD Million) 125
TABLE NO. 44. : Global Microbial PHB Polyhydroxybutyrate (PHB) Market Volume & Revenue, By Region, 2017 – 2022 (Kilo Tons) (USD Million) 127
TABLE NO. 45. : Global Microbial PHB Polyhydroxybutyrate (PHB) Market Volume & Revenue, By Region, 2023– 2030 (Kilo Tons) (USD Million) 127
TABLE NO. 46. : Global Polyhydroxybutyrate (PHB) Market Volume & Revenue, By Region, 2017 – 2022 (Kilo Tons) (USD Million) 132
TABLE NO. 47. : Global Polyhydroxybutyrate (PHB) Market Volume & Revenue, By Region, 2023– 2030 (Kilo Tons) (USD Million) 132
TABLE NO. 48. : Global Polyhydroxybutyrate (PHB) Market Volume & Revenue, By Type, 2017 – 2022 (Kilo Tons) (USD Million) 133
TABLE NO. 49. : Global Polyhydroxybutyrate (PHB) Market Volume & Revenue, By Type, 2023– 2030 (Kilo Tons) (USD Million) 133
TABLE NO. 50. : Global Polyhydroxybutyrate (PHB) Market Volume & Revenue, By Application, 2017 – 2022 (Kilo Tons) (USD Million) 134
TABLE NO. 51. : Global Polyhydroxybutyrate (PHB) Market Volume & Revenue, By Application, 2023– 2030 (Kilo Tons) (USD Million) 134
TABLE NO. 52. : Global Polyhydroxybutyrate (PHB) Market Volume & Revenue, By End-user, 2017 – 2022 (Kilo Tons) (USD Million) 135
TABLE NO. 53. : Global Polyhydroxybutyrate (PHB) Market Volume & Revenue, By End-user, 2023– 2030 (Kilo Tons) (USD Million) 135
TABLE NO. 54. : Global Polyhydroxybutyrate (PHB) Market Volume & Revenue, By Production Process, 2017 – 2022 (Kilo Tons) (USD Million) 136
TABLE NO. 55. : Global Polyhydroxybutyrate (PHB) Market Volume & Revenue, By Production Process, 2023– 2030 (Kilo Tons) (USD Million) 136
TABLE NO. 56. : Global Polyhydroxybutyrate (PHB) Market Volume & Revenue, By Source, 2017 – 2022 (Kilo Tons) (USD Million) 137
TABLE NO. 57. : Global Polyhydroxybutyrate (PHB) Market Volume & Revenue, By Source, 2023– 2030 (Kilo Tons) (USD Million) 137
TABLE NO. 58. : North America Polyhydroxybutyrate (PHB) Market Volume, By Country, 2017 – 2022 (Kilo Tons) 139
TABLE NO. 59. : North America Polyhydroxybutyrate (PHB) Market Volume, By Country, 2023– 2030 (Kilo Tons) 139
TABLE NO. 60. : North America Polyhydroxybutyrate (PHB) Market Revenue, By Country, 2017 – 2022 (USD Million) 140
TABLE NO. 61. : North America Polyhydroxybutyrate (PHB) Market Revenue, By Country, 2023– 2030 (USD Million) 140
TABLE NO. 62. : North America Polyhydroxybutyrate (PHB) Market Volume, By Type, 2017 – 2022 (Kilo Tons) 141
TABLE NO. 63. : North America Polyhydroxybutyrate (PHB) Market Volume, By Type, 2023– 2030 (Kilo Tons) 141
TABLE NO. 64. : North America Polyhydroxybutyrate (PHB) Market Revenue, By Type, 2017 – 2022 (USD Million) 142
TABLE NO. 65. : North America Polyhydroxybutyrate (PHB) Market Revenue, By Type, 2023– 2030 (USD Million) 142
TABLE NO. 66. : North America Polyhydroxybutyrate (PHB) Market Volume, By Application, 2017 – 2022 (Kilo Tons) 143
TABLE NO. 67. : North America Polyhydroxybutyrate (PHB) Market Volume, By Application, 2023– 2030 (Kilo Tons) 143
TABLE NO. 68. : North America Polyhydroxybutyrate (PHB) Market Revenue, By Application, 2017 – 2022 (USD Million) 144
TABLE NO. 69. : North America Polyhydroxybutyrate (PHB) Market Revenue, By Application, 2023– 2030 (USD Million) 144
TABLE NO. 70. : North America Polyhydroxybutyrate (PHB) Market Volume, By End-user, 2017 – 2022 (Kilo Tons) 145
TABLE NO. 71. : North America Polyhydroxybutyrate (PHB) Market Volume, By End-user, 2023– 2030 (Kilo Tons) 145
TABLE NO. 72. : North America Polyhydroxybutyrate (PHB) Market Revenue, By End-user, 2017 – 2022 (USD Million) 146
TABLE NO. 73. : North America Polyhydroxybutyrate (PHB) Market Revenue, By End-user, 2023– 2030 (USD Million) 146
TABLE NO. 74. : North America Polyhydroxybutyrate (PHB) Market Volume, By Production Process, 2017 – 2022 (Kilo Tons) 147
TABLE NO. 75. : North America Polyhydroxybutyrate (PHB) Market Volume, By Production Process, 2023– 2030 (Kilo Tons) 147
TABLE NO. 76. : North America Polyhydroxybutyrate (PHB) Market Revenue, By Production Process, 2017 – 2022 (USD Million) 148
TABLE NO. 77. : North America Polyhydroxybutyrate (PHB) Market Revenue, By Production Process, 2023– 2030 (USD Million) 148
TABLE NO. 78. : North America Polyhydroxybutyrate (PHB) Market Volume, By Source, 2017 – 2022 (Kilo Tons) 149
TABLE NO. 79. : North America Polyhydroxybutyrate (PHB) Market Volume, By Source, 2023– 2030 (Kilo Tons) 149
TABLE NO. 80. : North America Polyhydroxybutyrate (PHB) Market Revenue, By Source, 2017 – 2022 (USD Million) 150
TABLE NO. 81. : North America Polyhydroxybutyrate (PHB) Market Revenue, By Source, 2023– 2030 (USD Million) 150
TABLE NO. 82. : Europe Polyhydroxybutyrate (PHB) Market Volume, By Country, 2017 – 2022 (Kilo Tons) 153
TABLE NO. 83. : Europe Polyhydroxybutyrate (PHB) Market Volume, By Country, 2023– 2030 (Kilo Tons) 153
TABLE NO. 84. : Europe Polyhydroxybutyrate (PHB) Market Revenue, By Country, 2017 – 2022 (USD Million) 154
TABLE NO. 85. : Europe Polyhydroxybutyrate (PHB) Market Revenue, By Country, 2023– 2030 (USD Million) 154
TABLE NO. 86. : Europe Polyhydroxybutyrate (PHB) Market Volume, By Type, 2017 – 2022 (Kilo Tons) 155
TABLE NO. 87. : Europe Polyhydroxybutyrate (PHB) Market Volume, By Type, 2023– 2030 (Kilo Tons) 155
TABLE NO. 88. : Europe Polyhydroxybutyrate (PHB) Market Revenue, By Type, 2017 – 2022 (USD Million) 156
TABLE NO. 89. : Europe Polyhydroxybutyrate (PHB) Market Revenue, By Type, 2023– 2030 (USD Million) 156
TABLE NO. 90. : Europe Polyhydroxybutyrate (PHB) Market Volume, By Application, 2017 – 2022 (Kilo Tons) 157
TABLE NO. 91. : Europe Polyhydroxybutyrate (PHB) Market Volume, By Application, 2023– 2030 (Kilo Tons) 157
TABLE NO. 92. : Europe Polyhydroxybutyrate (PHB) Market Revenue, By Application, 2017 – 2022 (USD Million) 158
TABLE NO. 93. : Europe Polyhydroxybutyrate (PHB) Market Revenue, By Application, 2023– 2030 (USD Million) 158
TABLE NO. 94. : Europe Polyhydroxybutyrate (PHB) Market Volume, By End-user, 2017 – 2022 (Kilo Tons) 159
TABLE NO. 95. : Europe Polyhydroxybutyrate (PHB) Market Volume, By End-user, 2023– 2030 (Kilo Tons) 159
TABLE NO. 96. : Europe Polyhydroxybutyrate (PHB) Market Revenue, By End-user, 2017 – 2022 (USD Million) 160
TABLE NO. 97. : Europe Polyhydroxybutyrate (PHB) Market Revenue, By End-user, 2023– 2030 (USD Million) 160
TABLE NO. 98. : Europe Polyhydroxybutyrate (PHB) Market Volume, By Production Process, 2017 – 2022 (Kilo Tons) 161
TABLE NO. 99. : Europe Polyhydroxybutyrate (PHB) Market Volume, By Production Process, 2023– 2030 (Kilo Tons) 161
TABLE NO. 100. : Europe Polyhydroxybutyrate (PHB) Market Revenue, By Production Process, 2017 – 2022 (USD Million) 162
TABLE NO. 101. : Europe Polyhydroxybutyrate (PHB) Market Revenue, By Production Process, 2023– 2030 (USD Million) 162
TABLE NO. 102. : Europe Polyhydroxybutyrate (PHB) Market Volume, By Source, 2017 – 2022 (Kilo Tons) 163
TABLE NO. 103. : Europe Polyhydroxybutyrate (PHB) Market Volume, By Source, 2023– 2030 (Kilo Tons) 163
TABLE NO. 104. : Europe Polyhydroxybutyrate (PHB) Market Revenue, By Source, 2017 – 2022 (USD Million) 164
TABLE NO. 105. : Europe Polyhydroxybutyrate (PHB) Market Revenue, By Source, 2023– 2030 (USD Million) 164
TABLE NO. 106. : Asia Pacific Polyhydroxybutyrate (PHB) Market Volume, By Country, 2017 – 2022 (Kilo Tons) 167
TABLE NO. 107. : Asia Pacific Polyhydroxybutyrate (PHB) Market Volume, By Country, 2023– 2030 (Kilo Tons) 167
TABLE NO. 108. : Asia Pacific Polyhydroxybutyrate (PHB) Market Revenue, By Country, 2017 – 2022 (USD Million) 168
TABLE NO. 109. : Asia Pacific Polyhydroxybutyrate (PHB) Market Revenue, By Country, 2023– 2030 (USD Million) 168
TABLE NO. 110. : Asia Pacific Polyhydroxybutyrate (PHB) Market Volume, By Type, 2017 – 2022 (Kilo Tons) 169
TABLE NO. 111. : Asia Pacific Polyhydroxybutyrate (PHB) Market Volume, By Type, 2023– 2030 (Kilo Tons) 169
TABLE NO. 112. : Asia Pacific Polyhydroxybutyrate (PHB) Market Revenue, By Type, 2017 – 2022 (USD Million) 170
TABLE NO. 113. : Asia Pacific Polyhydroxybutyrate (PHB) Market Revenue, By Type, 2023– 2030 (USD Million) 170
TABLE NO. 114. : Asia Pacific Polyhydroxybutyrate (PHB) Market Volume, By Application, 2017 – 2022 (Kilo Tons) 171
TABLE NO. 115. : Asia Pacific Polyhydroxybutyrate (PHB) Market Volume, By Application, 2023– 2030 (Kilo Tons) 171
TABLE NO. 116. : Asia Pacific Polyhydroxybutyrate (PHB) Market Revenue, By Application, 2017 – 2022 (USD Million) 172
TABLE NO. 117. : Asia Pacific Polyhydroxybutyrate (PHB) Market Revenue, By Application, 2023– 2030 (USD Million) 172
TABLE NO. 118. : Asia Pacific Polyhydroxybutyrate (PHB) Market Volume, By End-user, 2017 – 2022 (Kilo Tons) 173
TABLE NO. 119. : Asia Pacific Polyhydroxybutyrate (PHB) Market Volume, By End-user, 2023– 2030 (Kilo Tons) 173
TABLE NO. 120. : Asia Pacific Polyhydroxybutyrate (PHB) Market Revenue, By End-user, 2017 – 2022 (USD Million) 174
TABLE NO. 121. : Asia Pacific Polyhydroxybutyrate (PHB) Market Revenue, By End-user, 2023– 2030 (USD Million) 174
TABLE NO. 122. : Asia Pacific Polyhydroxybutyrate (PHB) Market Volume, By Production Process, 2017 – 2022 (Kilo Tons) 175
TABLE NO. 123. : Asia Pacific Polyhydroxybutyrate (PHB) Market Volume, By Production Process, 2023– 2030 (Kilo Tons) 175
TABLE NO. 124. : Asia Pacific Polyhydroxybutyrate (PHB) Market Revenue, By Production Process, 2017 – 2022 (USD Million) 176
TABLE NO. 125. : Asia Pacific Polyhydroxybutyrate (PHB) Market Revenue, By Production Process, 2023– 2030 (USD Million) 176
TABLE NO. 126. : Asia Pacific Polyhydroxybutyrate (PHB) Market Volume, By Source, 2017 – 2022 (Kilo Tons) 177
TABLE NO. 127. : Asia Pacific Polyhydroxybutyrate (PHB) Market Volume, By Source, 2023– 2030 (Kilo Tons) 177
TABLE NO. 128. : Asia Pacific Polyhydroxybutyrate (PHB) Market Revenue, By Source, 2017 – 2022 (USD Million) 178
TABLE NO. 129. : Asia Pacific Polyhydroxybutyrate (PHB) Market Revenue, By Source, 2023– 2030 (USD Million) 178
TABLE NO. 130. : Latin America Polyhydroxybutyrate (PHB) Market Volume, By Country, 2017 – 2022 (Kilo Tons) 181
TABLE NO. 131. : Latin America Polyhydroxybutyrate (PHB) Market Volume, By Country, 2023– 2030 (Kilo Tons) 181
TABLE NO. 132. : Latin America Polyhydroxybutyrate (PHB) Market Revenue, By Country, 2017 – 2022 (USD Million) 182
TABLE NO. 133. : Latin America Polyhydroxybutyrate (PHB) Market Revenue, By Country, 2023– 2030 (USD Million) 182
TABLE NO. 134. : Latin America Polyhydroxybutyrate (PHB) Market Volume, By Type, 2017 – 2022 (Kilo Tons) 183
TABLE NO. 135. : Latin America Polyhydroxybutyrate (PHB) Market Volume, By Type, 2023– 2030 (Kilo Tons) 183
TABLE NO. 136. : Latin America Polyhydroxybutyrate (PHB) Market Revenue, By Type, 2017 – 2022 (USD Million) 184
TABLE NO. 137. : Latin America Polyhydroxybutyrate (PHB) Market Revenue, By Type, 2023– 2030 (USD Million) 184
TABLE NO. 138. : Latin America Polyhydroxybutyrate (PHB) Market Volume, By Application, 2017 – 2022 (Kilo Tons) 185
TABLE NO. 139. : Latin America Polyhydroxybutyrate (PHB) Market Volume, By Application, 2023– 2030 (Kilo Tons) 185
TABLE NO. 140. : Latin America Polyhydroxybutyrate (PHB) Market Revenue, By Application, 2017 – 2022 (USD Million) 186
TABLE NO. 141. : Latin America Polyhydroxybutyrate (PHB) Market Revenue, By Application, 2023– 2030 (USD Million) 186
TABLE NO. 142. : Latin America Polyhydroxybutyrate (PHB) Market Volume, By End-user, 2017 – 2022 (Kilo Tons) 187
TABLE NO. 143. : Latin America Polyhydroxybutyrate (PHB) Market Volume, By End-user, 2023– 2030 (Kilo Tons) 187
TABLE NO. 144. : Latin America Polyhydroxybutyrate (PHB) Market Revenue, By End-user, 2017 – 2022 (USD Million) 188
TABLE NO. 145. : Latin America Polyhydroxybutyrate (PHB) Market Revenue, By End-user, 2023– 2030 (USD Million) 188
TABLE NO. 146. : Latin America Polyhydroxybutyrate (PHB) Market Volume, By Production Process, 2017 – 2022 (Kilo Tons) 189
TABLE NO. 147. : Latin America Polyhydroxybutyrate (PHB) Market Volume, By Production Process, 2023– 2030 (Kilo Tons) 189
TABLE NO. 148. : Latin America Polyhydroxybutyrate (PHB) Market Revenue, By Production Process, 2017 – 2022 (USD Million) 190
TABLE NO. 149. : Latin America Polyhydroxybutyrate (PHB) Market Revenue, By Production Process, 2023– 2030 (USD Million) 190
TABLE NO. 150. : Latin America Polyhydroxybutyrate (PHB) Market Volume, By Source, 2017 – 2022 (Kilo Tons) 191
TABLE NO. 151. : Latin America Polyhydroxybutyrate (PHB) Market Volume, By Source, 2023– 2030 (Kilo Tons) 191
TABLE NO. 152. : Latin America Polyhydroxybutyrate (PHB) Market Revenue, By Source, 2017 – 2022 (USD Million) 192
TABLE NO. 153. : Latin America Polyhydroxybutyrate (PHB) Market Revenue, By Source, 2023– 2030 (USD Million) 192
TABLE NO. 154. : Middle East Polyhydroxybutyrate (PHB) Market Volume, By Country, 2017 – 2022 (Kilo Tons) 195
TABLE NO. 155. : Middle East Polyhydroxybutyrate (PHB) Market Volume, By Country, 2023– 2030 (Kilo Tons) 195
TABLE NO. 156. : Middle East Polyhydroxybutyrate (PHB) Market Revenue, By Country, 2017 – 2022 (USD Million) 196
TABLE NO. 157. : Middle East Polyhydroxybutyrate (PHB) Market Revenue, By Country, 2023– 2030 (USD Million) 196
TABLE NO. 158. : Middle East Polyhydroxybutyrate (PHB) Market Volume, By Type, 2017 – 2022 (Kilo Tons) 197
TABLE NO. 159. : Middle East Polyhydroxybutyrate (PHB) Market Volume, By Type, 2023– 2030 (Kilo Tons) 197
TABLE NO. 160. : Middle East Polyhydroxybutyrate (PHB) Market Revenue, By Type, 2017 – 2022 (USD Million) 198
TABLE NO. 161. : Middle East Polyhydroxybutyrate (PHB) Market Revenue, By Type, 2023– 2030 (USD Million) 198
TABLE NO. 162. : Middle East Polyhydroxybutyrate (PHB) Market Volume, By Application, 2017 – 2022 (Kilo Tons) 199
TABLE NO. 163. : Middle East Polyhydroxybutyrate (PHB) Market Volume, By Application, 2023– 2030 (Kilo Tons) 199
TABLE NO. 164. : Middle East Polyhydroxybutyrate (PHB) Market Revenue, By Application, 2017 – 2022 (USD Million) 200
TABLE NO. 165. : Middle East Polyhydroxybutyrate (PHB) Market Revenue, By Application, 2023– 2030 (USD Million) 200
TABLE NO. 166. : Middle East Polyhydroxybutyrate (PHB) Market Volume, By End-user, 2017 – 2022 (Kilo Tons) 201
TABLE NO. 167. : Middle East Polyhydroxybutyrate (PHB) Market Volume, By End-user, 2023– 2030 (Kilo Tons) 201
TABLE NO. 168. : Middle East Polyhydroxybutyrate (PHB) Market Revenue, By End-user, 2017 – 2022 (USD Million) 202
TABLE NO. 169. : Middle East Polyhydroxybutyrate (PHB) Market Revenue, By End-user, 2023– 2030 (USD Million) 202
TABLE NO. 170. : Middle East Polyhydroxybutyrate (PHB) Market Volume, By Production Process, 2017 – 2022 (Kilo Tons) 203
TABLE NO. 171. : Middle East Polyhydroxybutyrate (PHB) Market Volume, By Production Process, 2023– 2030 (Kilo Tons) 203
TABLE NO. 172. : Middle East Polyhydroxybutyrate (PHB) Market Revenue, By Production Process, 2017 – 2022 (USD Million) 204
TABLE NO. 173. : Middle East Polyhydroxybutyrate (PHB) Market Revenue, By Production Process, 2023– 2030 (USD Million) 204
TABLE NO. 174. : Middle East Polyhydroxybutyrate (PHB) Market Volume, By Source, 2017 – 2022 (Kilo Tons) 205
TABLE NO. 175. : Middle East Polyhydroxybutyrate (PHB) Market Volume, By Source, 2023– 2030 (Kilo Tons) 205
TABLE NO. 176. : Middle East Polyhydroxybutyrate (PHB) Market Revenue, By Source, 2017 – 2022 (USD Million) 206
TABLE NO. 177. : Middle East Polyhydroxybutyrate (PHB) Market Revenue, By Source, 2023– 2030 (USD Million) 206
TABLE NO. 178. : Africa Polyhydroxybutyrate (PHB) Market Volume, By Country, 2017 – 2022 (Kilo Tons) 209
TABLE NO. 179. : Africa Polyhydroxybutyrate (PHB) Market Volume, By Country, 2023– 2030 (Kilo Tons) 209
TABLE NO. 180. : Africa Polyhydroxybutyrate (PHB) Market Revenue, By Country, 2017 – 2022 (USD Million) 210
TABLE NO. 181. : Africa Polyhydroxybutyrate (PHB) Market Revenue, By Country, 2023– 2030 (USD Million) 210
TABLE NO. 182. : Africa Polyhydroxybutyrate (PHB) Market Volume, By Type, 2017 – 2022 (Kilo Tons) 211
TABLE NO. 183. : Africa Polyhydroxybutyrate (PHB) Market Volume, By Type, 2023– 2030 (Kilo Tons) 211
TABLE NO. 184. : Africa Polyhydroxybutyrate (PHB) Market Revenue, By Type, 2017 – 2022 (USD Million) 212
TABLE NO. 185. : Africa Polyhydroxybutyrate (PHB) Market Revenue, By Type, 2023– 2030 (USD Million) 212
TABLE NO. 186. : Africa Polyhydroxybutyrate (PHB) Market Volume, By Application, 2017 – 2022 (Kilo Tons) 213
TABLE NO. 187. : Africa Polyhydroxybutyrate (PHB) Market Volume, By Application, 2023– 2030 (Kilo Tons) 213
TABLE NO. 188. : Africa Polyhydroxybutyrate (PHB) Market Revenue, By Application, 2017 – 2022 (USD Million) 214
TABLE NO. 189. : Africa Polyhydroxybutyrate (PHB) Market Revenue, By Application, 2023– 2030 (USD Million) 214
TABLE NO. 190. : Africa Polyhydroxybutyrate (PHB) Market Volume, By End-user, 2017 – 2022 (Kilo Tons) 215
TABLE NO. 191. : Africa Polyhydroxybutyrate (PHB) Market Volume, By End-user, 2023– 2030 (Kilo Tons) 215
TABLE NO. 192. : Africa Polyhydroxybutyrate (PHB) Market Revenue, By End-user, 2017 – 2022 (USD Million) 216
TABLE NO. 193. : Africa Polyhydroxybutyrate (PHB) Market Revenue, By End-user, 2023– 2030 (USD Million) 216
TABLE NO. 194. : Africa Polyhydroxybutyrate (PHB) Market Volume, By Production Process, 2017 – 2022 (Kilo Tons) 217
TABLE NO. 195. : Africa Polyhydroxybutyrate (PHB) Market Volume, By Production Process, 2023– 2030 (Kilo Tons) 217
TABLE NO. 196. : Africa Polyhydroxybutyrate (PHB) Market Revenue, By Production Process, 2017 – 2022 (USD Million) 218
TABLE NO. 197. : Africa Polyhydroxybutyrate (PHB) Market Revenue, By Production Process, 2023– 2030 (USD Million) 218
TABLE NO. 198. : Africa Polyhydroxybutyrate (PHB) Market Volume, By Source, 2017 – 2022 (Kilo Tons) 219
TABLE NO. 199. : Africa Polyhydroxybutyrate (PHB) Market Volume, By Source, 2023– 2030 (Kilo Tons) 219
TABLE NO. 200. : Africa Polyhydroxybutyrate (PHB) Market Revenue, By Source, 2017 – 2022 (USD Million) 220
TABLE NO. 201. : Africa Polyhydroxybutyrate (PHB) Market Revenue, By Source, 2023– 2030 (USD Million) 220