Market Overview
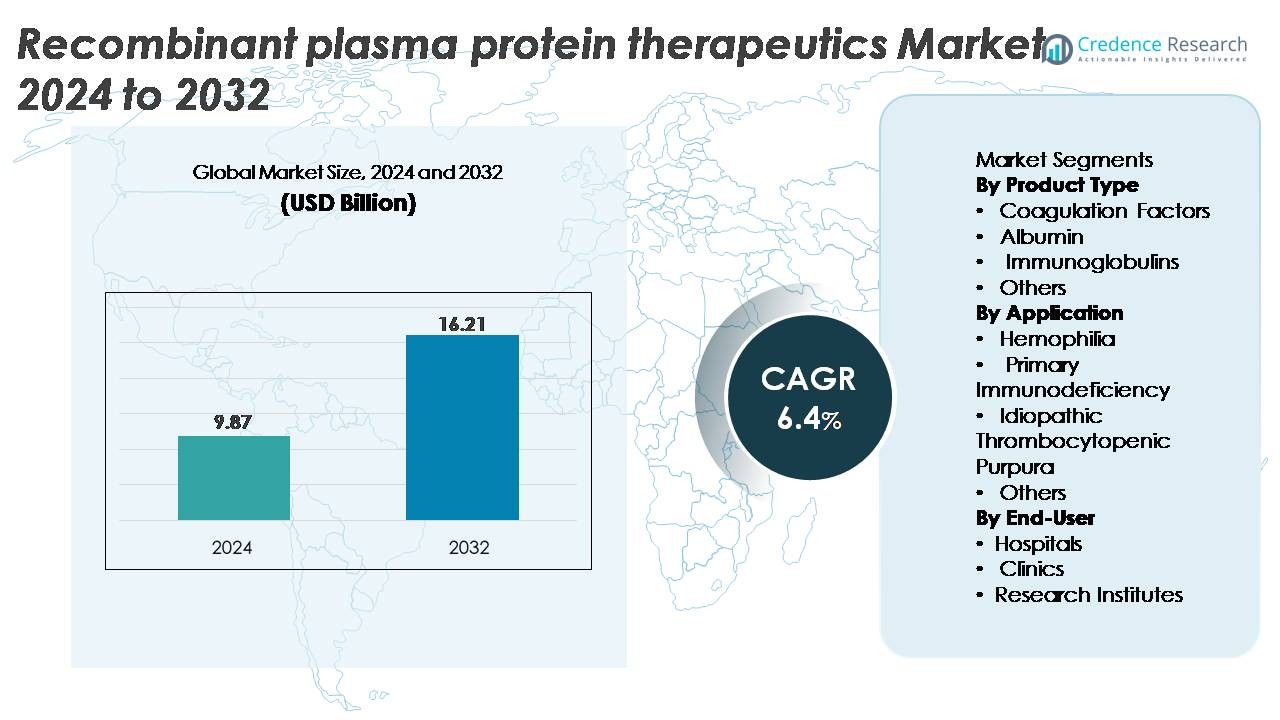
The global recombinant plasma protein therapeutics market was valued at USD 9.87 billion in 2024 and is projected to reach USD 16.21 billion by 2032, expanding at a CAGR of 6.4% during the forecast period.
| REPORT ATTRIBUTE |
DETAILS |
| Historical Period |
2020-2023 |
| Base Year |
2024 |
| Forecast Period |
2025-2032 |
| Recombinant Plasma Protein Therapeutics Market Size 2024 |
USD 9.87 Billion |
| Recombinant Plasma Protein Therapeutics Market, CAGR |
6.4% |
| Recombinant Plasma Protein Therapeutics Market Size 2032 |
USD 16.21 Billion |
The recombinant plasma protein therapeutics market is shaped by leading global players such as Octapharma AG, Baxter International Inc., Sanquin Blood Supply Foundation, CSL Behring, LFB S.A., China Biologic Products Holdings, Inc., Grifols S.A., Kedrion Biopharma Inc., Biotest AG, and Shire Plc. These companies dominate through strong bioprocessing capabilities, extensive product portfolios in recombinant coagulation factors and immunoglobulins, and continuous investment in advanced protein engineering. North America remains the leading region with approximately 38% market share, driven by high treatment uptake, strong reimbursement frameworks, and robust R&D infrastructure, followed by Europe and Asia-Pacific as key growth contributors.
Access crucial information at unmatched prices!
Request your sample report today & start making informed decisions powered by Credence Research Inc.!
Download Sample
Market Insights
- The recombinant plasma protein therapeutics market was valued at USD 9.87 billion in 2024 and is projected to reach USD 16.21 billion by 2032, growing at a CAGR of 6.4%.
- Demand is driven by the rising prevalence of hemophilia and primary immunodeficiency, with coagulation factors emerging as the dominant product segment due to strong adoption of recombinant Factor VIII and IX therapies.
- Key trends include the shift toward long-acting recombinant proteins, expanding biosimilar pipelines, and the integration of advanced bioprocessing technologies that improve purity, yield, and batch consistency.
- Competitive intensity remains high, with players such as CSL Behring, Grifols, Octapharma, and Baxter expanding manufacturing capacity, while cost pressures and stringent quality regulations act as major restraints.
- Regionally, North America leads with around 38% share, followed by Europe at 28% and Asia-Pacific at 22%, supported by advancements in clinical infrastructure and increasing access to recombinant therapies.
Market Segmentation Analysis:
By Product Type:
Coagulation factors represent the dominant sub-segment, accounting for the largest market share owing to their critical role in treating hemophilia A and B, von Willebrand disease, and rare bleeding disorders. Recombinant Factor VIII and IX products continue to gain traction due to their pathogen-free profiles, extended half-life formulations, and reduced dosing frequency. Albumin and immunoglobulins also show steady uptake, supported by their expanding therapeutic applications in trauma care, immune deficiencies, and autoimmune conditions. Meanwhile, specialized recombinant proteins in the “Others” category are gradually emerging as R&D pipelines broaden across niche therapeutic areas.
- For instance, CSL’s recombinant rFVIII therapy Afstyla showed a median annualized bleeding rate (ABR) of 1.14 in prophylaxis patients in its pivotal trials, while Octapharma’s Nuwiq demonstrated a median spontaneous ABR of 0.0 in long-term prophylaxis studies.
By Application:
Hemophilia remains the leading application segment, holding the highest share driven by consistent demand for recombinant coagulation factors and increasing adoption of long-acting and non-factor therapies. Advancements in recombinant technology, improved safety profiles, and expanded newborn screening programs further strengthen segment growth. Primary immunodeficiency follows as an important application area supported by rising diagnosis rates and the need for regular immunoglobulin replacement. Meanwhile, idiopathic thrombocytopenic purpura and other rare conditions benefit from tailored recombinant proteins that offer higher purity, reduced infection risk, and improved treatment consistency.
- For instance, Sanofi/Sobi’s recombinant Factor IX therapy Alprolix reported a median annualized bleeding rate (ABR) of 2.95 in adults and adolescents receiving individualized prophylaxis in pivotal trials, while the spontaneous median ABR was 1.0. CSL Behring’s Idelvion achieved extended dosing intervals of up to 14 days in clinical studies, supported by sustained FIX activity and stable trough levels.
By End-User:
Hospitals constitute the dominant end-user segment, capturing the largest share due to high patient inflow, availability of advanced infusion capabilities, and the need for specialized oversight during recombinant protein administration. Hospitals also lead adoption because they conduct the majority of hemophilia and immunodeficiency management protocols, often supported by comprehensive care centers. Clinics demonstrate rising usage as outpatient infusion models expand and home-care-supported therapies evolve. Research institutes contribute a smaller but growing share of demand as they undertake bioprocessing innovation, recombinant protein engineering, and clinical evaluation of next-generation therapeutic candidates.
Key Growth Drivers
Increasing Prevalence of Hemophilia and Immunodeficiency Disorders
The rising global incidence of hemophilia A, hemophilia B, and primary immunodeficiency disorders serves as a major driver for recombinant plasma protein therapeutics. Hemophilia treatment continues shifting from plasma-derived to recombinant coagulation factors due to their superior safety profiles, lower pathogen-transmission risk, and improved pharmacokinetics. Expanded newborn screening, earlier diagnosis, and growing awareness campaigns have significantly increased patient identification and long-term therapeutic demand. Immunoglobulin use for immunodeficiency management is also rising as clinicians favor recombinant alternatives that offer higher purity and consistent batch performance. In addition, the expanding patient pool in emerging economies supported by national hemophilia programs, improved healthcare infrastructure, and global foundations providing diagnostic and treatment support further accelerates adoption. Together, these factors create a sustained and predictable demand curve for recombinant proteins across major therapeutic areas.
· For instance, Octapharma’s recombinant FVIII Nuwiq demonstrated a median spontaneous annualized bleeding rate (sABR) of 0.0 in pivotal prophylaxis studies, confirming strong bleed protection. Meanwhile, CSL Behring’s recombinant FIX Idelvion (albutrepenonacog alfa) maintained mean steady-state FIX trough levels of about 14 IU/dL with activity remaining above 5 IU/dL for up to 14 days in many adult patients, supporting reliable efficacy at extended dosing intervals.
Advancements in Recombinant DNA Engineering and Bioprocessing
Rapid progress in recombinant DNA engineering and upstream–downstream bioprocessing technologies is significantly enhancing the efficiency and scalability of recombinant plasma protein production. The introduction of advanced mammalian expression systems, high-throughput cell line development, perfusion bioreactors, and optimized purification processes has improved protein yield, stability, and consistency. Extended half-life coagulation factors, engineered immunoglobulin fragments, and next-generation albumin fusion proteins demonstrate how precision protein engineering is reshaping therapeutic performance. Manufacturers are increasingly leveraging glycoengineering and controlled post-translational modification to improve bioactivity and reduce immunogenicity. These innovations shorten production cycles, reduce contamination risk, and ensure reproducible molecule quality key attributes for chronic disease therapies requiring long-term dosing. Continuous manufacturing and single-use technologies further lower operational costs, making recombinant products more affordable and increasing their adoption across global healthcare systems.
· For instance, CSL Behring’s Idelvion (rFIX-FP) demonstrated FIX recovery values of about 1.4 IU/dL per IU/kg in adult patients, confirming enhanced bioavailability and prolonged circulation. Meanwhile, Grifols’ large-scale plasma bioprocessing network includes facilities such as its Clayton, North Carolina plant with a fractionation capacity of approximately 6 million liters per year supporting high-volume plasma-derived protein production, though not recombinant manufacturing.
Expanding Clinical Applications and Strong Regulatory Support
The widening clinical applicability of recombinant proteins beyond traditional hematology and immunology is a strong growth catalyst for the market. Recombinant albumin is gaining momentum in advanced drug delivery systems, vaccine formulation, and cell and gene therapy manufacturing due to its stability and binding properties. Immunoglobulins are increasingly being used in autoimmune disorders, neuropathies, and inflammatory conditions, expanding their therapeutic footprint. At the same time, global regulatory agencies provide strong support for recombinant therapeutics through expedited approvals, orphan drug designations, and incentives for rare disease treatments. Clear regulatory pathways for biosimilars also enhance competition and increase patient access to high-quality alternatives. As healthcare systems prioritize safety and disease-specific precision therapies, recombinant plasma proteins are well-positioned to meet the demand for high-purity, consistent, and pathogen-free biologic solutions.
Key Trends & Opportunities
Growth of Long-Acting and Gene-Integrated Therapeutic Platforms
A major trend shaping the recombinant plasma protein therapeutics market is the rise of long-acting protein formulations and gene-integrated treatment approaches. Extended half-life recombinant coagulation factors, enabled through PEGylation, Fc fusion, or albumin-fusion engineering, reduce infusion frequency and enhance patient adherence. These innovations particularly benefit hemophilia patients who previously required multiple weekly injections. Meanwhile, the intersection of recombinant protein therapeutics with advanced gene and cell therapy platforms is creating new opportunities for functional cures rather than episodic treatments. Gene-edited cell lines, CRISPR-enabled expression models, and recombinant proteins used as vectors or stabilizers in gene therapy manufacturing are expanding the scope of commercial applications. As precision medicine advances rapidly, recombinant proteins will increasingly serve as both therapeutic agents and enabling bioprocessing components.
· For instance, Novo Nordisk’s Esperoct (turoctocog alfa pegol) achieved a 1.6-fold increase in FVIII half-life over standard recombinant FVIII in clinical studies, enabling less frequent dosing while maintaining strong prophylactic bleed protection.
Rising Shift Toward Biosimilars and Cost-Effective Recombinant Alternatives
Growing healthcare cost pressures worldwide are accelerating the adoption of biosimilar recombinant plasma proteins, creating major opportunities for manufacturers. As patents for several first-generation coagulation factors and immunoglobulin products expire, biosimilar developers are entering the market with competitive pricing and improved formulation technologies. Regulatory bodies in the U.S., EU, and Asia have streamlined biosimilar approval frameworks, making pathways more predictable and commercially viable. Healthcare providers are increasingly transitioning from plasma-derived products to biosimilars due to lower infection risk, higher purity, and consistent batch-to-batch performance. In emerging markets, government-backed reimbursement policies and domestic biomanufacturing expansion further support large-scale biosimilar penetration. This trend positions cost-optimized recombinant solutions as central to long-term market growth.
· For instance, AryoGen Pharmed’s biosimilar recombinant Factor VIIa (AryoSeven, eptacog alfa biosimilar) is approved in Iran for the treatment of bleeding episodes in hemophilia A or B patients with inhibitors, congenital Factor VII deficiency, and Glanzmann’s thrombasthenia with refractoriness to platelet transfusion demonstrating comparable efficacy and safety to the reference rFVIIa.
Key Challenges
High Manufacturing Costs and Complex Production Requirements
The production of recombinant plasma proteins involves highly complex bioprocessing steps, which significantly raise manufacturing costs and create barriers to large-scale commercialization. Mammalian cell expression systems require strict environmental control, intensive cell culture optimization, and sophisticated purification steps to maintain protein stability and bioactivity. Any variability in post-translational modifications or contamination risks can render entire batches unusable, resulting in substantial financial loss. The capital investment required for bioreactors, quality control labs, GMP-certified facilities, and cold-chain logistics further adds to the cost burden. These challenges restrict market entry for smaller players and limit affordability in developing regions, slowing global penetration despite rising therapeutic demand.
Regulatory Complexity and Stringent Quality Assurance Standards
Recombinant plasma proteins are subject to some of the most stringent regulatory and quality assurance frameworks in the biopharmaceutical sector. Ensuring consistent glycosylation patterns, purity profiles, and immunogenicity levels requires exhaustive validation and real-time monitoring throughout the production cycle. Regulatory agencies mandate extensive clinical trials, risk-management plans, batch documentation, and post-marketing safety surveillance. Any deviation or quality failure can result in manufacturing shutdowns or product recalls, affecting supply reliability and financial performance. Additionally, the regulatory environment for biosimilars while improving remains complex due to the requirement of demonstrating molecular comparability, functional equivalence, and clinical non-inferiority. These challenges demand significant technical expertise, time, and investment from manufacturers.
Regional Analysis
North America
North America holds the dominant share of around 38%, driven by high diagnosis rates of hemophilia and primary immunodeficiency disorders, strong reimbursement frameworks, and widespread adoption of recombinant coagulation factors and immunoglobulins. The U.S. leads regional demand due to its advanced biomanufacturing capabilities, robust clinical infrastructure, and the presence of leading recombinant protein developers. Continuous FDA approvals of next-generation long-acting factors, strong patient assistance programs, and active hemophilia treatment centers support sustained uptake. Strategic partnerships between biotechnology firms and research institutes further accelerate innovation and reinforce the region’s market leadership.
Europe
Europe accounts for approximately 28% of the market, supported by comprehensive national hemophilia registries, structured treatment guidelines, and broad access to recombinant therapeutics. Countries such as Germany, France, the U.K., and the Nordics show strong adoption due to well-established reimbursement pathways and high standards for blood safety, favoring recombinant over plasma-derived proteins. The EU’s regulatory emphasis on biosimilars also encourages competitive pricing and wider product availability. Additionally, the region benefits from active R&D clusters specializing in protein engineering, enabling steady introduction of improved formulations and driving stable demand across major therapeutic indications.
Asia-Pacific
Asia-Pacific represents roughly 22% of the global market and is the fastest-expanding region due to rising awareness of hemophilia care, better diagnostic penetration, and expanding healthcare infrastructure in China, India, South Korea, and Japan. Government-funded rare disease programs and improved access to immunoglobulin therapies are boosting recombinant uptake. Domestic biopharmaceutical manufacturing is growing, particularly in China, which strengthens supply capacity and reduces reliance on imports. As national hemophilia foundations expand support networks and clinical guidelines increasingly favor recombinant options, the region is positioned for strong long-term growth in therapeutic adoption.
Latin America
Latin America captures around 7% of the market, driven by gradual improvements in treatment access and government-led initiatives aimed at expanding hemophilia management programs. Brazil and Mexico lead adoption as they increase procurement of recombinant factors to improve patient outcomes and reduce reliance on plasma-derived alternatives. However, budget constraints and uneven healthcare coverage limit uniform access across the region. Continued expansion of public tenders, partnerships with global pharmaceutical companies, and improving regulatory harmonization are expected to strengthen recombinant product availability and enhance overall market performance in the coming years.
Middle East & Africa
The Middle East & Africa region accounts for approximately 5% of the market, influenced by growing investments in specialty care and improved diagnostic capabilities in Gulf nations such as Saudi Arabia and the UAE. Access to recombinant therapies remains limited in several African countries due to cost barriers and supply constraints, with plasma-derived proteins still dominating in lower-income settings. Nevertheless, targeted government funding, international NGO support, and improvements in treatment centers are gradually increasing utilization. As healthcare reforms progress and rare disease registries expand, the region is expected to demonstrate steady but moderate growth.
Market Segmentations:
By Product Type
- Coagulation Factors
- Albumin
- Immunoglobulins
- Others
By Application
- Hemophilia
- Primary Immunodeficiency
- Idiopathic Thrombocytopenic Purpura
- Others
By End-User
- Hospitals
- Clinics
- Research Institutes
By Geography
- North America
- Europe
- Germany
- France
- U.K.
- Italy
- Spain
- Rest of Europe
- Asia Pacific
- China
- Japan
- India
- South Korea
- South-east Asia
- Rest of Asia Pacific
- Latin America
- Brazil
- Argentina
- Rest of Latin America
- Middle East & Africa
- GCC Countries
- South Africa
- Rest of the Middle East and Africa
Competitive Landscape
The recombinant plasma protein therapeutics market features a moderately consolidated competitive landscape led by global biopharmaceutical companies specializing in advanced recombinant coagulation factors, immunoglobulins, and albumin products. Major players focus heavily on R&D investments to develop extended half-life factors, engineered immunoglobulin formulations, and high-purity recombinant proteins with improved stability and reduced immunogenicity. Strategic collaborations with clinical research centers, expansion of manufacturing capacity using high-efficiency mammalian expression systems, and regulatory approvals for next-generation therapies strengthen competitive positioning. Companies are also accelerating biosimilar development to capture emerging cost-sensitive markets, while established brands prioritize lifecycle management and post-approval clinical programs. Geographic expansion across Asia-Pacific and Latin America, coupled with investment in cold-chain logistics and hospital outreach programs, further enhances market penetration. Overall, competition is driven by innovation in protein engineering, capability in large-scale bioprocessing, and the ability to meet growing clinical demand for safe and consistent recombinant alternatives to plasma-derived products.
Shape Your Report to Specific Countries or Regions & Enjoy 30% Off!
Key Player Analysis
- Octapharma AG
- Baxter International Inc.
- Sanquin Blood Supply Foundation
- CSL Behring
- LFB S.A.
- China Biologic Products Holdings, Inc.
- Grifols S.A.
- Kedrion Biopharma Inc.
- Biotest AG
- Shire Plc
Recent Developments
- In June 2024, Octapharma presented new clinical and scientific data for its recombinant products Nuwiq and wilate at the ISTH 2024 Congress.
- In March 2024, Sanquin reiterated its role in supporting safe blood supply and advancing blood-derived and recombinant therapies, reflecting ongoing public-health and supply-chain initiatives.
Report Coverage
The research report offers an in-depth analysis based on Product type, Application, End-User and Geography. It details leading market players, providing an overview of their business, product offerings, investments, revenue streams, and key applications. Additionally, the report includes insights into the competitive environment, SWOT analysis, current market trends, as well as the primary drivers and constraints. Furthermore, it discusses various factors that have driven market expansion in recent years. The report also explores market dynamics, regulatory scenarios, and technological advancements that are shaping the industry. It assesses the impact of external factors and global economic changes on market growth. Lastly, it provides strategic recommendations for new entrants and established companies to navigate the complexities of the market.
Future Outlook
- Demand for recombinant coagulation factors will continue rising as countries expand national hemophilia registries and shift away from plasma-derived products.
- Long-acting recombinant proteins will gain broader adoption due to reduced dosing frequency and improved patient adherence.
- Biosimilar recombinant therapies will accelerate market penetration, especially in cost-sensitive regions.
- Advances in protein engineering will enhance stability, purity, and clinical performance across next-generation products.
- Integration of recombinant proteins into gene and cell therapy workflows will expand new therapeutic applications.
- Emerging markets will experience faster uptake driven by improved diagnostic capabilities and government-supported rare disease programs.
- Manufacturers will invest heavily in high-efficiency bioreactors and continuous manufacturing to scale production.
- Regulatory agencies will streamline approval pathways for recombinant and biosimilar variants, improving market accessibility.
- Partnerships between biotech firms and academic research centers will expand innovation pipelines.
- Global healthcare systems will prioritize pathogen-free recombinant therapies to improve long-term treatment safety.


