| REPORT ATTRIBUTE |
DETAILS |
| Historical Period |
2020-2023 |
| Base Year |
2024 |
| Forecast Period |
2025-2032 |
| Revenue Assurance Market Size 2024 |
USD 6,323.24 Million |
| Revenue Assurance Market, CAGR |
11.47% |
| Revenue Assurance Market Size 2032 |
USD 15,021.36 Million |
Market Overview:
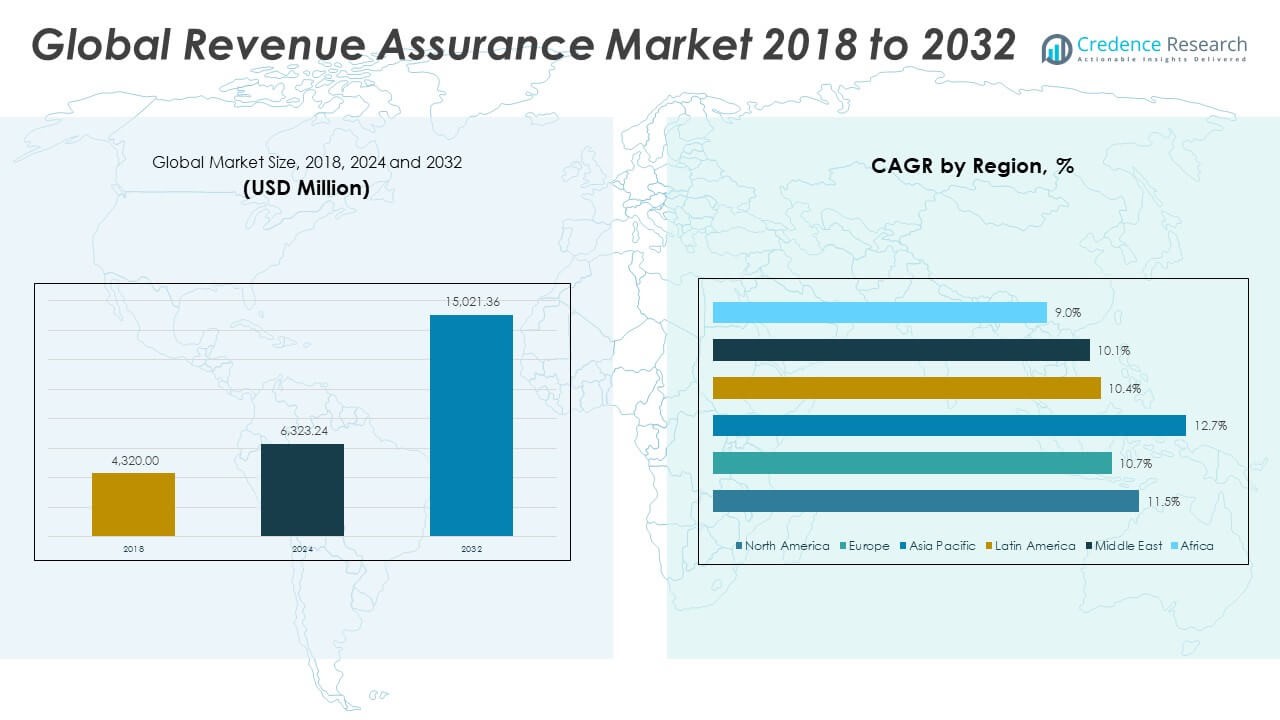
The Revenue Assurance Market size was valued at USD 4,320.00 million in 2018 to USD 6,323.24 million in 2024 and is anticipated to reach USD 15,021.36 million by 2032, at a CAGR of 11.47% during the forecast period.
The Revenue Assurance Market is experiencing strong momentum due to the rising complexity of billing systems across industries such as telecommunications, utilities, and financial services. Organizations are increasingly facing revenue leakage caused by billing errors, fraudulent activities, and system inefficiencies. To address these issues, businesses are adopting advanced revenue assurance solutions that ensure accurate revenue recognition and loss prevention. The integration of artificial intelligence and machine learning has enhanced the ability to detect anomalies in real time, making assurance processes more proactive and efficient. Cloud-based deployments are gaining popularity due to their scalability and ease of integration with existing systems. As companies shift toward digital and subscription-based models, revenue assurance tools are becoming essential for managing large volumes of transactional data. Moreover, growing regulatory scrutiny around revenue reporting is compelling enterprises to implement robust compliance frameworks, further accelerating the adoption of revenue assurance technologies across diverse sectors.
North America leads the Revenue Assurance Market, supported by a mature digital infrastructure and a high concentration of technology-driven enterprises. The region has demonstrated early adoption of advanced analytics, cloud computing, and automation tools, driving demand for sophisticated revenue assurance solutions. In Europe, stringent regulatory frameworks and data protection standards are encouraging organizations to invest in systems that ensure transparent revenue tracking and reporting. Asia-Pacific is emerging as a key growth region due to the rapid expansion of digital services, mobile connectivity, and cloud adoption. The region’s large population and increasing number of enterprises contribute to the growing demand for scalable assurance systems. Latin America and the Middle East & Africa are also witnessing gradual progress, primarily led by improvements in telecommunications infrastructure and financial services. Across all regions, the rising need for operational accuracy, fraud prevention, and regulatory compliance is creating a favorable environment for revenue assurance implementation.
Access crucial information at unmatched prices!
Request your sample report today & start making informed decisions powered by Credence Research Inc.!
Download Sample
Market Insights:
- The Revenue Assurance Market is projected to grow from USD 6,323.24 million in 2024 to USD 15,021.36 million by 2032, registering a CAGR of 11.47%.
- Billing complexities and rising transaction volumes in sectors like telecom, utilities, and BFSI are increasing demand for automated revenue assurance frameworks.
- Artificial intelligence and machine learning are being embedded into assurance platforms, enabling faster anomaly detection and real-time fraud prevention.
- Businesses are investing in scalable cloud-based assurance tools to support recurring billing models, digital services, and personalized customer offerings.
- Compliance pressures are compelling enterprises to adopt audit-ready solutions that enhance revenue visibility and align with global regulatory standards.
- Integration challenges with legacy IT systems and a shortage of skilled professionals are slowing deployment in certain industries and regions.
- North America leads the global market, while Asia-Pacific shows the highest growth potential due to rapid digital adoption and enterprise expansion.
Market Drivers:
Rising Billing Complexity and Data Volume Driving the Need for Assurance Systems
The surge in digital transformation across sectors has introduced increasingly complex billing structures involving multiple service tiers, real-time usage tracking, and dynamic pricing models. These intricate systems are prone to errors, making organizations vulnerable to revenue leakage and financial discrepancies. The Revenue Assurance Market is growing in response to this demand for structured frameworks that ensure billing accuracy and revenue protection. Industries such as telecommunications, financial services, and utilities manage vast volumes of customer and transaction data, which require constant validation and monitoring. Manual processes are often inadequate to track this level of data complexity. Businesses are investing in automated solutions that streamline billing workflows and reduce exposure to risk.
- For instance, Subex deployed its ROC Revenue Assurance solution for Türk Telekom, a Tier-1 telecom operator in Europe, enabling the real-time processing of over 30 billion call data records per day, significantly enhancing the operator’s ability to detect revenue leakages and improve billing accuracy.
Integration of Artificial Intelligence Enhancing Detection and Efficiency
The adoption of artificial intelligence (AI) and machine learning (ML) is transforming how enterprises approach revenue assurance. These technologies offer advanced capabilities such as anomaly detection, real-time alerts, and predictive analytics, allowing teams to proactively address discrepancies. The Revenue Assurance Market is witnessing increased integration of intelligent systems that can process large datasets and identify irregularities faster than traditional rule-based tools. AI-powered platforms also help improve accuracy in identifying revenue loss patterns and fraud instances. It supports efficiency by automating previously manual tasks and enabling faster resolution cycles. These tools are becoming central to modern assurance strategies across industries seeking operational resilience.
Growth in Subscription Models and Digital Ecosystems Requiring Accurate Monetization
The shift toward digital ecosystems and subscription-based business models is placing new demands on revenue assurance frameworks. With recurring billing, customer personalization, and bundled services becoming mainstream, companies need robust systems to track revenue across various touchpoints. The Revenue Assurance Market is expanding to support enterprises that must monitor ongoing revenue streams while ensuring compliance and customer satisfaction. This environment requires tools that can adapt to billing variability and offer consistent validation processes. Organizations are leveraging platforms that deliver end-to-end visibility of revenue flows and enable faster reconciliation. Ensuring accuracy across digital services is critical for maintaining profitability and customer trust.
- For instance, Netcracker Technology provided its Revenue Management Suite to a U.S.-based digital service provider, enabling seamless monetization of over 3 million active subscriptions with automated billing accuracy checks and integrated real-time rating.
Heightened Regulatory Pressure Driving Demand for Compliance-Ready Solutions
Regulatory bodies across regions are increasing scrutiny over revenue reporting, transparency, and financial integrity. Organizations are under pressure to comply with evolving regulations and avoid financial penalties or reputational damage. The Revenue Assurance Market is seeing growth from businesses seeking systems that provide audit-ready records, automated documentation, and policy enforcement. Enterprises must demonstrate that their revenue management practices align with national and international standards. Revenue assurance tools help enforce internal controls and standardize reporting formats, enabling companies to meet regulatory requirements more effectively. The push for corporate accountability is turning compliance into a strategic imperative supported by assurance systems.
Market Trends:
Rising Focus on End-to-End Revenue Visibility Across Business Units
Organizations are placing increased emphasis on achieving end-to-end visibility into revenue operations, from service activation to final settlement. Businesses are recognizing the need to consolidate financial, operational, and customer data into a single assurance framework. The Revenue Assurance Market is evolving to offer unified platforms that provide cross-functional transparency and traceability. This trend is particularly relevant for enterprises with multi-channel services and distributed infrastructure. Visibility across departments enables faster detection of discrepancies and facilitates better coordination between finance, IT, and operations. Companies are seeking integrated dashboards and real-time reporting tools that offer a centralized view of revenue flows.
- For instance, ACI Worldwide implemented its Revenue Optimizer platform with a large U.S. telecom merchant, enabling end‑to‑end traceability across billing systems, payment gateways, networks, and bank accounts. Within the first month, it flagged 850+ transactions (totalling $900K) that failed to settle, streamlined ingesting 1 million records in just 50 seconds, and cut exception-research staff hours by 75%.
Vendor Consolidation and Ecosystem Partnerships Shaping Solution Offerings
The competitive landscape is witnessing a wave of mergers, acquisitions, and partnerships aimed at broadening solution capabilities and global reach. Key players are integrating specialized assurance tools into broader business support systems, strengthening value propositions for customers. The Revenue Assurance Market is responding to client demand for comprehensive, modular solutions that reduce deployment complexity and enhance ROI. Strategic collaborations are bringing together telecom providers, IT vendors, and analytics firms to deliver more intelligent and scalable offerings. These ecosystem alliances are helping vendors tailor solutions to industry-specific needs and regulatory landscapes. Buyers increasingly prefer platforms backed by long-term vendor stability and innovation pipelines.
- For instance, Ericsson deployed its AI-powered Operations Engine for a Tier-1 telecom operator in the Middle East, managing a subscriber base of 12 million and operating across 390 databases and 2,000 Unix servers. The solution consolidated network alerts, streamlined data processing, and significantly reduced revenue leakages within the first quarter, as reported by Ericsson.
Shift Toward Real-Time and Event-Based Revenue Monitoring
Traditional batch processing models are giving way to real-time revenue monitoring systems that detect issues during service execution rather than post-factum. Enterprises want to capture anomalies and leakages as they happen to prevent revenue loss and reduce downstream correction costs. The Revenue Assurance Market is witnessing strong momentum toward event-based processing and in-stream validation. This shift is fueled by advancements in data streaming technologies and API-driven architectures. Real-time processing helps reduce revenue recovery cycles and enhances customer experience by minimizing billing disputes. Businesses are redesigning assurance workflows to support dynamic environments such as cloud-native platforms and edge computing.
Expansion of Revenue Assurance Beyond Telecom Into New Verticals
Revenue assurance is no longer limited to telecommunications; industries such as banking, healthcare, utilities, and media are increasingly implementing similar frameworks. These sectors are experiencing rising complexity in service delivery, billing, and regulatory compliance. The Revenue Assurance Market is diversifying to cater to industry-specific revenue risk profiles and business models. New verticals require configurable solutions that align with their operational workflows and customer engagement patterns. Vendors are investing in sector-specific templates, data connectors, and rule libraries to expand their reach. The market is broadening its relevance by demonstrating the value of revenue assurance in any data-intensive business ecosystem.
Market Challenges Analysis:
Integration Complexity Across Legacy and Modern Systems Limits Deployment Speed
One of the primary challenges in the Revenue Assurance Market is the difficulty in integrating assurance solutions with diverse legacy infrastructures and modern digital systems. Many organizations operate with fragmented billing platforms, siloed data repositories, and outdated IT architectures that lack interoperability. This creates significant hurdles during deployment, testing, and scaling of revenue assurance tools. It increases implementation timeframes and requires additional customization, driving up costs and delaying value realization. The Revenue Assurance Market must address these barriers by offering flexible integration frameworks and robust APIs that work across heterogeneous environments. Businesses often struggle to balance innovation with the risk of disrupting existing operations, which slows adoption momentum.
Skilled Workforce Shortage and Data Governance Gaps Undermine Effectiveness
The shortage of professionals with domain expertise in revenue assurance, analytics, and compliance presents another pressing obstacle. Organizations require skilled personnel to interpret complex datasets, configure automated rules, and manage ongoing risk assessments. The Revenue Assurance Market faces constraints due to limited training programs and lack of cross-functional expertise among finance, IT, and operations teams. Poor data governance also undermines the performance of assurance systems by introducing inconsistencies, gaps, and low-quality inputs. Without strong data policies and a well-trained team, businesses struggle to extract meaningful insights or act decisively on flagged anomalies. Ensuring the reliability and accuracy of revenue data remains a persistent challenge across sectors.
Market Opportunities:
Rising Adoption of 5G, IoT, and Edge Services Creating New Revenue Streams
The growing rollout of 5G networks, Internet of Things (IoT) devices, and edge computing services is generating new revenue models that demand accurate billing and oversight. These emerging technologies introduce microtransactions, dynamic pricing, and high transaction volumes that traditional systems struggle to manage. The Revenue Assurance Market has an opportunity to support telecom operators, cloud providers, and IoT vendors by offering scalable solutions tailored for high-speed, data-intensive environments. It can enable real-time validation, adaptive policy enforcement, and service-based revenue tracking across distributed ecosystems. By aligning with these technologies, vendors can position their platforms as essential tools for monetization and fraud mitigation.
Demand for Cloud-Based, Scalable Solutions Among Mid-Sized Enterprises
Mid-sized companies are increasingly investing in digital transformation but often lack the in-house resources to manage complex revenue assurance processes. The Revenue Assurance Market can tap into this segment by offering cloud-native, modular solutions that are affordable, easy to deploy, and require minimal technical expertise. It can deliver value through automation, subscription-based pricing, and analytics tailored for smaller-scale operations. Vendors offering flexible deployment options and rapid onboarding can gain traction among this underserved customer base. As more companies seek to improve financial control without heavy capital investment, cloud-based assurance tools will become more attractive.
Market Segmentation Analysis:
The Revenue Assurance Market is segmented
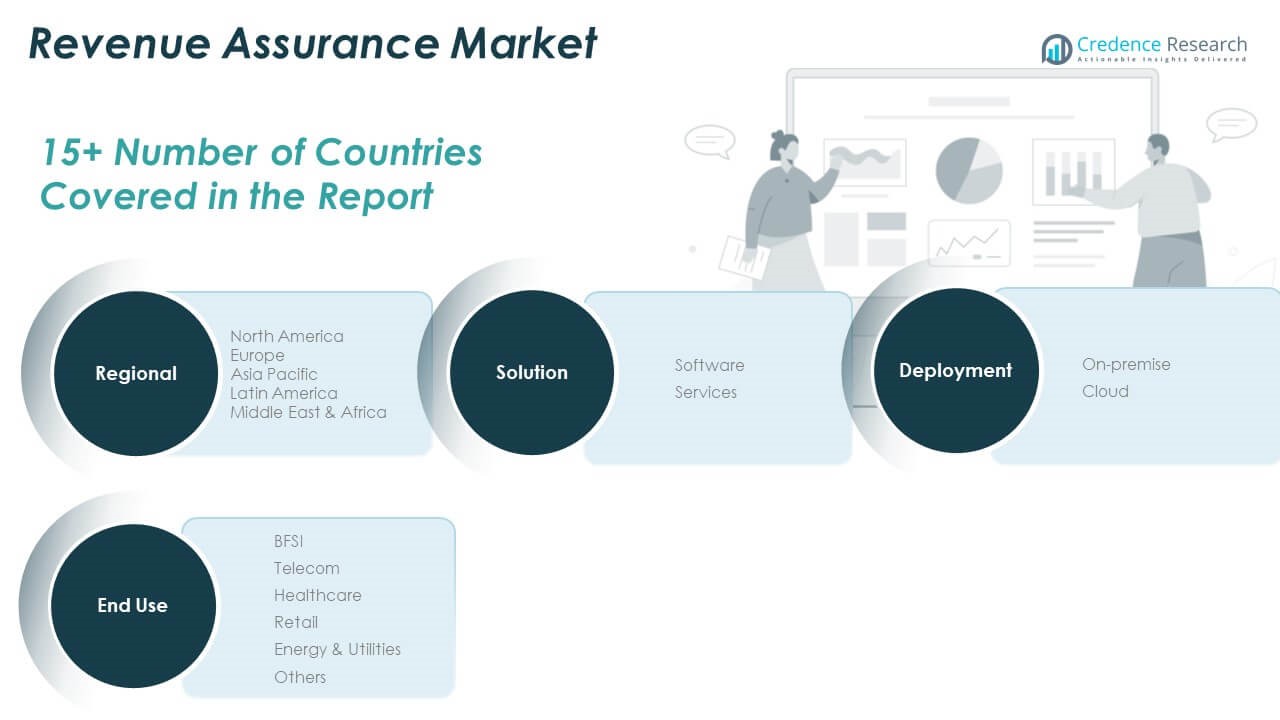
By solution into software and services. Software holds a larger share due to its critical role in automating revenue monitoring, data reconciliation, and anomaly detection. Services, including consulting, integration, and support, are gaining traction as enterprises seek expert assistance for implementing complex assurance frameworks.
By deployment, the market is divided into on-premise and cloud. On-premise solutions remain relevant for large enterprises with strict data control needs. However, cloud deployment is growing rapidly, driven by its scalability, cost-efficiency, and ease of integration with digital platforms.
- For instance, Rogers Communications migrated its on-prem Hadoop and Oracle pipelines into a centralized Azure Databricks lakehouse called RADL using Azure Data Factory. This migration enabled real-time analytics across multiple business units, supported ML and BI workloads at scale, and accelerated data-driven insights enterprise-wide, as reported by Databricks.
By end use, the Revenue Assurance Market spans BFSI, telecom, healthcare, retail, energy & utilities, and others. Telecom leads in adoption due to its high billing complexity and transaction volume. BFSI follows closely, focusing on fraud prevention and regulatory compliance. Healthcare and retail segments are expanding their use of assurance systems to support accurate billing and protect sensitive financial flows. Energy & utilities also rely on revenue assurance to manage smart metering and consumption-based billing.
- For instance, HSBC deployed an AI-driven Dynamic Risk Assessment system that reduced fraud false positives by up to 60%, significantly streamlining the fraud investigation process across its global banking operations.
Segmentation:
By Solution:
By Deployment:
By End Use:
- BFSI
- Telecom
- Healthcare
- Retail
- Energy & Utilities
- Others
By Regions:
- North America
- Europe
- Asia Pacific
- Latin America
- Middle East
- Africa
Regional Analysis:
The North America Revenue Assurance Market size was valued at USD 1,447.20 million in 2018 to USD 2,090.42 million in 2024 and is anticipated to reach USD 4,958.58 million by 2032, at a CAGR of 11.5% during the forecast period. North America holds the largest share of the global Revenue Assurance Market, accounting for nearly 33% of the total market in 2024. It benefits from a mature digital infrastructure, widespread adoption of cloud platforms, and a high concentration of telecom and financial service providers. Enterprises in the U.S. and Canada are early adopters of advanced analytics and AI-driven tools, boosting regional demand for assurance solutions. Regulatory compliance standards and heightened cybersecurity awareness further encourage investment in structured revenue protection systems. The region continues to see growth through mergers, technological advancements, and ongoing digital transformation across sectors. Vendors leverage North America’s robust enterprise base to introduce next-generation, real-time assurance platforms.
The Europe Revenue Assurance Market size was valued at USD 1,192.32 million in 2018 to USD 1,680.54 million in 2024 and is anticipated to reach USD 3,781.67 million by 2032, at a CAGR of 10.7% during the forecast period. Europe accounts for around 27% share of the global Revenue Assurance Market in 2024, driven by regulatory rigor and the adoption of digital billing systems across telecom, energy, and public sectors. Strict data governance rules such as GDPR have pushed enterprises to adopt transparent and traceable revenue tracking platforms. The presence of diversified industries and cross-border service providers creates a strong need for harmonized revenue assurance solutions. Countries like Germany, the U.K., and France lead adoption, supported by strong IT infrastructure and financial oversight. European enterprises prioritize accuracy, risk mitigation, and audit readiness in revenue operations. The demand for modular, compliant solutions continues to expand across mid- to large-scale organizations.
The Asia Pacific Revenue Assurance Market size was valued at USD 1,144.80 million in 2018 to USD 1,744.24 million in 2024 and is anticipated to reach USD 4,540.97 million by 2032, at a CAGR of 12.7% during the forecast period. Asia Pacific holds nearly 28% share of the global Revenue Assurance Market in 2024 and is the fastest-growing region. Rapid digitalization, telecom expansion, and rising mobile connectivity across China, India, Japan, and Southeast Asia drive market growth. Governments are actively investing in smart infrastructure and digital economies, encouraging businesses to strengthen revenue integrity. Organizations are adopting cloud-based and real-time revenue assurance systems to manage rising transaction volumes and complex service models. Startups and SMEs also contribute to demand, seeking scalable solutions with cost flexibility. The region’s dynamic economy supports innovation and early adoption across emerging verticals.
The Latin America Revenue Assurance Market size was valued at USD 268.27 million in 2018 to USD 388.82 million in 2024 and is anticipated to reach USD 855.77 million by 2032, at a CAGR of 10.4% during the forecast period. Latin America holds nearly 6% share of the global Revenue Assurance Market in 2024, with growing demand across telecom, finance, and utility sectors. Brazil and Mexico lead regional adoption due to ongoing digital upgrades and increasing emphasis on revenue recovery. Organizations face challenges related to fraud, billing inconsistencies, and legacy infrastructure, prompting them to invest in more efficient assurance systems. The shift toward prepaid and bundled service models is accelerating the need for precise tracking and validation tools. Vendors are focusing on offering localized solutions tailored to regulatory frameworks and market maturity. Growing awareness of revenue protection benefits is expected to drive steady adoption in the years ahead.
The Middle East Revenue Assurance Market size was valued at USD 173.23 million in 2018 to USD 238.34 million in 2024 and is anticipated to reach USD 513.81 million by 2032, at a CAGR of 10.1% during the forecast period. The Middle East accounts for approximately 4% share of the global Revenue Assurance Market in 2024. Gulf countries are leading adoption, driven by large-scale digital infrastructure projects and investments in smart cities. Telecom operators and utility providers are implementing assurance tools to handle evolving billing models and regulatory expectations. The market is seeing increased collaboration between public and private sectors to enhance data transparency and operational efficiency. Real-time analytics and cloud-based solutions are gaining traction across the region. Vendors are aligning with regional telecom reforms and expanding their presence through strategic partnerships. The evolving digital economy is opening new opportunities for assurance platforms.
The Africa Revenue Assurance Market size was valued at USD 94.18 million in 2018 to USD 180.87 million in 2024 and is anticipated to reach USD 370.57 million by 2032, at a CAGR of 9.0% during the forecast period. Africa contributes roughly 3% to the global Revenue Assurance Market in 2024, with growing momentum in urban telecom hubs and financial service ecosystems. Markets such as South Africa, Nigeria, and Kenya are witnessing gradual adoption of revenue assurance tools to tackle issues like fraud, leakage, and billing errors. Limited IT infrastructure and budget constraints remain challenges, but cloud adoption is easing implementation barriers. Regional enterprises are beginning to understand the long-term value of automated revenue monitoring and audit readiness. Government initiatives for digital inclusion and mobile payments are supporting the development of assurance practices. The region offers untapped potential for vendors targeting scalable, mobile-first solutions.
Shape Your Report to Specific Countries or Regions & Enjoy 30% Off!
Key Player Analysis:
- Accenture
- Amdocs
- Araxxe
- Hewlett Packard Enterprise Development LP
- IBM
- SUBEX
- Tata Consultancy Services Limited (TCS)
- Tech Mahindra Limited
- Telefonaktiebolaget LM Ericsson
- TEOCO
- Mobileum
Competitive Analysis:
The Revenue Assurance Market is characterized by intense competition among global and regional players offering advanced analytics, automation, and cloud-based platforms. Key companies focus on expanding their portfolios through AI integration, real-time monitoring, and scalable deployment models. It is witnessing strategic collaborations, acquisitions, and innovation-driven differentiation as firms aim to address evolving revenue complexities across telecom, BFSI, and utility sectors. Leading vendors prioritize customizable solutions that align with sector-specific compliance and data governance needs. New entrants are entering the market with lightweight, subscription-based offerings targeting mid-sized enterprises. The presence of both niche technology providers and large enterprise software firms creates a balanced competitive landscape. Continuous investments in R&D and customer support further shape vendor positioning in this space.
Recent Developments:
- In June 2025, Subex introduced Embedded Generative AI in its HyperSense platform
Subex launched a major upgrade to its telecom-focused HyperSense Revenue Assurance & Fraud Management solution by embedding GenAI capabilities on June 20, 2025. It now offers dynamic, AI-driven reasoning that learns continuously, enabling proactive detection of anomalies and adaptive decision-making.
- In March 2025, Accenture announced a strategic investment and partnership with Aaru, an AI-powered agentic prediction engine. This collaboration aims to integrate Aaru’s advanced simulation technology into Accenture’s AI products and services, enhancing new product development, marketing, and customer strategy for clients seeking to optimize revenue streams and customer experience in the revenue assurance landscape.
Market Concentration & Characteristics:
The Revenue Assurance Market shows moderate to high market concentration, with a mix of established global players and emerging vendors competing for share. It is defined by continuous innovation, strong focus on automation, and increasing demand for real-time analytics. Larger firms dominate high-value contracts across telecom and financial services, while smaller vendors target mid-sized businesses with flexible, cloud-native solutions. The market favors vendors that offer scalable platforms, seamless integration, and regulatory compliance support. Strategic alliances and product differentiation remain critical for sustaining competitive advantage. Customer demand for rapid deployment, low total cost of ownership, and minimal manual intervention shapes product development trends across the industry.
Report Coverage:
The research report offers an in-depth analysis based on Solution, Deployment and End Use. It details leading market players, providing an overview of their business, product offerings, investments, revenue streams, and key applications. Additionally, the report includes insights into the competitive environment, SWOT analysis, current market trends, as well as the primary drivers and constraints. Furthermore, it discusses various factors that have driven market expansion in recent years. The report also explores market dynamics, regulatory scenarios, and technological advancements that are shaping the industry. It assesses the impact of external factors and global economic changes on market growth. Lastly, it provides strategic recommendations for new entrants and established companies to navigate the complexities of the market.
Future Outlook:
- Growing adoption of AI and machine learning will enhance accuracy and speed in detecting revenue anomalies.
- Expansion of 5G and IoT ecosystems will drive demand for real-time, event-based assurance tools.
- Cloud-native platforms will gain preference among mid-sized enterprises seeking cost-effective solutions.
- Integration of revenue assurance into broader business support systems will improve operational alignment.
- Regulatory compliance pressures will push enterprises to adopt audit-ready assurance frameworks.
- Cross-industry adoption beyond telecom will open new growth avenues in BFSI, utilities, and healthcare.
- Increased focus on customer experience will lead to more proactive and automated billing validation.
- Real-time analytics and data visualization will support faster decision-making and risk mitigation.
- Strategic partnerships and vendor consolidation will reshape the competitive landscape.
- Demand for scalable and configurable platforms will rise as enterprises digitize revenue models.


