| REPORT ATTRIBUTE |
DETAILS |
| Historical Period |
2020-2023 |
| Base Year |
2024 |
| Forecast Period |
2025-2032 |
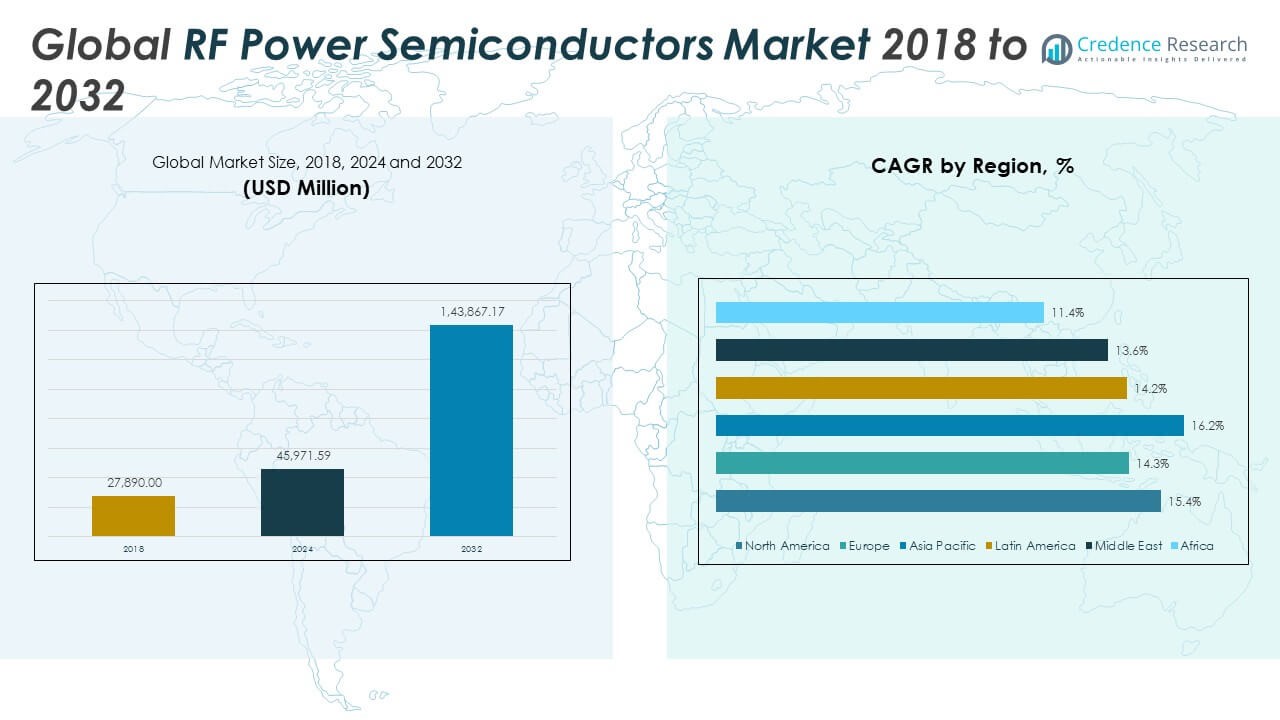
| RF Power Semiconductors Market Size 2024 |
USD 45,971.59 Million |
| RF Power Semiconductors Market, CAGR |
15.39% |
| RF Power Semiconductors Market Size 2032 |
USD 1,43,867.17 Million |
Market Overview:
The Global RF Power Semiconductors Market size was valued at USD 27,890.00 million in 2018 to USD 45,971.59 million in 2024 and is anticipated to reach USD 1,43,867.17 million by 2032, at a CAGR of 15.39% during the forecast period.
One of the primary drivers of the Global RF Power Semiconductors Market is the widespread deployment of 5G communication networks, which require high-performance RF power amplifiers to support increased data transmission and low-latency communication. The surge in demand for wireless devices, smartphones, and Internet of Things (IoT) applications is creating pressure on telecom operators to enhance infrastructure, thereby boosting RF component consumption. The aerospace and defense sectors also play a critical role, where RF semiconductors are essential in radar systems, electronic warfare, satellite communication, and navigation. Rapid advancements in wide-bandgap semiconductor technologies, especially GaN and SiC, are reshaping design standards, enabling more compact, power-efficient, and rugged solutions. As industries prioritize energy efficiency and miniaturization, manufacturers are integrating these advanced materials into base stations, automotive radars, and industrial power systems, further accelerating market demand.
Regionally, Asia-Pacific dominates the RF power semiconductors market in both revenue and volume terms. This leadership stems from its large-scale electronics manufacturing base, significant investment in 5G infrastructure, and strong demand for consumer electronics and automotive applications in countries such as China, Japan, South Korea, and Taiwan. North America holds the second-largest market share, supported by aggressive 5G deployment, extensive military modernization programs, and the presence of key players specializing in high-performance RF technologies. Europe maintains steady growth through automotive radar innovations, industrial automation, and defense modernization efforts. Meanwhile, Latin America, the Middle East, and Africa are emerging as potential growth areas due to expanding telecom infrastructure, growing industrialization, and increasing adoption of wireless technologies. These regions are expected to contribute modestly but consistently to global market expansion over the forecast period.
Access crucial information at unmatched prices!
Request your sample report today & start making informed decisions powered by Credence Research Inc.!
Download Sample
Market Insights:
- The Global RF Power Semiconductors Market was valued at USD 27,890 million in 2018, reached USD 45,971.59 million in 2024, and is projected to reach USD 143,867.17 million by 2032, growing at a CAGR of 15.39%.
- The rollout of 5G networks globally is a major growth driver, increasing demand for high-efficiency RF amplifiers and transceivers used in base stations and small cells.
- Growing usage of smartphones, IoT devices, wearables, and smart home systems is fueling RF integration in consumer and industrial applications.
- Wide-bandgap materials like GaN and SiC are enabling more compact, energy-efficient RF devices that support high voltage, frequency, and temperature conditions.
- The market is also driven by aerospace and defense sectors, where RF semiconductors are used in radar, electronic warfare, avionics, and satellite communication systems.
- High manufacturing costs and complex design requirements, especially for GaN and SiC devices, limit scalability and restrict entry of smaller players.
- Asia-Pacific dominates the global market due to strong electronics manufacturing and 5G investments, while North America and Europe follow with defense and industrial automation demand; Latin America, Middle East, and Africa are emerging with expanding telecom infrastructure.
Market Drivers:
Accelerated Deployment of 5G Infrastructure Across Global Markets:
The widespread rollout of 5G networks is one of the primary drivers fueling the Global RF Power Semiconductors Market. Telecom operators are deploying high-density base stations and small cells to support faster data transmission, lower latency, and expanded bandwidth. These installations require high-performance RF power amplifiers and transceivers capable of operating at higher frequencies and delivering efficient power output. The increasing density of network nodes in urban and suburban areas boosts the demand for compact, power-dense semiconductor components. The Global RF Power Semiconductors Market is responding with GaN-based devices that offer greater thermal efficiency and reliability under high-frequency conditions. This infrastructure transformation creates long-term opportunities for RF semiconductor suppliers globally.
- For instance, Nokia deployed over 200,000 5G base stations globally by 2023, utilizing GaN-based RF power amplifiers that achieved up to 50% higher power efficiency compared to previous silicon-based solutions.
Rising Demand for Connected Devices and Wireless Communication:
The proliferation of smartphones, smart home products, wearables, and IoT devices has increased the demand for wireless connectivity and high-speed data transfer. Consumers expect uninterrupted, high-speed mobile and wireless experiences, which require robust RF front-end systems. It supports the integration of RF power semiconductors in a wide range of consumer electronics and industrial automation platforms. Applications such as smart meters, industrial sensors, and autonomous systems rely on efficient RF communication to maintain real-time control and monitoring. The Global RF Power Semiconductors Market benefits from this surge by supplying critical components for reliable wireless performance. Market players are scaling production to meet demand across diverse sectors without compromising signal integrity.
- For instance, Qualcomm shipped more than 1.1 billion RF front-end modules in 2022, supporting advanced Wi-Fi 6 and 5G connectivity in smartphones and IoT devices worldwide.
Adoption of Wide-Bandgap Materials for High-Efficiency Performance:
Wide-bandgap semiconductor technologies, particularly GaN and SiC, are transforming RF power applications due to their superior performance characteristics. These materials support higher voltages, frequencies, and temperatures compared to traditional silicon, enabling devices to operate more efficiently and compactly. It allows designers to create systems with smaller footprints and reduced energy consumption while maintaining high output power. The Global RF Power Semiconductors Market is rapidly transitioning toward these advanced materials to support high-power radar, satellite communication, and base station applications. OEMs and device manufacturers are investing heavily in GaN-based solutions to improve efficiency and reduce system-level costs. The shift toward these materials enhances the competitiveness of vendors in both commercial and defense markets.
Expanding Use in Aerospace, Defense, and Satellite Applications:
RF power semiconductors are essential in military-grade radar, electronic warfare, avionics, and satellite communication systems. Governments are increasing defense budgets to modernize equipment and enhance strategic capabilities, which includes upgrading to advanced RF systems. These applications require rugged, high-reliability components capable of operating under extreme conditions and delivering high-frequency output. It positions the Global RF Power Semiconductors Market as a key enabler of next-generation defense infrastructure. GaN technology is particularly valuable for reducing system size and improving thermal management in space-constrained environments. Market demand from defense and space sectors continues to support long-term growth for specialized RF power devices.
Market Trends:
Integration of RF Power Devices into Electric Vehicles and Automotive Radar:
Automotive manufacturers are incorporating RF power semiconductors into advanced driver assistance systems (ADAS), vehicle-to-everything (V2X) communication platforms, and high-frequency radar modules. These technologies require stable, high-power RF transmission for accurate object detection, lane tracking, and collision avoidance. The Global RF Power Semiconductors Market is experiencing growing demand from the automotive sector, particularly with the rise of autonomous and electric vehicles. GaN and SiC-based RF components support compact designs and high thermal tolerance, making them suitable for under-the-hood applications. Automakers are investing in millimeter-wave radar systems to enhance vehicle safety and performance. This trend expands the market’s footprint beyond traditional telecom and into mobility innovation.
- For instance, Infineon Technologies supplied over 100 million 77 GHz radar chips for automotive applications by 2023, enabling high-resolution radar sensing for ADAS and autonomous driving systems.
Miniaturization of RF Components for Consumer and Industrial Electronics:
The demand for compact, power-efficient RF devices is increasing across wearable electronics, smartphones, industrial sensors, and smart appliances. Manufacturers are focusing on integrating RF power functions into smaller footprints without compromising performance. It is driving the development of advanced packaging techniques and system-in-package (SiP) architectures. The Global RF Power Semiconductors Market is aligning with this trend by offering multi-functional, low-power RF chips that suit space-constrained designs. Designers now prioritize thermal performance and EMI shielding at the component level to maintain device integrity. Miniaturization supports broader adoption in edge computing, portable healthcare devices, and embedded industrial systems.
- For instance, Skyworks Solutions offers the SKY59269-702LF, a compact SP4T antenna tuning switch provided in a 1.6 x 1.6 x 0.45 mm QFN package, meeting the requirements for board-level assembly in space-constrained devices.
Rise of Software-Defined Radios and Multi-Band Operation:
Software-defined radios (SDRs) are gaining momentum across commercial and defense sectors for their flexibility and reconfigurability. These systems require RF power semiconductors that support wideband and multi-mode operation across various frequency ranges. The Global RF Power Semiconductors Market is seeing a shift toward components that can adapt to different communication standards without changing hardware. GaN-based devices allow for broad frequency response and improved linearity, making them suitable for SDR-based applications. This trend supports spectrum agility in dynamic environments such as military communication, emergency response, and remote sensing. Manufacturers are optimizing RF devices to meet the technical demands of programmable radio platforms.
Focus on Sustainability and Energy Efficiency in RF System Design:
The industry is emphasizing energy efficiency and sustainable design across RF systems, driven by regulatory pressures and cost-saving goals. Data centers, telecom operators, and industrial users are seeking RF solutions that reduce power consumption and thermal output. It is pushing the Global RF Power Semiconductors Market toward low-loss devices and efficient thermal management systems. Manufacturers are leveraging GaN and SiC to minimize energy waste in high-duty-cycle operations. Design strategies now include intelligent power control and energy-aware switching modes. This focus on sustainability supports long-term system reliability and aligns with global energy efficiency initiatives.
Market Challenges Analysis:
High Manufacturing Costs and Complex Design Requirements Limit Scalability:
The production of RF power semiconductors, particularly those based on wide-bandgap materials like GaN and SiC, involves advanced fabrication processes and specialized equipment. These technologies require high-purity substrates, tight tolerances, and cleanroom environments, which significantly increase production costs. Smaller manufacturers face challenges in scaling operations due to capital intensity and limited foundry access. The Global RF Power Semiconductors Market reflects this barrier, where only a few established players control the majority of high-performance production capacity. Complex design requirements—such as thermal management, impedance matching, and high-frequency stability—further raise development costs and time-to-market. These factors restrict the entry of new players and slow broader commercialization, especially in cost-sensitive markets.
Supply Chain Disruptions and Raw Material Constraints Affect Production Stability:
The market is vulnerable to global supply chain disruptions, particularly in sourcing rare materials and high-quality wafers needed for RF power devices. Geopolitical tensions, export restrictions, and semiconductor shortages have delayed production schedules and extended lead times. It impacts the ability of OEMs to meet growing demand across telecom, defense, and automotive sectors. The Global RF Power Semiconductors Market depends on a well-coordinated supply network spanning Asia, North America, and Europe, making it susceptible to regional instability. Dependence on a limited number of foundries and equipment suppliers’ further compounds risk. Manufacturers must invest in supply chain resilience and diversification to maintain production continuity and meet customer commitments.
Market Opportunities:
Expansion of 5G and Satellite Networks Creates Long-Term Demand Potential:
The ongoing global expansion of 5G infrastructure and next-generation satellite communication systems presents a strong opportunity for RF power semiconductor manufacturers. These applications require high-efficiency, high-frequency components capable of supporting dense network coverage, beamforming, and wide bandwidth. The Global RF Power Semiconductors Market can capitalize on this shift by delivering GaN-based amplifiers and power transistors optimized for performance in compact, high-throughput environments. Emerging low-earth orbit (LEO) satellite constellations also increase demand for lightweight, energy-efficient RF devices. Manufacturers that offer scalable solutions with proven performance across both terrestrial and space-based platforms will gain competitive advantage. The growing interoperability between 5G and satellite technologies strengthens long-term product relevance.
Emerging Applications in Industrial IoT and Smart Infrastructure:
Industrial IoT, smart cities, and infrastructure digitization projects are expanding demand for reliable wireless communication and edge processing capabilities. RF power semiconductors support long-range connectivity, sensor communication, and real-time control in factory automation, energy grids, and transportation networks. It enables secure, low-latency data transmission in environments where wired infrastructure is not viable. The Global RF Power Semiconductors Market is well-positioned to provide robust solutions that enhance operational efficiency in harsh or remote conditions. Developers focusing on ruggedized, energy-efficient RF systems will find new adoption pathways. Broader digitization trends across industrial sectors present untapped growth potential for RF semiconductor innovation.
Market Segmentation Analysis:
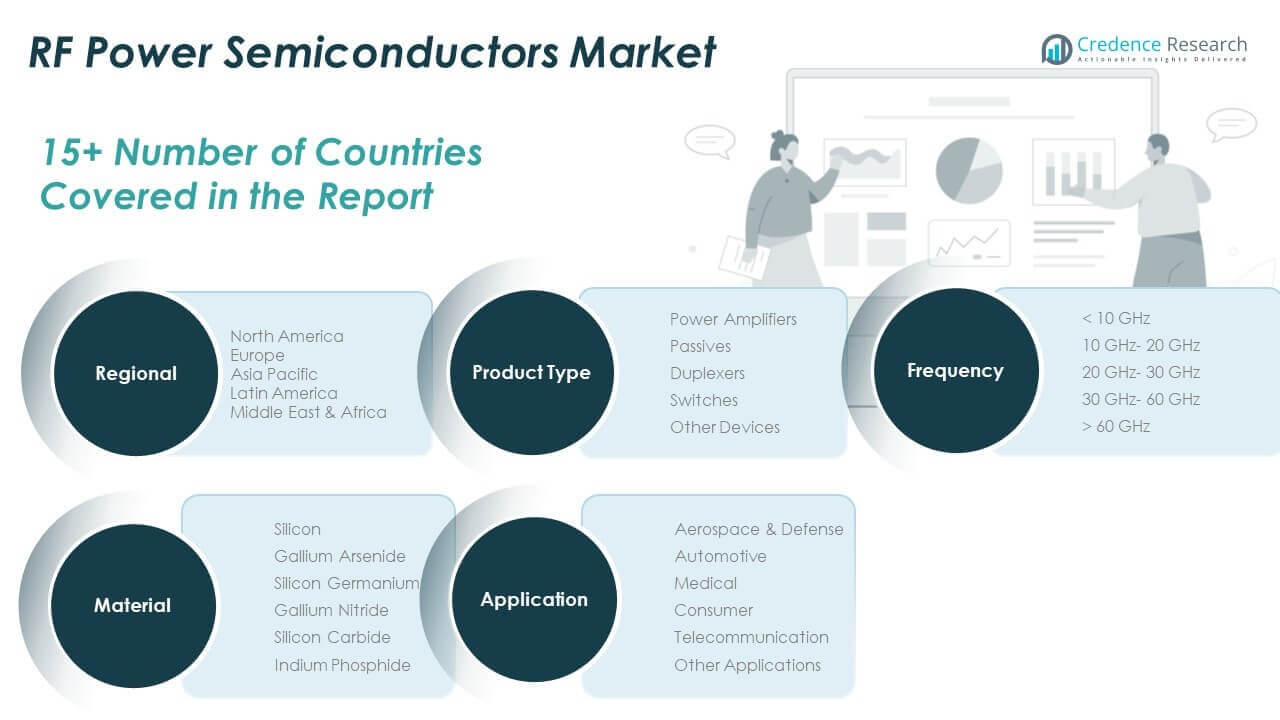
By Product Type
Power amplifiers account for the highest revenue share due to their essential role in signal transmission for telecom, defense, and industrial applications. Passives, duplexers, and switches are integral in RF front-end designs, supporting signal filtering, routing, and impedance matching. Other RF devices contribute to specialized communication and sensing modules.
- For instance, Qorvo has expanded its portfolio with new S-Band and C-Band power amplifiers, such as the QPA2935 (2-Watt) and QPA0506 (4-Watt), which offer superior power-added efficiency for radar applications. These amplifiers provide up to a 20-percentage point efficiency upgrade with drop-in compatibility for existing systems.
By Application
Telecommunication remains the largest application segment, supported by 5G infrastructure and network densification. Aerospace & defense follows closely, driven by radar, satellite, and electronic warfare requirements. Automotive demand is rising with vehicle-to-everything (V2X) communication and radar integration. Consumer, medical, and other sectors are expanding with the rise in smart, wireless-enabled devices.
- For instance, Analog Devices launched the ADRV9002 RF transceiver, which operates from 30 MHz to 6 GHz and offers best-in-class dynamic range. It is designed for mission-critical communications, including military, satellite, and private LTE networks, and is capable of handling both wideband and narrowband signals with advanced signal correction algorithms.
By Frequency
The <10 GHz band leads due to broad deployment in legacy telecom and broadcast systems. The 10–20 GHz and 20–30 GHz ranges are growing rapidly in 5G and radar applications. The 30–60 GHz and >60 GHz bands are gaining traction in mmWave and high-data-rate systems, especially in defense and satellite communications.
By Material
Silicon remains the most widely used material due to cost efficiency and mature processing. Gallium nitride (GaN) and silicon carbide (SiC) are expanding due to superior power density and high-frequency performance. Gallium arsenide, silicon germanium, and indium phosphide serve niche applications requiring high-speed or low-noise operation. The Global RF Power Semiconductors Market is steadily shifting toward wide-bandgap materials to support efficiency and thermal management in compact, high-performance systems.
Segmentation:
By Product Type
- Power Amplifiers
- Passives
- Duplexers
- Switches
- Other Devices
By Application
- Aerospace & Defense
- Automotive
- Medical
- Consumer
- Telecommunication
- Other Applications
By Frequency
- < 10 GHz
- 10 GHz – 20 GHz
- 20 GHz – 30 GHz
- 30 GHz – 60 GHz
- 60 GHz
By Material
- Silicon
- Gallium Arsenide
- Silicon Germanium
- Gallium Nitride
- Silicon Carbide
- Indium Phosphide
By Region
- North America
- Europe
- Asia Pacific
- Latin America
- Middle East
- Africa
Regional Analysis:
North America
The North America RF Power Semiconductors Market size was valued at USD 7,220.72 million in 2018 to USD 11,699.49 million in 2024 and is anticipated to reach USD 36,542.52 million by 2032, at a CAGR of 15.4% during the forecast period. The Global RF Power Semiconductors Market benefits significantly from strong U.S. leadership in defense, aerospace, and advanced telecom systems. High investment in 5G infrastructure and military modernization programs continues to drive demand for high-performance RF components. Key manufacturers and research institutions are headquartered in the region, supporting innovation in GaN and SiC-based devices. Government contracts and funding for defense electronics also sustain long-term growth. It remains a critical region for early adoption of advanced RF technologies.
Europe
The Europe RF Power Semiconductors Market size was valued at USD 5,516.64 million in 2018 to USD 8,623.01 million in 2024 and is anticipated to reach USD 24,968.53 million by 2032, at a CAGR of 14.3% during the forecast period. The Global RF Power Semiconductors Market in Europe is growing steadily due to strong demand in automotive radar, industrial automation, and aerospace sectors. Countries like Germany, France, and the UK are key contributors to RF innovation, particularly in mm Wave and low-power applications. Investments in electric vehicles and ADAS are also expanding RF usage in the automotive space. European manufacturers are increasingly integrating GaN materials for improved power efficiency. It shows a steady shift toward advanced semiconductor technologies across both commercial and defense domains.
Asia Pacific
The Asia Pacific RF Power Semiconductors Market size was valued at USD 12,360.85 million in 2018 to USD 20,873.21 million in 2024 and is anticipated to reach USD 69,128.29 million by 2032, at a CAGR of 16.2% during the forecast period. The Global RF Power Semiconductors Market is dominated by Asia Pacific in both volume and revenue. China, Japan, South Korea, and Taiwan lead in electronics manufacturing, 5G deployment, and consumer electronics demand. High mobile penetration and IoT growth contribute to accelerated RF component production. Regional players are expanding capabilities in GaN fabrication and vertically integrated systems. It remains the manufacturing and innovation hub for global semiconductor supply chains.
Latin America
The Latin America RF Power Semiconductors Market size was valued at USD 1,584.15 million in 2018 to USD 2,583.14 million in 2024 and is anticipated to reach USD 7,433.62 million by 2032, at a CAGR of 14.2% during the forecast period. The Global RF Power Semiconductors Market in Latin America is supported by expanding telecom infrastructure and industrial digitization. Countries such as Brazil and Mexico are investing in mobile broadband networks and public safety communication systems. There is growing interest in deploying RF-enabled solutions across mining, agriculture, and energy sectors. Imports of advanced RF components remain high due to limited local manufacturing. It continues to represent a developing but promising market for RF power technologies.
Middle East
The Middle East RF Power Semiconductors Market size was valued at USD 870.17 million in 2018 to USD 1,323.68 million in 2024 and is anticipated to reach USD 3,640.63 million by 2032, at a CAGR of 13.6% during the forecast period. The Global RF Power Semiconductors Market in the Middle East is gaining momentum with increasing deployment of secure communication systems in defense and public safety. Growth in smart city initiatives and industrial IoT projects also drives RF component demand. GCC countries are prioritizing technology diversification, boosting imports of high-frequency semiconductor devices. Key sectors include oil & gas monitoring, logistics, and smart infrastructure. It is gradually building regional demand with strong reliance on external suppliers.
Africa
The Africa RF Power Semiconductors Market size was valued at USD 337.47 million in 2018 to USD 869.05 million in 2024 and is anticipated to reach USD 2,153.58 million by 2032, at a CAGR of 11.4% during the forecast period. The Global RF Power Semiconductors Market in Africa remains in its early stages, with growth led by telecom expansion and infrastructure modernization. Countries such as South Africa and Egypt are driving mobile broadband access and wireless technology integration. There is rising adoption of RF solutions in rural connectivity, digital health, and public sector communication. Supply constraints and limited local assembly continue to hinder rapid growth. It holds long-term potential supported by international investments and regional digitization initiatives.
Shape Your Report to Specific Countries or Regions & Enjoy 30% Off!
Key Player Analysis:
- Qorvo (US)
- Skyworks (US)
- Analog Devices (US)
- Qualcomm (US)
- NXP Semiconductors (Netherlands)
- Cree (US)
- MACOM (US)
- Microchip Technology (US)
- Murata Manufacturing (Japan)
- Texas Instruments (US)
- Maxim Integrated (US)
- Mercury Systems (US)
- ON Semiconductor (US)
- RFHIC (South Korea)
- RichWave (Taiwan)
- STMicroelectronics (Switzerland)
- Sumitomo Electric Drives Innovations (Japan)
- TDK Electronics (Germany)
- Teledyne (US)
- Toshiba (Japan)
Competitive Analysis:
The Global RF Power Semiconductors Market features a competitive landscape dominated by key players such as Qorvo, Broadcom, NXP Semiconductors, Infineon Technologies, STMicroelectronics, and MACOM Technology Solutions. These companies maintain strong market positions through advanced R&D, wide product portfolios, and strategic investments in GaN and SiC technologies. It remains highly innovation-driven, with firms competing on efficiency, power density, and frequency performance. Strategic alliances, mergers, and technology licensing agreements strengthen global reach and accelerate new product introductions. Startups and niche players are entering the market by targeting specific applications like automotive radar and satellite communication. Leading vendors focus on expanding manufacturing capabilities and vertical integration to secure material supply and control costs. The market continues to reward firms that offer scalable, high-reliability solutions aligned with telecom, defense, and industrial growth trajectories.
Recent Developments:
- In July 2025, Microchip Technology expanded its space-qualified FPGA portfolio with new RT PolarFire device qualifications and SoC availability. This update enhances Microchip’s offerings for space and aerospace applications, providing higher reliability and performance for demanding environments.
- In June 2025, MACOM Technology Solutions announced a new range of high-performance RF solutions for advanced radar systems, including high-power GaN-on-SiC amplifiers for S-Band, C-Band, X-Band, and Ku-Band applications. These products, capable of output powers from 50 W to 1 kW, were showcased at the International Microwave Symposium 2025 and are aimed at both commercial and defense radar markets.
- In May 2025, Qualcomm revealed that it will launch the Snapdragon 8 Elite Gen 2 processor and other new products at its annual Snapdragon Summit, scheduled for September 23–25, 2025. This event is expected to showcase advancements in high-performance mobile and AI-focused processing, as well as new ARM-based chips for Windows laptops and data center processors optimized for AI infrastructure.
- In March 2025, Analog Devices, in partnership with Arduino, announced a mobile robot kit at Embedded World 2025. The kit integrates motion control, battery management, localization, and computer vision, offering a flexible platform for robotics, smart home, and educational applications.
- In February 2025, Cree LED launched the XLamp XP-L Photo Red S Line LEDs, a new advancement in horticulture lighting technology. This product introduction demonstrates Cree’s continued innovation in high-efficiency, application-specific LED solutions for industrial and agricultural markets.
Market Concentration & Characteristics:
The Global RF Power Semiconductors Market demonstrates moderate to high market concentration, with a few dominant players holding significant shares due to strong technical expertise, established foundry relationships, and robust intellectual property portfolios. It is characterized by rapid innovation cycles, high capital intensity, and a strong focus on high-frequency performance, power efficiency, and material advancement. The market favors vertically integrated firms that can manage design, fabrication, and packaging in-house. Entry barriers remain high due to complex manufacturing requirements and long qualification cycles in telecom and defense applications. Demand clusters around 5G, aerospace, automotive radar, and industrial IoT, where reliability and thermal performance are critical. It continues to evolve with increased emphasis on wide-bandgap materials and compact system integration.
Report Coverage:
The research report offers an in-depth analysis based on product type, application, frequency, and material. It details leading market players, providing an overview of their business, product offerings, investments, revenue streams, and key applications. Additionally, the report includes insights into the competitive environment, SWOT analysis, current market trends, as well as the primary drivers and constraints. Furthermore, it discusses various factors that have driven market expansion in recent years. The report also explores market dynamics, regulatory scenarios, and technological advancements that are shaping the industry. It assesses the impact of external factors and global economic changes on market growth. Lastly, it provides strategic recommendations for new entrants and established companies to navigate the complexities of the market.
Future Outlook:
- Demand for RF semiconductors will grow with the global expansion of 5G and beyond-5G networks.
- Adoption of GaN and SiC materials will accelerate due to efficiency and high-frequency performance needs.
- Electric vehicles and automotive radar systems will create new long-term application areas.
- Satellite communication and LEO constellations will drive specialized high-reliability RF component demand.
- Industrial IoT and smart infrastructure will expand use cases for compact, rugged RF power devices.
- Miniaturization and system-in-package designs will support integration into consumer electronics and wearables.
- Software-defined radios will increase the need for multi-band, wideband RF semiconductor solutions.
- Growth in defense modernization programs will sustain demand for advanced radar and EW systems.
- Supply chain localization and vertical integration will become strategic priorities for manufacturers.
- Energy-efficient designs will gain preference across telecom, data centers, and remote sensing applications.


