
Market Overview
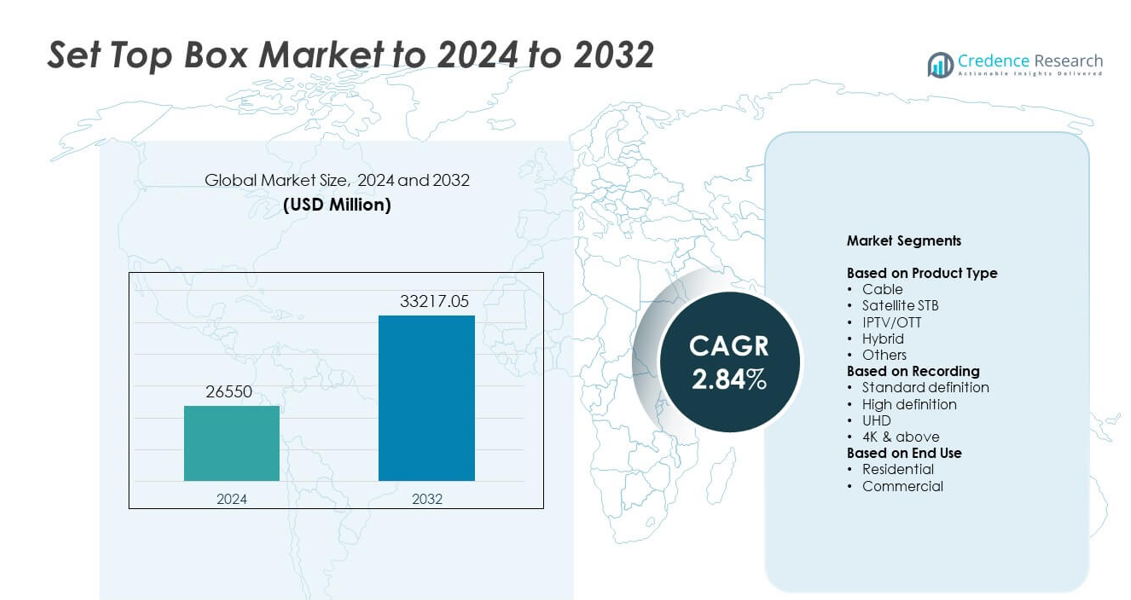
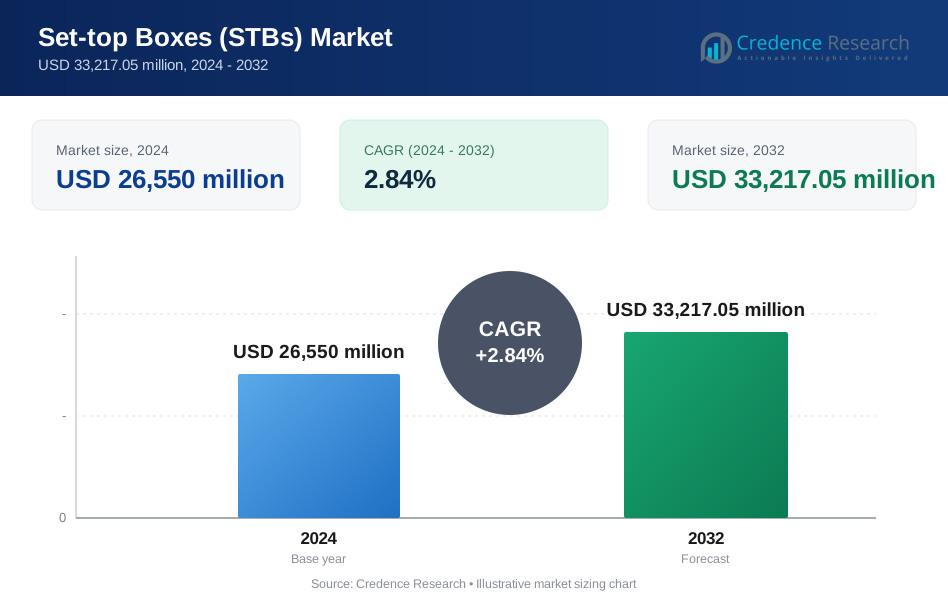
Set Top Box Market size was valued at USD 26,550 million in 2024 and is anticipated to reach USD 33,217.05 million by 2032, at a CAGR of 2.84% during the forecast period.
| REPORT ATTRIBUTE | DETAILS |
|---|---|
| Historical Period | 2020-2023 |
| Base Year | 2024 |
| Forecast Period | 2025-2032 |
| Set Top Box Market Size 2024 | USD 26,550 million |
| Set Top Box Market, CAGR | 2.84% |
| Set Top Box Market Size 2032 | USD 33,217.05 million |
The Set Top Box Market is shaped by major players such as Huawei, Kaon Media, ARRIS, Humax, Dish Network, Apple, CommScope, Intek Digital, and EchoStar, each driving innovation through hybrid, IPTV, and OTT-enabled devices. These companies compete by enhancing processing speed, picture quality, and integrated streaming capabilities. Asia Pacific leads the market with about 34% share, supported by large subscriber bases and rapid digital adoption. North America follows with nearly 32% share due to strong pay-TV penetration and advanced broadband networks, while Europe holds around 27% share driven by mature digital broadcasting standards.
Market Insights
- The Set Top Box Market reached USD 26,550 million in 2024 and will rise to USD 33,217.05 million by 2032 at a CAGR of 2.84%.
- Growth is driven by rising adoption of hybrid, IPTV, and OTT-enabled devices, supported by upgrades to HD, UHD, and 4K viewing formats.
- Key trends include cloud-based DVR expansion, voice-enabled interfaces, and integration of smart features that enhance user control and viewing flexibility.
- Competition intensifies as manufacturers advance processing speed, interface quality, and streaming integration, while facing pressure from smart TVs that reduce standalone STB demand.
- Asia Pacific leads the market with about 34% share, followed by North America at nearly 32% and Europe at around 27%, while cable units hold the highest segment share at about 39%.
Market Segmentation Analysis:
By Product Type
Cable set top boxes led the Set Top Box Market in 2024 with about 39% share. Strong demand came from established pay-TV networks that continue to serve large subscriber bases in emerging and developed markets. Cable units offer stable signal quality and support bundled broadband plans, which keeps adoption steady. Satellite STBs held notable use in rural areas with limited cable reach, while IPTV or OTT devices grew due to rising internet adoption. Hybrid models gained pace as operators promoted unified content access through integrated broadcast and streaming delivery.
- For instance, Sky reported Sky Q in 3.6 million homes in 2018, showing strong hybrid set-top box uptake.
By Recording
High definition units dominated this segment in 2024 with nearly 46% share. Broad adoption came from mainstream households that prefer clear picture quality at accessible prices. HD devices benefit from strong channel support, mature broadcasting standards, and lower upgrade costs. Standard definition systems declined as consumers shifted to higher-resolution screens, while UHD and 4K options rose in premium segments. Growth in smart TVs and improved broadband networks continued to push viewers toward better visual clarity and more advanced recording formats.
- For instance, Dish Network’s Hopper 3 DVR can record up to 16 programs at once and store about 500 hours of HD video.
By End Use
Residential users held the dominant position in 2024 with about 78% share. Households drove demand due to rising adoption of digital TV services, bundled operator plans, and platform upgrades from HD to UHD. The segment also expanded as families relied on hybrid and OTT-enabled boxes for mixed viewing needs. Commercial users, including hotels and corporate spaces, maintained stable demand, supported by structured entertainment systems and multi-room broadcast setups. Residential growth remained stronger due to wider device replacement cycles and expanding broadband penetration.
Key Growth Drivers
Rising Shift Toward Digital and Hybrid TV Platforms
Growing migration from analog to digital broadcasting continues to boost set top box demand. Hybrid models gain strong traction as viewers seek unified access to linear TV and streaming platforms. Operators promote upgrades through bundled broadband plans, which strengthens device replacement cycles. Expanding digital infrastructure in emerging regions also supports higher adoption. This broad transition remains a major growth driver across global markets.
- For instance, Comcast reported that it finished the year 2024 with approximately 12.5 million domestic video customersFor instance, Comcast reported that it finished the year 2024 with approximately 12.5 million domestic video customers
Expansion of High-Definition and Ultra-HD Content
The rapid increase in HD, UHD, and 4K content encourages households to replace older boxes with advanced units. Broadcasters invest in enhanced picture formats to improve viewer experience, pushing demand for compatible devices. Affordable HD and UHD TV sets also accelerate upgrades. Higher video quality expectations keep consumers shifting toward smarter, faster, and higher-resolution STBs, making this a key growth driver.
- For instance, Netflix offers thousands of titles in Australia, with its Premium plan enabling 4K Ultra HD streaming with HDR and Spatial Audio on up to four devices at once.
Growth in Broadband Penetration and IPTV or OTT Adoption
Improved broadband speeds and cheaper data plans support wider IPTV and OTT usage. Telecom operators integrate STBs with streaming services to offer flexible content choices. The shift toward connected viewing habits strengthens demand for internet-enabled boxes. Rising smart home adoption further supports device integration. This expansion in digital connectivity stands as another key growth driver for the market.
Key Trends & Opportunities
Integration of Voice Control and Smart Features
Manufacturers adopt voice assistants, AI-driven recommendations, and faster processors to enhance user experience. Smart features create opportunities for operators to deliver personalized content and interactive services. This shift aligns STBs with broader smart home ecosystems, expanding value beyond basic broadcasting. The trend allows companies to capture users seeking modern, intuitive, and connected entertainment devices.
- For instance, Amazon’s current 3rd Generation Fire TV Cube (released in 2022) uses an octa-core processor (with 4x 2.2 GHz and 4x 2.0 GHz cores) and includes eight far-field microphones for hands-free Alexa control.
Rising Demand for Cloud-Based DVR and Multi-Screen Viewing
Cloud DVR adoption reduces reliance on physical storage and offers flexible viewing options across devices. Operators leverage cloud infrastructure to provide remote access, extended recording hours, and seamless cross-platform playback. Multi-screen consumption creates new opportunities for integrated STB solutions that support mobile and tablet streaming. This trend enhances customer retention through convenience-driven service upgrades.
- For instance, Sling TV offered 50 hours of free cloud DVR storage and, in January 2025, introduced an optional paid add-on for an unlimited cloud DVR option for subscribers.
Key Challenges
Growing Competition from Smart TVs with Built-In Streaming
Smart TVs integrate OTT apps and advanced processing, reducing the need for separate set top boxes. Users prefer simplified setups with fewer devices, which pressures traditional STB shipments. Manufacturers must innovate through hybrid features, advanced interfaces, or value-added services to remain relevant. This shift in consumer preference stands as a major challenge for market expansion.
Rising Regulatory Pressure and Content Distribution Costs
Compliance with evolving broadcasting rules increases operational complexity for providers. Content licensing fees and spectrum management costs also impact pricing flexibility. Operators face pressure to balance affordability with upgraded technology, slowing rapid device replacement in some regions. This regulatory and cost burden forms a key challenge for sustained growth in the market.
Regional Analysis
North America
North America held about 32% share in 2024, supported by strong pay-TV penetration and widespread use of advanced HD and UHD set top boxes. Demand stayed steady as operators promoted hybrid and IPTV-based devices to retain subscribers in a competitive streaming landscape. Frequent upgrades to higher-resolution TVs also encouraged replacement of older STBs. Growth in OTT integration helped cable and satellite providers maintain relevance. The region benefited from robust broadband coverage, which strengthened adoption of connected and cloud-enabled recording features across households.
Europe
Europe accounted for nearly 27% share in 2024, driven by mature digital TV adoption and strong regulatory support for standardized broadcast technologies. Widespread preference for HD and UHD content encouraged migration to next-generation set top boxes. Hybrid models gained traction due to rising OTT usage across major markets. Operators invested in integrated viewing platforms to reduce churn and enhance user experience. Stable broadband networks across Western Europe supported IPTV growth, while Eastern Europe showed steady demand for cable and satellite units as households continued upgrading older devices.
Asia Pacific
Asia Pacific dominated the global market with about 34% share in 2024, backed by large subscriber bases and expanding digital infrastructure. Countries such as China and India saw rapid adoption of affordable cable and DTH services. Strong growth in broadband penetration supported rising IPTV and OTT-linked set top boxes. Urban households upgraded quickly to HD and UHD units, while rural regions continued to adopt basic digital boxes. Government-led digitization programs further accelerated market expansion. Increasing smart TV presence influenced hybrid device demand as consumers sought flexible and cost-effective viewing options.
Latin America
Latin America held around 4% share in 2024, shaped by steady demand for cable and satellite services across urban and semi-urban regions. Economic constraints slowed widespread upgrades, but digital migration kept base-level adoption stable. Operators introduced cost-efficient HD models to attract subscribers, while IPTV gained momentum in markets with improving broadband networks. The region relied heavily on bundled pay-TV packages, supporting continued use of traditional STBs. Gradual adoption of hybrid units emerged as streaming platforms expanded their presence and households sought mixed content access.
Middle East & Africa
Middle East & Africa captured nearly 3% share in 2024, driven by rising penetration of satellite TV services in areas with limited cable infrastructure. Demand increased for HD and UHD boxes as households adopted modern TV displays. Broadband expansion in Gulf countries enabled growing use of IPTV and hybrid units. Affordability remained a key factor in device selection across Africa, favoring basic digital set top boxes. Ongoing government-led digital switchovers supported gradual market growth, while expanding OTT availability encouraged operators to integrate streaming access into newer devices.
Market Segmentations:
By Product Type
- Cable
- Satellite STB
- IPTV/OTT
- Hybrid
- Others
By Recording
- Standard definition
- High definition
- UHD
- 4K & above
By End Use
- Residential
- Commercial
By Geography
- North America
- U.S.
- Canada
- Mexico
- Europe
- Germany
- France
- U.K.
- Italy
- Spain
- Rest of Europe
- Asia Pacific
- China
- Japan
- India
- South Korea
- South-east Asia
- Rest of Asia Pacific
- Latin America
- Brazil
- Argentina
- Rest of Latin America
- Middle East & Africa
- GCC Countries
- South Africa
- Rest of the Middle East and Africa
Competitive Landscape
The Set Top Box Market features leading participants such as Huawei, Kaon Media, ARRIS, Humax, Dish Network, Apple, CommScope, Intek Digital, and EchoStar. The competitive landscape is shaped by rapid innovation in hybrid platforms, IPTV integration, and cloud-based recording features. Companies focus on developing advanced interfaces, faster processors, and energy-efficient designs to enhance user experience and meet evolving viewing habits. Many brands emphasize partnerships with telecom operators to secure long-term service contracts and strengthen market reach. Growth in UHD and 4K broadcasting also drives upgrades, pushing manufacturers to offer devices with higher processing power. Expanding OTT adoption encourages firms to integrate streaming ecosystems and support multi-screen viewing. Intense price competition remains a factor in emerging regions, where affordability influences purchasing decisions. Across global markets, differentiation increasingly relies on software updates, seamless connectivity, and added-value digital services that improve platform engagement and extend device lifecycles.
Key Player Analysis
- Huawei
- Kaon Media
- ARRIS
- Humax
- Dish Network
- Apple
- CommScope
- Intek Digital
- EchoStar
Recent Developments
- In 2024, Apple released tvOS 18 for Apple TV 4K. The update added InSight, smarter subtitles, and new screen savers for viewers.
- In 2024, CommScope and du launched the VIP7802 4K Android TV set-top box. The device includes voice control and major streaming apps for du’s converged platform.
- In 2022, Dish Network introduced the Hopper Plus Android TV streaming add-on box. Hopper Plus turns existing Hopper DVRs into full streaming set-top hubs.
Report Coverage
The research report offers an in-depth analysis based on Product Type, Recording, End-Use and Geography. It details leading market players, providing an overview of their business, product offerings, investments, revenue streams, and key applications. Additionally, the report includes insights into the competitive environment, SWOT analysis, current market trends, as well as the primary drivers and constraints. Furthermore, it discusses various factors that have driven market expansion in recent years. The report also explores market dynamics, regulatory scenarios, and technological advancements that are shaping the industry. It assesses the impact of external factors and global economic changes on market growth. Lastly, it provides strategic recommendations for new entrants and established companies to navigate the complexities of the market.
Future Outlook
- The market will see steady demand as hybrid viewing becomes more common.
- IPTV and OTT-linked set top boxes will grow with rising broadband penetration.
- Cloud-based DVR functions will gain wider use due to ease of access.
- Higher adoption of UHD and 4K displays will push demand for advanced STBs.
- Smart features such as voice control and AI-based content suggestions will expand.
- Operators will integrate more streaming services to retain customer engagement.
- Emerging markets will drive shipment growth through ongoing digital migration.
- Competition from smart TVs will push manufacturers to offer value-added features.
- Energy-efficient and compact designs will gain preference among households.
- Software-driven upgrades will play a larger role in extending device life cycles.
Request a Free Sample
Fill in your details and we'll send you a free sample report.
- Sample data tables & charts
- Research methodology
Need a Custom Version of This Report?
Tailor the scope, geography, or segments to your exact requirements.
- Custom geography or segment scope
- Direct access to our analyst team
Frequently Asked Questions
What is the current market size for Set Top Box Market, and what is its projected size in 2032?
At what Compound Annual Growth Rate is the Set Top Box Market projected to grow between 2024 and 2032?
In terms of the type of set-top box, which market category is leading?
Which connectivity category is anticipated to grow at the fastest rate throughout the projected period?
Which major companies lead the global market for set-top boxes (STBs)?
Which market factors are the primary drivers of the set-top boxes (STBs) industry?
What main market challenges prevent the growth of the set-top boxes (STBs) sector?
What are the main market opportunities for the set-top boxes (STBs) sector?
Table of Content
Chapter 1. Report Introduction
- 1.1 Report Description & Purpose
- 1.1.1 Report Title & Market Definition
- 1.1.2 Unique Selling Propositions (USP) & Key Differentiators
- 1.1.3 Value Proposition for Stakeholders
- 1.2 Research Objectives
- 1.2.1 Market Sizing Objectives (Volume & Revenue)
- 1.2.2 Segmentation Objectives
- 1.2.3 Competitive Intelligence Objectives
- 1.2.4 Forecast & Scenario Objectives
- 1.3 Report Scope
- 1.3.1 Set-top Boxes (STBs) Scope – Types & Subtypes Covered
- 1.3.2 Geographic Scope – Regions & Countries Covered
- 1.3.3 Historical Period, Base Year & Forecast Period (2024; forecast to 2032)
- 1.3.4 Inclusions & Exclusions
- 1.4 HS Code & Classification Framework
- 1.5 Currency, Units & Pricing Basis
- 1.6 Target Stakeholders
- 1.7 Limitations & Assumptions
Chapter 2. Executive Summary
- 2.1 Global Set-top Boxes (STBs) Market Snapshot
- 2.1.1 Market Size – Historical (2024) & Forecast (2024-2032) (2024: USD 26,550 million → 2032: USD 33,217.05 million)
- 2.1.2 Volume & Revenue – Global Totals
- 2.1.3 Key Market Highlights – Top Five Facts
- 2.2 Set-top Boxes (STBs) Market Segmentation Snapshot
- 2.2.1 Market Split by Region – 2024 vs. 2032
- 2.3 Competitive Snapshot
- 2.3.1 Top 10 Players by Revenue Share – 2024
- 2.3.2 Top 10 Players by Volume Share – 2024
- 2.3.3 Recent Strategic Developments (18-Month Summary)
- 2.4 Key Investment Highlights & Strategic Conclusions
Chapter 3. Set-top Boxes (STBs) Market Dynamics & Industry Analysis
- 3.1 Market Overview & Context
- 3.1.1 Set-top Boxes (STBs) Market Position in the Broader Automotive Value Chain
- 3.1.2 OEM vs. Replacement Market Dynamics
- 3.1.3 Market Maturity & Development Stage by Region
- 3.2 Set-top Boxes (STBs) Market Drivers
- 3.3 Set-top Boxes (STBs) Market Restraints & Challenges
- 3.4 Set-top Boxes (STBs) Market Opportunities
- 3.5 Porter's Five Forces Analysis
- 3.5.1 Threat of New Entrants
- 3.5.2 Bargaining Power of Suppliers
- 3.5.3 Bargaining Power of Buyers
- 3.5.4 Threat of Substitutes
- 3.5.5 Competitive Rivalry – Intensity Assessment
- 3.6 Set-top Boxes (STBs) Value Chain Analysis
- 3.6.1 Upstream – Raw Material/Input Suppliers
- 3.6.1.1 Raw Material/Input 1
- 3.6.1.2 Raw Material/Input 2
- 3.6.1.3 Raw Material/Input 3
- 3.6.2 Midstream – Production/Manufacturing/Service Delivery
- 3.6.2.1 Production/Process Overview
- 3.6.2.2 Key Facility Locations & Capacity by Manufacturer
- 3.6.3 Downstream – Distribution & End Consumer
- 3.6.3.1 Primary Channel – B2B/OEM
- 3.6.3.2 Secondary Channels – Dealer, Retail, Online, Direct
- 3.6.4 Value Chain Profitability Analysis
- 3.6.1 Upstream – Raw Material/Input Suppliers
- 3.7 PESTEL Analysis
- 3.7.1 Political Factors
- 3.7.2 Economic Factors
- 3.7.3 Social Factors
- 3.7.4 Technological Factors
- 3.7.5 Environmental Factors
- 3.7.6 Legal Factors
- 3.8 Set-top Boxes (STBs) Supply Chain Analysis
- 3.8.1 Raw Material/Input Supply Risk Assessment
- 3.8.2 Manufacturing Concentration Risk (Geographic Exposure)
- 3.8.3 Trade Disruption Impact Analysis
- 3.9 Regulatory & Policy Landscape
Note: The regulatory and policy landscape section covers regulations based on their applicability to the market, Set-top Boxes (STBs) category, geography, and scope of the study. Only regulatory frameworks with a material impact on operations, compliance, trade, sustainability, or market access are analyzed in detail.
Chapter 4. Key Investment Pockets & Opportunity Analysis
- 4.1 Set-top Boxes (STBs) Market Attractiveness Analysis
- 4.1.1 By Region – Investment Attractiveness Matrix (Volume × CAGR)
- 4.2 Absolute Revenue Growth Opportunity
- 4.2.1 By Region – Absolute USD Growth Through 2032
- 4.3 Incremental Volume Opportunity
- 4.3.1 By Region – Incremental Volume Through 2032
- 4.3.2 Segment – Incremental Volume
- 4.4 Emerging Submarket Opportunity Deep Dive (Subject to Applicability)
- 4.5 Emerging Market Opportunity Scorecards
- 4.5.1 United States
- 4.5.2 Europe
- 4.5.3 Asia
- 4.5.4 Middle East & Africa
Note: Emerging Market Opportunity Scorecards will be included based on relevance and strategic importance. Regions listed are indicative and may vary depending on data availability and market dynamics.
Chapter 5. Set-top Boxes (STBs) Import-Export Analysis & Trade Flows
- 5.1 Global Trade Overview
- 5.1.1 Global Export Value by Country (2024)
- 5.1.2 Global Export Volume by Country (2024)
- 5.1.3 Global Import Value by Country (2024)
- 5.1.4 Global Import Volume by Country (2024)
- 5.1.5 Net Trade Balance by Country (2024)
- 5.2 Export Analysis – Segment
- 5.2.1 Type 1 (HS Code)
- 5.2.2 Type 2 (HS Code)
- 5.2.3 Type 3 (HS Code)
- 5.2.4 Type 4 (HS Code)
- 5.2.5 Type 5 (HS Code)
- 5.3 Import Analysis – Segment
- 5.3.1 Type 1 (HS Code)
- 5.3.2 Type 2 (HS Code)
- 5.3.3 Type 3 (HS Code)
- 5.3.4 Type 4 (HS Code)
- 5.3.5 Type 5 (HS Code)
- 5.4 Average Unit Trade Prices
- 5.4.1 Average Export Price – Segment & Country
- 5.4.2 Average Import Price – Segment & Source Country
- 5.4.3 Price Trends (2024)
- 5.5 Key Trade Route Analysis
- 5.5.1 Trade Route 1
- 5.5.2 Trade Route 2
- 5.5.3 Trade Route 3
- 5.5.4 Trade Route 4
- 5.5.5 Trade Route 5
- 5.6 Trade Policy Impact Assessment
- 5.6.1 US Anti-Dumping & Section 301 Tariffs
- 5.6.2 EU Customs Union Impact
- 5.6.3 Major Free Trade Agreements
- 5.6.4 USMCA Rules of Origin
Note: Trade policy analysis will be included only where relevant to the Set-top Boxes (STBs) market.
Chapter 6. Competitive Landscape & Company Benchmarking
- 6.1 Set-top Boxes (STBs) Market Concentration & Structure
- 6.1.1 Herfindahl-Hirschman Index (HHI) – vs. 2024
- 6.1.2 Tier 1, Tier 2 & Tier 3 Market Structure
- 6.1.3 Global, Regional & Local Player Dynamics
- 6.2 Set-top Boxes (STBs) Market Share Analysis – 2024
- 6.2.1 Global Revenue Share by Company
- 6.2.2 Global Volume Share by Company
- 6.2.3 Regional Revenue Share
- 6.2.4 Market Share Evolution ( vs. 2024)
- 6.2.5 OEM Segment Share by Company
- 6.2.6 Replacement Segment Share by Company
- 6.3 Production/Delivery Capacity & Facility Analysis
- 6.3.1 Global Installed Capacity
- 6.3.2 Capacity Utilization Rates
- 6.3.3 Production/Output Volume
- 6.3.4 Facility Locations & Capacity Map
- 6.3.5 Planned Capacity Additions
- 6.4 Set-top Boxes (STBs) Competitive Benchmarking Matrix
- 6.4.1 Revenue, Volume, CAGR & Profitability Comparison
- 6.4.2 Channel Revenue Mix
- 6.4.3 Geographic Revenue Exposure
- 6.4.4 R&D Intensity
- 6.4.5 Sustainability Maturity
- 6.5 Strategic Developments in Set-top Boxes (STBs) (Last 24 Months)
- 6.5.1 Mergers, Acquisitions & Divestments
- 6.5.2 New Set-top Boxes (STBs) Launches
- 6.5.3 Facility Expansions
- 6.5.4 Strategic Alliances, Joint Ventures & Partnerships
- 6.5.5 Distribution Expansion & Market Entry
- 6.5.6 Sustainability & ESG Initiatives
- 6.6 Competitive Strategy Mapping
- 6.6.1 Leader, Challenger, Follower & Niche Classification
- 6.6.2 Pricing Strategy Comparison
- 6.6.3 Channel Strategy Matrix
Note: Strategic developments are included based on their materiality and the availability of reliable information.
Chapter 7. Global Set-top Boxes (STBs) Market – By Distribution Channel
- 7.1 Segment Overview
- 7.1.1 Volume & Revenue Split by Channel (2024 & 2032)
- 7.1.2 Channel Mix Evolution (2024-2032)
Chapter 8. Regional Market Analysis – Global Overview
- 8.1 Global Regional Overview
- 8.1.1 Regional Volume Share
- 8.1.2 Regional Revenue Share
- 8.1.3 Regional Volume by Region
- 8.1.4 Regional Revenue by Region
- 8.1.5 Regional Forecast Through 2032
- 8.2 Cross-Regional Segment Analysis
- 8.2.1 By Distribution Channel
- 8.2.2 By Brand/Price Tier
Chapter 9. North America Set-top Boxes (STBs) Market
- 9.1 United States
- 9.2 Canada
- 9.3 Mexico
Chapter 10. Europe Set-top Boxes (STBs) Market
- 10.1 Germany
- 10.2 France
- 10.3 Italy
- 10.4 United Kingdom
- 10.5 Spain
- 10.6 Poland
- 10.7 Russia
- 10.8 Netherlands
- 10.9 Belgium
- 10.10 Sweden
- 10.11 Denmark
- 10.12 Norway
- 10.13 Rest of Europe
Chapter 11. Asia Pacific Set-top Boxes (STBs) Market
- 11.1 China
- 11.2 India
- 11.3 Japan
- 11.4 South Korea
- 11.5 Thailand
- 11.6 Indonesia
- 11.7 Vietnam
- 11.8 Malaysia
- 11.9 Australia
- 11.10 Rest of Asia Pacific
Chapter 12. Latin America Set-top Boxes (STBs) Market
- 12.1 Brazil
- 12.2 Argentina
- 12.3 Colombia
- 12.4 Chile
- 12.5 Rest of Latin America
Chapter 13. Middle East Set-top Boxes (STBs) Market
- 13.1 Saudi Arabia
- 13.2 United Arab Emirates
- 13.3 Turkey
- 13.4 Israel
- 13.5 Iran
- 13.6 Rest of the Middle East
Chapter 14. Africa Set-top Boxes (STBs) Market
- 14.1 South Africa
- 14.2 Egypt
- 14.3 Nigeria
- 14.4 Morocco
- 14.5 Rest of Africa
Chapter 15. Set-top Boxes (STBs) Company Profiles
- 15.1 [Company 01]
- 15.1.1 Company Overview
- 15.1.2 Key Management Personnel
- 15.1.3 Products & Services Portfolio
- 15.1.4 Financial Performance
- 15.1.5 Key Market Focus & Geographic Presence
- 15.1.6 Recent Developments & Strategic Initiatives
Note: The company profile list is preliminary and may change based on research findings, market developments, data availability, and client requirements.
Chapter 16. Appendices
- Appendix A – List of Abbreviations & Acronyms
- Appendix B – Industry Classification Code Reference – Full Series
- Appendix C – Production & Capacity Data Tables
- Appendix D – End-Use & Demand Base Tables
- Appendix E – Consumption & Replacement Rate Assumptions
- Appendix F – ASP Reference Tables
- Appendix G – Manufacturing & Facility Database
- Appendix H – Import-Export Data Tables
- Appendix I – Regulatory Summary Tables
- Appendix J – Primary Research Participant List (Anonymized)
- Appendix K – Primary Research Questionnaire Framework
- Appendix L – Data Sources & Bibliography
- Appendix M – Market Size Divergence & Source Comparison
Chapter 17. Research Methodology
- 17.1 Research Framework & Philosophy
- 17.2 Secondary Research – Sources, Hierarchy & Data Extraction
- 17.3 Data Modeling – Bottom-Up & Top-Down Market Sizing
- 17.4 Primary Research – Stakeholder Framework, LOI & Sample Sizes
- 17.5 Forecast Methodology – Regression, Scenario & Sensitivity Analysis
- 17.6 Quality Control – Four-Layer Validation Framework
- 17.7 Limitations & Standard Assumptions
- 17.8 Disclaimer
