Home » Energy » Solar Power Windows Market

Solar Power Windows Market by Type (Clear Films Solar Power Windows, Vacuum Coated Films Solar Power Windows, Dyed Films Solar Power Windows) by Application (Residential, Commercial, Others)- Growth, Future Prospects And Competitive Analysis, 2016 – 2028

Price: $4999

Published: | Report ID: 10509 | Report Format : PDF

Solar Power Windows Market Analysis

The solar power windows market is expected to rise steadily over the next decade. The solar power windows market will flourish worldwide because there is an overall consensus that carbon emissions must be reduced. The high pollution level that fossil fuel combustion leads to is also a significant cause for concern. It is hoped that fossil fuels will be replaced by clean solar power, thereby solving its pollution problem. Renewable energy and solar power windows will play a key role in transforming energy generation. As a result of this, the Paris agreement was signed by a large number of countries to shift power generation from fossil fuels to renewable energy and, in particular solar power.

Solar Power Windows Market

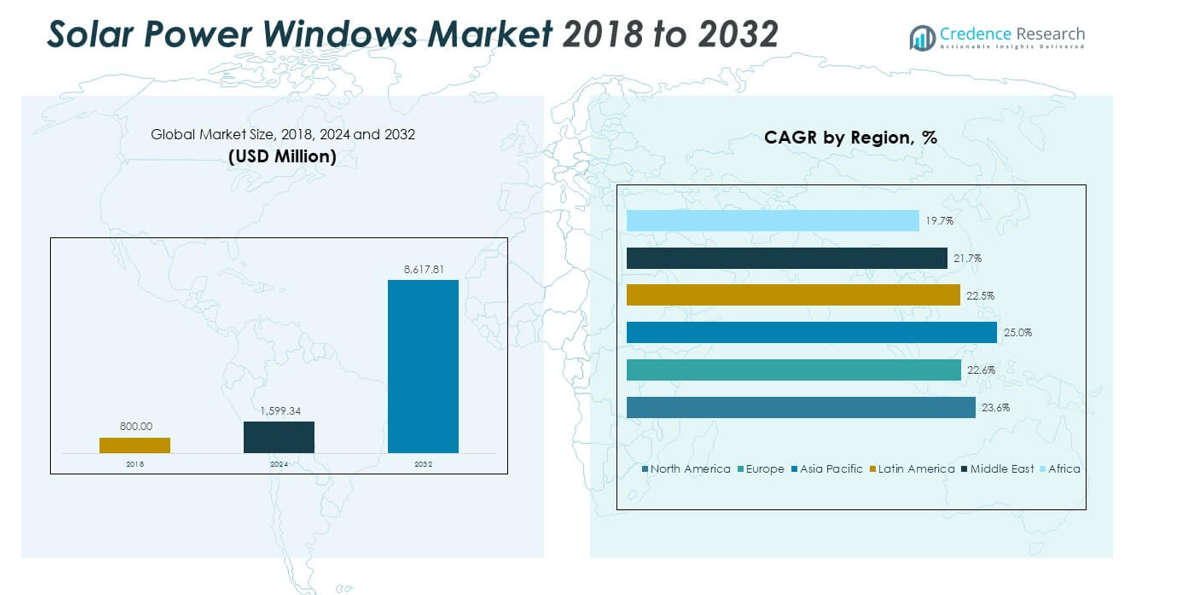
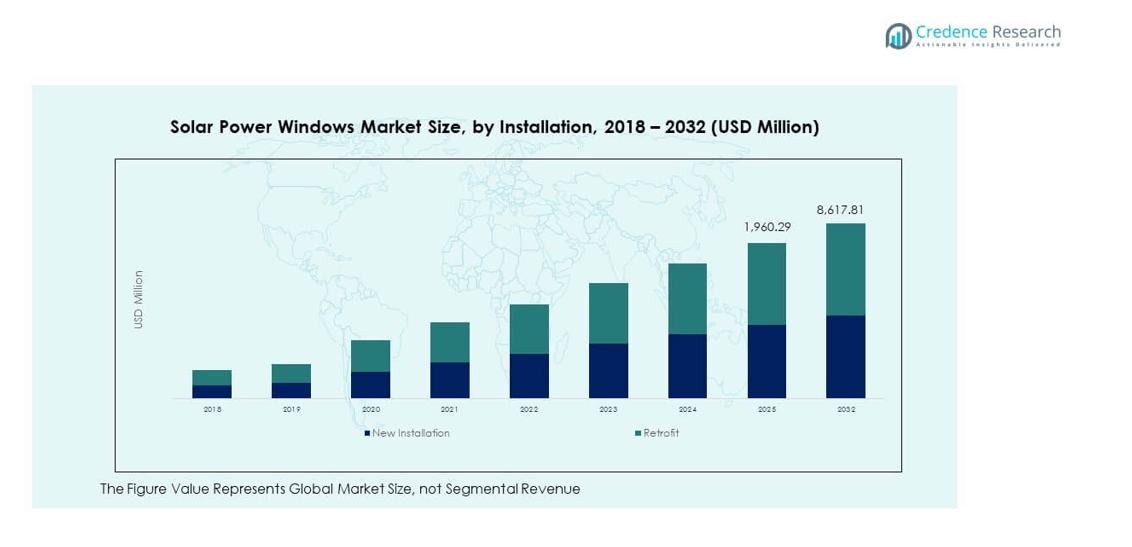
The Global Solar Power Windows market is expected to witness a CAGR of 6.17% during the forecast period. The revenue generated by the global Solar Power Windows market in 2021 was over USD 555.61 million and is expected to generate revenue worth USD 895.03 million in 2028. Therefore, the incremental growth opportunity offered by the global Solar Power Windows is estimated to be USD 5.29 billion between 2022 and 2028.

Interesting Facts about Solar Power Windows Industry

  • Solar Power Windows have a lifespan of 30 years
  • Solar Power Windows cost ranges from USD 3.5 to USD 5.5 per square feet
  • Solar Power Windows are highly efficient and have recorded 14.72% (+/- 0.29%) power conversion efficiency
  • Europe is the most dominant region in the global Solar Power Windows market
  • China is the fastest growing market for Solar Power Windows
Design Element 2

Access crucial information at unmatched prices!

Request your free sample report today & start making informed decisions powered by Credence Research!

Download Free Sample
CTA Design Element 3

Essential Source of Sustainable Energy Yet Cost Effective.

What’s more, solar power will also lead to another critical advantage: lower costs. Since no fuels are burnt to produce solar energy, it is generated for free just by the input of the sun’s rays. However, there are installation costs that will need to be covered. But once the investment is recovered, there will be few to no operational expenses. Hence, solar power windows are the answer to cheaper energy.

Since solar energy does not require the input of expensive and limited fossil fuels, there is a significant incentive for developing solar power windows. As a result, this technology will scale at an ever-increasing rate over the next five years and beyond.

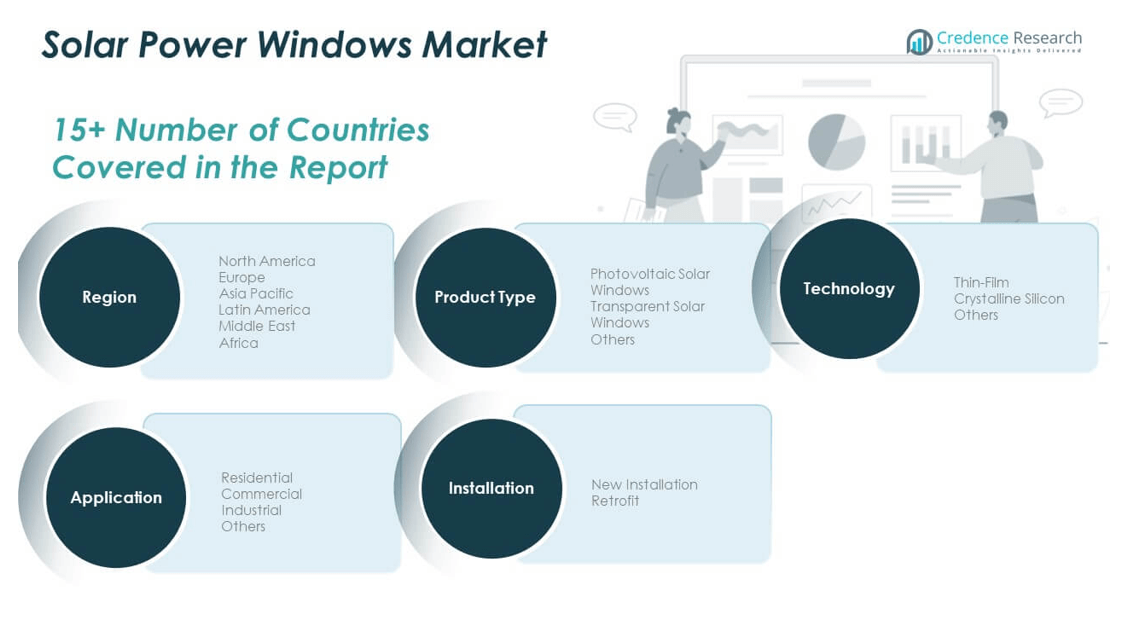
Explicit Films Solar Power Windows, Vacuum Coated Films Solar Power Windows, and Dyed Films Solar Power Windows are some critical segments in the global Solar Power Windows industry.

Most Efficient Way to Overcome Global Warming 

The key to mitigating the risk of global warming and climate change is to invest in solar power windows so that electricity generation through renewables may rise substantially to several terabytes worldwide. And this is already beginning to happen. Over the past few years, there have been increased investments in renewable energy and solar power windows. As a result, solar energy generating capacity has gone up around the world’s solar energy is capable of better performance and higher efficiencies thanks to evolving technology. Solar power technology is improving at a phenomenal rate.

Further Need for Extensive Investment in Research 

However, a lot of work still needs to be done. Further research is necessary so that investment costs can go down. The cost of installation of solar power windows is still high. However, ongoing research and development work will bring down investment costs. This will make solar energy more cost-effective and viable for energy production. Residential, Commercial, and Others are some critical application segments of the global Solar Power Windows market.

Shape Your Report to Specific Countries or Regions & Enjoy 30% Off!

Reducing Cost of Installation Can Boost the Demand

For solar energy to become more widespread, it needs to become as cost-effective as fossil fuels. Although solar power windows are being heavily subsidized, more work will need to be done to reduce the cost of solar investment. When that happens, there will be more significant investments in solar energy. Furthermore, a big part of making solar energy generation more widespread is reducing the cost of its components like inverters, racks, and other types of hardware. As a result of all these factors, solar power windows will undergo a meteoric growth rate over the next decade or so. Oxford Photovoltaics, Star 8 International Ltd, Physee, Brite Solar, Polysolar, SolarGaps, Onyx Solar Energy S.L, Solaria Corporation, EnergyGlass, Solar Window Technologies Inc., and Ubiquitous Energy Inc. are some of the most prominent players. They are poised to play a vital role in further research & development in the field of the global Solar Power Windows market.

1.Preface
1.1.Report Description
1.1.1.Purpose of the Report
1.1.2.Target Audience
1.1.3.USP and Key Offerings
1.2.Research Scope
1.3.Research Methodology
1.3.1.Phase I – Secondary Research
1.3.2.Phase II – Primary Research
1.3.3.Phase III – Expert Panel Review
1.3.4.Approach Adopted
1.3.4.1.Top-Down Approach
1.3.4.2.Bottom-Up Approach
1.3.5.Assumptions
1.4.Market Segmentation

2.Executive Summary
2.1.Market Snapshot: Global Solar Power Windows Market

3.Market Dynamics & Factors Analysis
3.1.Introduction
3.1.1. Global Solar Power Windows Market Value, 2016-2028, (US$ Bn)
3.2.Market Dynamics
3.2.1.Key Growth Trends
3.2.2.Major Industry Challenges
3.2.3.Key Growth Pockets
3.3.Attractive Investment Proposition,2021
3.3.1.Type
3.3.2.Application
3.3.3.Geography
3.4.Porter’s Five Forces Analysis
3.4.1.Threat of New Entrants
3.4.2.Bargaining Power of Buyers/Consumers
3.4.3.Bargaining Power of Suppliers
3.4.4.Threat of Substitute Types
3.4.5.Intensity of Competitive Rivalry
3.5.Value Chain Analysis

4.Market Positioning of Key Players, 2021
4.1.Company market share of key players, 2021
4.2.Top 6 Players
4.3.Top 3 Players
4.4.Major Strategies Adopted by Key Players

5.COVID 19 Impact Analysis
5.1.Global Solar Power Windows Market Pre Vs Post COVID 19, 2019 – 2028
5.2.Impact on Import & Export
5.3.Impact on Demand & Supply

6.North America
6.1.North America Solar Power Windows Market, by Country, 2016-2028(US$ Bn)
6.1.1.U.S.
6.1.2.Canada
6.1.3.Mexico
6.2.North America Solar Power Windows Market, by Type, 2016-2028(US$ Bn)
6.2.1.Overview
6.2.2.Clear Films Solar Power Windows
6.2.3.Vacuum Coated Films Solar Power Windows
6.2.4.Dyed Films Solar Power Windows
6.3.North America Solar Power Windows Market, by Application, 2016-2028(US$ Bn)
6.3.1.Overview
6.3.2.Residential
6.3.3.Commercial
6.3.4.Others

7.Europe
7.1.Europe Solar Power Windows Market, by Country, 2016-2028(US$ Bn)
7.1.1.UK
7.1.2.France
7.1.3.Germany
7.1.4.Italy
7.1.5.Russia
7.1.6.Spain
7.1.7.Belgium
7.1.8.Netherland
7.1.9.Austria
7.1.10.Sweden
7.1.11.Poland
7.1.12.Denmark
7.1.13.Switzerland
7.1.14.Rest of Europe
7.2.Europe Solar Power Windows Market, by Type, 2016-2028(US$ Bn)
7.2.1.Overview
7.2.2.Clear Films Solar Power Windows
7.2.3.Vacuum Coated Films Solar Power Windows
7.2.4.Dyed Films Solar Power Windows
7.3.Europe Solar Power Windows Market, by Application, 2016-2028(US$ Bn)
7.3.1.Overview
7.3.2.Residential
7.3.3.Commercial
7.3.4.Others

8.Asia Pacific
8.1.Asia Pacific Solar Power Windows Market, by Country, 2016-2028(US$ Bn)
8.1.1.China
8.1.2.Japan
8.1.3.South Korea
8.1.4.India
8.1.5.Australia
8.1.6.New Zealand
8.1.7.Taiwan
8.1.8.Southeast Asia
8.1.9.Central Asia
8.1.10.Rest of Asia Pacific
8.2.Asia Pacific Solar Power Windows Market, by Type, 2016-2028(US$ Bn)
8.2.1.Overview
8.2.2.Clear Films Solar Power Windows
8.2.3.Vacuum Coated Films Solar Power Windows
8.2.4.Dyed Films Solar Power Windows
8.3.Asia Pacific Solar Power Windows Market, by Application, 2016-2028(US$ Bn)
8.3.1.Overview
8.3.2.Residential
8.3.3.Commercial
8.3.4.Others

9.Latin America
9.1.Latin America Solar Power Windows Market, by Country, 2016-2028(US$ Bn)
9.1.1.Brazil
9.1.2.Argentina
9.1.3.Peru
9.1.4.Chile
9.1.5.Colombia
9.1.6.Rest of Latin America
9.2.Latin America Solar Power Windows Market, by Type, 2016-2028(US$ Bn)
9.2.1.Overview
9.2.2.Clear Films Solar Power Windows
9.2.3.Vacuum Coated Films Solar Power Windows
9.2.4.Dyed Films Solar Power Windows
9.3.Latin America Solar Power Windows Market, by Application, 2016-2028(US$ Bn)
9.3.1.Overview
9.3.2.Residential
9.3.3.Commercial
9.3.4.Others

10.Middle East
10.1.Middle East Solar Power Windows Market, by Country, 2016-2028(US$ Bn)
10.1.1.UAE
10.1.2.KSA
10.1.3.Israel
10.1.4.Turkey
10.1.5.Iran
10.1.6.Rest of Middle East
10.2.Middle East Solar Power Windows Market, by Type, 2016-2028(US$ Bn)
10.2.1.Overview
10.2.2.Clear Films Solar Power Windows
10.2.3.Vacuum Coated Films Solar Power Windows
10.2.4.Dyed Films Solar Power Windows
10.3.Middle East Solar Power Windows Market, by Application, 2016-2028(US$ Bn)
10.3.1.Overview
10.3.2.Residential
10.3.3.Commercial
10.3.4.Others

11.Africa
11.1.Africa Solar Power Windows Market, by Country, 2016-2028(US$ Bn)
11.1.1.South Africa
11.1.2.Egypt
11.1.3.Nigeria
11.1.4.Rest of Africa
11.2.Africa Solar Power Windows Market, by Type, 2016-2028(US$ Bn)
11.2.1.Overview
11.2.2.Clear Films Solar Power Windows
11.2.3.Vacuum Coated Films Solar Power Windows
11.2.4.Dyed Films Solar Power Windows
11.3.Africa Solar Power Windows Market, by Application, 2016-2028(US$ Bn)
11.3.1.Overview
11.3.2.Residential
11.3.3.Commercial
11.3.4.Others

12.Global
12.1.Global Solar Power Windows Market, by Type, 2016-2028(US$ Bn)
12.1.1.Overview
12.1.2.Clear Films Solar Power Windows
12.1.3.Vacuum Coated Films Solar Power Windows
12.1.4.Dyed Films Solar Power Windows
12.2.Global Solar Power Windows Market, by Application, 2016-2028(US$ Bn)
12.2.1.Overview
12.2.2.Residential
12.2.3.Commercial
12.2.4.Others
13.Company Profiles
13.1.Oxford Photovoltaics
13.2.Star 8 International Ltd
13.3.Physee
13.4.Brite Solar
13.5.Polysolar
13.6.SolarGaps
13.7.Onyx Solar Energy S.L
13.8.Solaria Corporation
13.9.EnergyGlass
13.10.Solar Window Technologies Inc.
13.11.Ubiquitous Energy Inc.
13.12.Others


List of Figures

FIG. 1Global Solar Power Windows Market: Research Methodology
FIG. 2Market Size Estimation – Top Down & Bottom up Approach
FIG. 3Global Solar Power Windows Market Segmentation
FIG. 4Global Solar Power Windows Market, by Type, 2019 (US$ Bn)
FIG. 5Global Solar Power Windows Market, by Application, 2021 (US$ Bn)
FIG. 6Global Solar Power Windows Market, by Geography, 2021 (US$ Bn)
FIG. 7Attractive Investment Proposition, by Geography, 2021
FIG. 8Global Market Positioning of Key Solar Power Windows Market Manufacturers, 2019
FIG. 9Global Solar Power Windows Market Value Contribution, By Type, 2021 & 2028 (Value %)
FIG. 10Global Solar Power Windows Market, by Clear Films Solar Power Windows, Value, 2016-2028 (US$ Bn)
FIG. 11Global Solar Power Windows Market, by Dyed Films Solar Power Windows, Value, 2016-2028 (US$ Bn)
FIG. 12Global Solar Power Windows Market, by Vacuum Coated Films Solar Power Windows, Value, 2016-2028 (US$ Bn)
FIG. 13Global Solar Power Windows Market Value Contribution, By Application, 2021 & 2028 (Value %)
FIG. 14Global Solar Power Windows Market, by Residential, Value, 2016-2028 (US$ Bn)
FIG. 15Global Solar Power Windows Market, by Commercial, Value, 2016-2028 (US$ Bn)
FIG. 16Global Solar Power Windows Market, by Others, Value, 2016-2028 (US$ Bn)
FIG. 17U.S. Solar Power Windows Market, 2016-2028 (US$ Bn)
FIG. 18Rest of North America Solar Power Windows Market, 2016-2028 (US$ Bn)
FIG. 19U.K. Solar Power Windows Market, 2016-2028 (US$ Bn)
FIG. 20Germany Solar Power Windows Market, 2016-2028 (US$ Bn)
FIG. 21France Solar Power Windows Market, 2016-2028 (US$ Bn)
FIG. 22Italy Solar Power Windows Market, 2016-2028 (US$ Bn)
FIG. 23Spain Solar Power Windows Market, 2016-2028 (US$ Bn)
FIG. 24Russia Solar Power Windows Market, 2016-2028 (US$ Bn)
FIG. 25BENELUX Solar Power Windows Market, 2016-2028 (US$ Bn)
FIG. 26Poland Solar Power Windows Market, 2016-2028 (US$ Bn)
FIG. 27Austria Solar Power Windows Market, 2016-2028 (US$ Bn)
FIG. 28Rest of Europe Solar Power Windows Market, 2016-2028 (US$ Bn)
FIG. 29Japan Solar Power Windows Market, 2016-2028 (US$ Bn)
FIG. 30China Solar Power Windows Market, 2016-2028 (US$ Bn)
FIG. 31India Solar Power Windows Market, 2016-2028 (US$ Bn)
FIG. 32South Korea Solar Power Windows Market, 2016-2028 (US$ Bn)
FIG. 33Australia Solar Power Windows Market, 2016-2028 (US$ Bn)
FIG. 34Southeast Asia Solar Power Windows Market, 2016-2028 (US$ Bn)
FIG. 35Rest of Asia Pacific Solar Power Windows Market, 2016-2028 (US$ Bn)
FIG. 36Middle East & Africa Solar Power Windows Market, 2016-2028 (US$ Bn)
FIG. 37South Africa Solar Power Windows Market, 2016-2028 (US$ Bn)
FIG. 38Nigeria Solar Power Windows Market, 2016-2028 (US$ Bn)
FIG. 39Egypt Solar Power Windows Market, 2016-2028 (US$ Bn)
FIG. 40GCC Solar Power Windows Market, 2016-2028 (US$ Bn)
FIG. 41Israel Solar Power Windows Market, 2016-2028 (US$ Bn)
FIG. 42Latin America Solar Power Windows Market, 2016-2028 (US$ Bn)
FIG. 43Mechanicalzil Solar Power Windows Market, 2016-2028 (US$ Bn)
FIG. 44Argentina Solar Power Windows Market, 2016-2028 (US$ Bn)
FIG. 45Colombia Solar Power Windows Market, 2016-2028 (US$ Bn)
FIG. 46Peru Solar Power Windows Market, 2016-2028 (US$ Bn)
FIG. 47Chile Solar Power Windows Market, 2016-2028 (US$ Bn)

List of Tables

TABLE 1Market Snapshot: Global Beauty Devices (Solar Power Windows) Market
TABLE 2Global Solar Power Windows Market, by Type, 2016-2028 (US$ Bn)
TABLE 3Global Solar Power Windows Market, by Application, 2016-2028 (US$ Bn)
TABLE 4Global Solar Power Windows Market, by Geography, 2016-2028 (US$ Bn)
TABLE 5North America Solar Power Windows Market, by Type, 2016-2028 (US$ Bn)
TABLE 6North America Solar Power Windows Market, by Application, 2016-2028 (US$ Bn)
TABLE 7North America Solar Power Windows Market, by Country, 2016-2028 (US$ Bn)
TABLE 8Europe Solar Power Windows Market, by Type, 2016-2028 (US$ Bn)
TABLE 9Europe Solar Power Windows Market, by Application, 2016-2028 (US$ Bn)
TABLE 10Europe Solar Power Windows Market, by Country/Region, 2016-2028 (US$ Bn)
TABLE 11Asia Pacific Solar Power Windows Market, by Type, 2016-2028 (US$ Bn)
TABLE 12Asia Pacific Solar Power Windows Market, by Application, 2016-2028 (US$ Bn)
TABLE 13Asia Pacific Solar Power Windows Market, by Country/Region, 2016-2028 (US$ Bn)
TABLE 14Latin America Solar Power Windows Market, by Type, 2016-2028 (US$ Bn)
TABLE 15Latin America Solar Power Windows Market, by Application, 2016-2028 (US$ Bn)
TABLE 16Latin America Solar Power Windows Market, by Country/Region, 2016-2028 (US$ Bn)
TABLE 17Middle East Solar Power Windows Market, by Type, 2016-2028 (US$ Bn)
TABLE 18Middle East Solar Power Windows Market, by Application, 2016-2028 (US$ Bn)
TABLE 19Middle East Solar Power Windows Market, by Country/Region, 2016-2028 (US$ Bn)
TABLE 20Africa Solar Power Windows Market, by Type, 2016-2028 (US$ Bn)
TABLE 21Africa Solar Power Windows Market, by Application, 2016-2028 (US$ Bn)
TABLE 22Africa Solar Power Windows Market, by Country/Region, 2016-2028 (US$ Bn)

Frequently Asked Questions:

How COVID 19 Impacted Solar Power Windows Market?

Likewise other industries, COVID 19 also taken a toll on Solar Power Windows market with around 12.64% decline in its revenue in 2020 as compare to 2019

Which is the leading regional market for Solar Power Windows?

Europe is the largest regional market with highest share in the total volume of Solar Power Windows consumed in 2021

What is the major growth driving factors for global Solar Power Windows market?

Growing demand for sustainable yet cost effective source of energy is primary factor fuelling the growth of global Solar Power Windows market

Which is major segment in Solar Power Windows market by application?

Residential segment dominated the Solar Power Windows market in 2021 with over 40% share

Which is major segment in Solar Power Windows market by type?

Clear Films Solar Power Windows was the largest type of Solar Power Windows in 2021 with over 45% share

U.S. Ground Power Unit Market

Published:
Report ID: 36528

Germany Ground Power Unit Market

Published:
Report ID: 36282

Solar Generator Market

Published:
Report ID: 36226

Drilling Fluids Market

Published:
Report ID: 5398

Gas Engines Market

Published:
Report ID: 6044

India Solar Canopy Carport Market

Published:
Report ID: 36081

Intelligent Pigging Services Market

Published:
Report ID: 6909

Drill Bits Market

Published:
Report ID: 5399

Air Compressor Market

Published:
Report ID: 2818

Pipeline Leak Detection Market

Published:
Report ID: 9703

Pressure Pumping Market

Published:
Report ID: 6029

UK Ground Power Unit Market

Published:
Report ID: 35478

Purchase Options

$2999
Delivery Format: Excel.
$4999
Designed for the individual purchaser.
$6999
Users located at a single corporate site or regional office.
$7999
Allowed for unlimited sharing globally within one company.
Smallform of Sample request

Have a question?

User Profile

Don’t settle for less – trust Mitul to help you find the best solution.

Report delivery within 24 to 48 hours

– Other Info –

What people say?-

User Review

I am very impressed with the information in this report. The author clearly did their research when they came up with this product and it has already given me a lot of ideas.

Jana Schmidt
CEDAR CX Technologies

– Connect with us –

Phone

+91 6232 49 3207


support

24/7 Research Support


sales@credenceresearch.com

– Research Methodology –

Going beyond the basics: advanced techniques in research methodology

– Trusted By –

Pepshi, LG, Nestle
Motorola, Honeywell, Johnson and johnson
LG Chem, SIEMENS, Pfizer
Unilever, Samsonite, QIAGEN