
| REPORT ATTRIBUTE | DETAILS |
|---|---|
| Historical Period | 2019-2022 |
| Base Year | 2023 |
| Forecast Period | 2024-2032 |
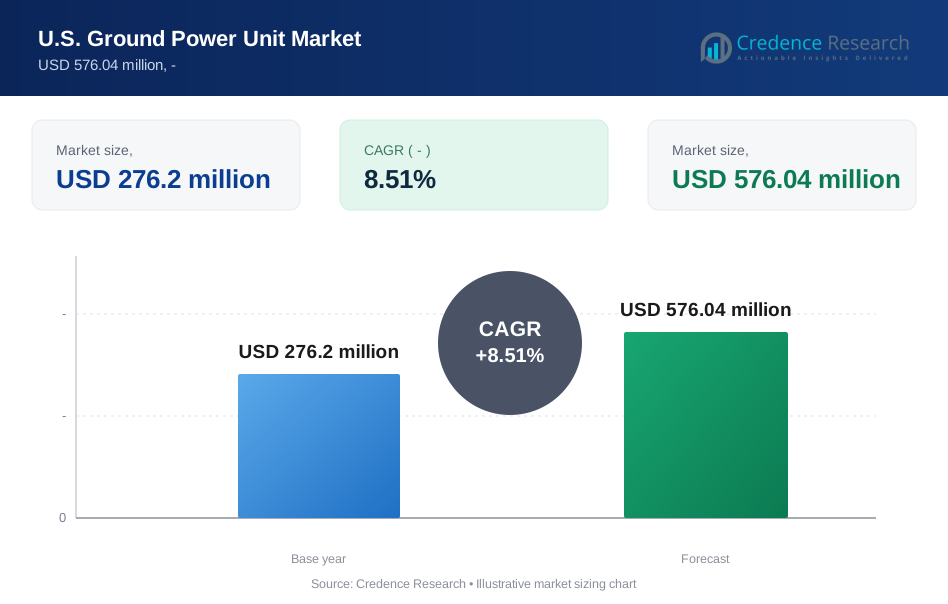
| U.S. Ground Power Unit Market Size 2023 | USD 276.2 Million |
| U.S. Ground Power Unit Market, CAGR | 8.51% |
| U.S. Ground Power Unit Market Size 2032 | USD 576.04 Million |
Market Overview
The U.S. Ground Power Unit (GPU) market is set to experience significant growth, with its value forecasted to escalate from USD 276.2 million in 2023 to USD 576.04 million by 2032, representing a robust Compound Annual Growth Rate (CAGR) of 8.51%. As a critical element of the aerospace and defense industry, Ground Power Units are essential for aircraft maintenance and operations, providing electrical power to parked aircraft for engine starting, onboard system functioning, and maintenance activities. The market's evolution is propelled by technological innovation, regulatory mandates, and shifting consumer demands.
The competitive landscape of the U.S. Ground Power Unit market features a broad spectrum of participants from established manufacturers to dynamic startups. Leading companies like ITW GSE, JBT Corporation, AERO Specialties, Tronair, and Hobart Ground Power dominate the market with their extensive GPU offerings. These firms continuously innovate and engage in strategic partnerships to enhance their market presence.
Drivers of growth within the U.S. Ground Power Unit market include the expanding aviation sector and increased air travel, which sustain the demand for GPUs at airports, military bases, and commercial facilities throughout the nation. Additionally, strict environmental standards and heightened sustainability focus drive manufacturers toward developing greener and more energy-efficient solutions, thereby broadening the market scope. Technological advancements are central to market development, with companies focusing on enhancing GPU efficiency, reliability, and safety. The integration of digital controls, remote monitoring, and predictive maintenance technologies not only improves performance but also minimizes downtime and operational costs. Moreover, the shift towards electric and hybrid GPUs underscores the industry’s commitment to sustainable practices.
Despite these growth prospects, the U.S. Ground Power Unit market encounters challenges such as high initial costs for advanced systems, which can be prohibitive for small to medium-sized enterprises. Variations in raw material prices and geopolitical tensions affect manufacturing costs and supply chain stability. Additionally, stringent regulatory and safety standards require ongoing compliance and adaptation.
Segmentation Analysis
By Type:
Fixed Ground Power Units offer a dependable and permanent power solution for parked aircraft at airports and aviation facilities. Installed in designated locations, these systems ensure a stable power supply for critical operations such as maintenance, pre-flight checks, and passenger boarding. Their reliability and consistent power output make them well-suited for high-traffic airports and military installations where continuous power is paramount. On the other hand, Mobile Ground Power Units provide flexibility and portability, enabling easy transportation and deployment across various locations. Mounted on trailers or vehicles, these units offer on-the-go power solutions, catering to aircraft operating in remote areas or temporary facilities. With their versatility, Mobile GPUs find applications in civil airports, military bases, business aviation, and other scenarios requiring rapid deployment and mobility.
By Application:
Civil airports represent a significant segment of the U.S. GPU market, driven by increasing air traffic and passenger volumes. Ground Power Units deployed at these airports serve a diverse array of aircraft, facilitating smooth operations, quick turnaround times, and passenger comfort. Military airports, on the other hand, require rugged and high-performance GPU systems capable of withstanding demanding operational environments. These systems support various military aircraft while adhering to stringent security and reliability standards essential for defense operations. Lastly, business airports cater to executive and corporate aviation, prioritizing efficiency, reliability, and convenience for discerning business travelers and aviation professionals seeking seamless aircraft services and support.
Segments:
By Type:
- Fixed
- Mobile
By Application:
- Civil Airports
- Military Airports
- Business Airports
- Others
By Region:
- Northeast
- South
- Midwest
- West
- Mountain
Market Drivers
Rising air traffic:
The Federal Aviation Administration (FAA) has indeed predicted a substantial increase in air traffic within the United States. According to the FAA’s annual aviation forecast, the nation’s aviation system will continue to grow over the next two decades, with greater numbers of people expected to fly more miles each year. The FAA Aerospace Forecast for Fiscal Years 2023 to 2043 projects Revenue Passenger Miles (RPMs) growth for U.S. air carriers to average 2.5 percent per year over the 20-year forecast. This surge in air travel will necessitate a corresponding increase in the availability of ground power units (GPUs) to support the growing number of airplanes on the ground.
Expansion of Airport Infrastructure:
Airports across the United States are indeed undergoing extensive expansion projects to accommodate the increasing number of passengers and ccargo. For instance, the new LaGuardia Airport in New York is undergoing major upgrades, with three of its four terminals getting significant improvements. Similarly, John F. Kennedy International Airport in New York is set for a $13 billion investment, which will add international terminal complexes on the airport’s north and south sides, increasing capacity by 15 million passengers a year. As airport infrastructure expands, there is a corresponding demand for new ground power units to support the growing fleet of aircraft.
Increasing Aircraft Maintenance Needs:
With the growing number of aging aircraft in the U.S. fleet, there is a concurrent increase in the demand for ground power units for maintenance purposes. For instance, many of the aircraft that form the backbone of the U.S. Air Force operational fleet are 25 years old or older. Some fleets now exceed 50 years old. This aging fleet necessitates regular maintenance, which in turn drives the demand for GPUs. Ground power units play a vital role in powering aircraft systems during maintenance procedures, ensuring that maintenance tasks can be performed efficiently and safely. For example, GPUs are increasingly being used in machine learning applications for predictive maintenance. These applications require high-speed analysis, which GPUs are well-equipped to handle.
Stricter Environmental Regulations:
In response to environmental concerns, there is a growing focus on reducing emissions and noise pollution at airports. This heightened awareness has led to increased regulatory scrutiny and the implementation of stricter environmental regulations within the aviation industry. For instance, the International Air Transport Association (IATA) has developed Environment & Sustainability Manuals that contain standards and industry guidance to support sustainability initiatives for the aviation value chain. As a result, there is a rising demand for cleaner and quieter ground power units, such as electric and hybrid-electric GPUs. These environmentally friendly alternatives offer reduced emissions and noise levels compared to traditional GPU systems powered by fossil fuels.
Market Trends
Growth in Mobile GPU Segment:
Mobile GPUs, known for their maneuverability and ability to service multiple airplanes, are poised to dominate the market. For instance, the global Mobile GPU market is segmented by types such as Independent GPU and Integrated GPU. This trend is propelled by the increasing need for efficiency and flexibility in airport operations. As airports strive to accommodate growing air traffic and dynamic operational demands, the demand for mobile GPU systems is expected to surge. These units offer versatility and adaptability, making them well-suited for civil airports, military bases, business aviation, and other applications requiring rapid deployment and mobility.
Rise of Electric and Hybrid GPUs:
Electric and hybrid GPUs are gaining momentum in response to stricter environmental regulations and a concerted effort to reduce emissions. These eco-friendly alternatives offer quieter operation and lower emissions compared to traditional diesel-powered models. For example, modern cars require powerful GPUs, especially if used for autonomous driving. With sustainability becoming a focal point in aviation, the adoption of electric and hybrid GPUs is expected to increase, driving innovation and market growth. Manufacturers are investing in research and development to enhance the efficiency and performance of electric and hybrid GPU systems, catering to the evolving needs of environmentally conscious customers.
Focus on Efficiency and Connectivity:
Manufacturers are prioritizing the development of GPUs with improved fuel efficiency and advanced monitoring systems. These features enable better control over energy consumption and facilitate proactive maintenance scheduling, resulting in optimized performance and reduced operational costs. Additionally, enhanced connectivity features allow for seamless integration with airport infrastructure and aircraft systems, further improving operational efficiency and reliability.
Potential for Standardization:
There is a growing push for standardization in ground power unit design and operation, driven by the need for interoperability and compatibility between different GPUs and aircraft. Standardization efforts aim to streamline processes, reduce complexity, and enhance overall efficiency within the aviation industry. By establishing common standards and protocols, stakeholders can facilitate smoother operations and minimize potential disruptions, ultimately benefiting both airports and airlines.
Impact of New Technologies:
Advancements in battery technology and power management systems hold the potential to revolutionize the GPU market, leading to the development of more efficient and powerful electric GPUs. Improved energy storage capabilities and enhanced power delivery systems could significantly enhance the performance and reliability of electric GPU solutions, further driving their adoption across various aviation applications.
Integration of Advanced Technologies:
Market analysts anticipate the integration of advanced technologies such as remote control and automation in GPU systems. These technological innovations have the potential to improve safety, increase operational efficiency, and reduce human error in GPU operations. By leveraging remote monitoring capabilities and automation features, stakeholders can enhance operational visibility, streamline workflows, and optimize resource allocation, ultimately driving greater efficiency and productivity within the U.S. GPU market.
Market Restraints and Challenges
High Operational Costs:
Traditional diesel-powered GPUs incur significant operational costs attributed to fuel expenses and regular servicing requirements. The fluctuating nature of passenger numbers further exacerbates this burden for airports and airlines, impacting their operational budgets. The maintenance and operation of diesel units can strain financial resources, posing challenges for organizations seeking to optimize operational efficiency while managing costs effectively.
Environmental Concerns:
Diesel-powered GPUs contribute to air and noise pollution at airports, raising environmental concerns and prompting calls for cleaner alternatives. With stricter regulations aimed at reducing emissions and noise levels, there is growing pressure on airports and airlines to transition to environmentally friendly GPU solutions. Addressing these environmental concerns requires investment in cleaner technologies and the adoption of sustainable practices to mitigate the impact of ground operations on the surrounding environment.
Limited Range of Electric GPUs:
Electric GPUs offer an attractive solution for reducing emissions; however, their effectiveness can be limited by battery capacity and recharging times. The range of electric GPUs may not always meet the demands of continuous operations, particularly in high-traffic airport environments. Additionally, lengthy recharging times compared to refueling diesel units can pose logistical challenges and impact operational efficiency, limiting the widespread adoption of electric GPU solutions.
High Upfront Costs of New Technologies:
While electric and hybrid GPUs offer environmental benefits, their higher upfront costs present a barrier to adoption for some airports and airlines. The initial investment required to procure and install new technology can be prohibitive, particularly for organizations operating on constrained budgets. Despite the long-term cost savings associated with reduced fuel consumption and maintenance requirements, the high initial capital outlay may deter some stakeholders from embracing innovative GPU solutions.
Lack of Standardization:
The lack of standardization in GPU design and operation can lead to compatibility issues between different units and aircraft, resulting in inefficiencies and increased costs. Inconsistencies in interface standards and communication protocols hinder interoperability, complicating maintenance procedures and hindering operational flexibility. Establishing common standards and protocols is essential to promote interoperability and streamline operations within the GPU market, facilitating smoother workflows and reducing compatibility-related challenges.
Integration Challenges:
Integrating new technologies like automation and remote control into GPUs presents complex challenges and requires significant investment. The implementation of advanced features necessitates the development of sophisticated control systems and robust communication networks to ensure seamless integration with existing infrastructure. Overcoming integration challenges requires collaboration between stakeholders and investment in research and development to develop scalable and interoperable solutions that enhance operational efficiency and safety within the GPU market.
Key Players
- Textron (the U.S.)
- TLD (France)
- Tronair (the U.S.)
- Velocity Airport Solutions (Sweden)
- MAK Controls & Systems Pvt. Limited (India)
- AERO Specialties Inc. (the U.S.)
- BertoliSrl (Italy)
- Dynell GmbH (Austria)
- ITW GSE (Denmark)
- JBT (the U.S.)
- Powervamp Ltd. (the U.K.)
- Start PAC (the U.S.)
- WeihaiGuangtai Airport Equipment Co. (China)
Recent Developments
In January 2019, AERO Specialties unveiled the JetGo 300 Ground Power Unit, marking a significant addition to their product line. The JetGo 300 stands out for its compact design, user-friendly interface, and cost-efficient operation. Notably, it boasts environmental benefits, emitting a low dBA signature and reducing CO2 emissions. This launch underscores AERO Specialties' commitment to innovation and sustainability within the aviation ground support equipment sector.
In January 2019, JBT Corporation announced the signing of an agreement to acquire LEKTRO, a prominent manufacturer of electric aviation ground support equipment. This strategic acquisition reflects JBT's commitment to expanding its portfolio and enhancing its position in the market. By integrating LEKTRO's expertise in electric GSE manufacturing, JBT aims to capitalize on the growing demand for sustainable aviation solutions. The acquisition is poised to synergize the strengths of both companies, fostering innovation and driving advancements in electric ground support equipment technologies.
Regional Analysis
Northeast
The Northeast region, comprising states such as New York, Pennsylvania, and Massachusetts, accounts for a significant portion of the U.S. Ground Power Unit (GPU) market. With a dense concentration of major airports and airline hubs, this region experiences a high demand for GPUs to ensure efficient ground operations. The Northeast market share stands at approximately 22%, driven by the presence of bustling air transportation hubs like John F. Kennedy International Airport, Newark Liberty International Airport, and Logan International Airport. These airports require a steady supply of GPUs to power aircraft during ground operations, maintenance, and preflight checks. Furthermore, the Northeast region boasts a robust manufacturing sector, contributing to the demand for GPUs in industrial settings.
South
The South region, encompassing states like Texas, Florida, and Georgia, holds a market share of approximately 25% in the U.S. GPU market. This sizable share can be attributed to the region's thriving aviation industry and the presence of several major airports, such as Hartsfield-Jackson Atlanta International Airport, Dallas/Fort Worth International Airport, and Miami International Airport. These airports require a constant supply of GPUs to support their extensive ground operations and ensure uninterrupted air travel. Additionally, the South region's robust oil and gas industry has contributed significantly to the demand for GPUs. Oil refineries, drilling rigs, and exploration sites often operate in remote locations with limited access to traditional power sources.
Midwest
The Midwest region, comprising states like Illinois, Ohio, and Michigan, accounts for approximately 18% of the U.S. GPU market share. This region's strong manufacturing base, particularly in the automotive and heavy machinery sectors, drives the demand for GPUs. Assembly plants and factories in the Midwest rely on these units to provide backup power during maintenance activities, equipment testing, and production line operations.
Furthermore, the region's agricultural sector has also contributed to the GPU market's growth. Farms and agricultural facilities often require portable power sources to operate machinery, irrigation systems, and other equipment in remote locations.
West
The West region, encompassing states like California, Washington, and Arizona, holds a market share of approximately 20% in the U.S. GPU market. This region's diverse industries, including technology, aerospace, and entertainment, have fueled the demand for GPUs. Silicon Valley, a hub for tech giants and startups, requires GPUs to power data centers, research facilities, and testing labs, ensuring continuous operations and minimizing downtime.
Additionally, the entertainment industry in Los Angeles and Hollywood relies on GPUs to power various production sets, outdoor filming locations, and special effects equipment.
Future Outlook
- The U.S. Ground Power Unit Market is expected to experience significant growth driven by the increasing demand for efficient airport operations.
- Advancements in technology, particularly in electric and hybrid GPU solutions, will play a pivotal role in shaping the market's future.
- Mobile GPU systems will continue to gain traction due to their flexibility and ability to serve multiple aircraft across various locations.
- Environmental concerns will drive the adoption of cleaner and quieter GPU alternatives, aligning with sustainability initiatives.
- Standardization efforts will streamline operations and improve compatibility between different GPU units and aircraft models.
- Integration of advanced features such as automation and remote control will enhance operational efficiency and safety.
- Rising air traffic and infrastructure expansion projects will create opportunities for market growth and expansion.
- Collaboration between industry stakeholders will drive innovation and foster the development of tailored GPU solutions.
- The aftermarket segment for maintenance-related GPU services is expected to grow as the number of aging aircraft increases.
- Overall, the U.S. GPU market is poised for continued evolution, with a focus on sustainability, efficiency, and technological innovation to meet the evolving needs of the aviation industry.
Request a Free Sample
Fill in your details and we'll send you a free sample report.
- Sample data tables & charts
- Research methodology
Need a Custom Version of This Report?
Tailor the scope, geography, or segments to your exact requirements.
- Custom geography or segment scope
- Direct access to our analyst team
Frequently Asked Questions
What factors are driving the growth of the U.S. Ground Power Unit (GPU) market?
Who are the key players in the U.S. GPU market, and what strategies do they employ?
What are the significant market trends observed in the U.S. GPU market?
What are the challenges faced by the U.S. GPU market, and how are they being addressed?
What is the future outlook for the U.S. GPU market?
Table of Content
Chapter 1. Report Introduction
- 1.1 Report Description & Purpose
- 1.1.1 Report Title & Market Definition
- 1.1.2 Unique Selling Propositions (USP) & Key Differentiators
- 1.1.3 Value Proposition for Stakeholders
- 1.2 Research Objectives
- 1.2.1 Market Sizing Objectives (Volume & Revenue)
- 1.2.2 Segmentation Objectives
- 1.2.3 Competitive Intelligence Objectives
- 1.2.4 Forecast & Scenario Objectives
- 1.3 Report Scope
- 1.3.1 U.S. Ground Power Unit Scope – Types & Subtypes Covered
- 1.3.2 Geographic Scope – Regions & Countries Covered
- 1.3.3 Historical Period, Base Year & Forecast Period (the historical period; forecast to the forecast period)
- 1.3.4 Inclusions & Exclusions
- 1.4 HS Code & Classification Framework
- 1.5 Currency, Units & Pricing Basis
- 1.6 Target Stakeholders
- 1.7 Limitations & Assumptions
Chapter 2. Executive Summary
- 2.1 Global U.S. Ground Power Unit Market Snapshot
- 2.1.1 Market Size – Historical (the historical period) & Forecast (the forecast period) (base year: USD 276.2 million → forecast year: USD 576.04 million)
- 2.1.2 Volume & Revenue – Global Totals
- 2.1.3 Key Market Highlights – Top Five Facts
- 2.2 U.S. Ground Power Unit Market Segmentation Snapshot
- 2.2.1 Market Split by Region – vs.
- 2.3 Competitive Snapshot
- 2.3.1 Top 10 Players by Revenue Share –
- 2.3.2 Top 10 Players by Volume Share –
- 2.3.3 Recent Strategic Developments (18-Month Summary)
- 2.4 Key Investment Highlights & Strategic Conclusions
Chapter 3. U.S. Ground Power Unit Market Dynamics & Industry Analysis
- 3.1 Market Overview & Context
- 3.1.1 U.S. Ground Power Unit Market Position in the Broader Automotive Value Chain
- 3.1.2 OEM vs. Replacement Market Dynamics
- 3.1.3 Market Maturity & Development Stage by Region
- 3.2 U.S. Ground Power Unit Market Drivers
- 3.3 U.S. Ground Power Unit Market Restraints & Challenges
- 3.4 U.S. Ground Power Unit Market Opportunities
- 3.5 Porter's Five Forces Analysis
- 3.5.1 Threat of New Entrants
- 3.5.2 Bargaining Power of Suppliers
- 3.5.3 Bargaining Power of Buyers
- 3.5.4 Threat of Substitutes
- 3.5.5 Competitive Rivalry – Intensity Assessment
- 3.6 U.S. Ground Power Unit Value Chain Analysis
- 3.6.1 Upstream – Raw Material/Input Suppliers
- 3.6.1.1 Raw Material/Input 1
- 3.6.1.2 Raw Material/Input 2
- 3.6.1.3 Raw Material/Input 3
- 3.6.2 Midstream – Production/Manufacturing/Service Delivery
- 3.6.2.1 Production/Process Overview
- 3.6.2.2 Key Facility Locations & Capacity by Manufacturer
- 3.6.3 Downstream – Distribution & End Consumer
- 3.6.3.1 Primary Channel – B2B/OEM
- 3.6.3.2 Secondary Channels – Dealer, Retail, Online, Direct
- 3.6.4 Value Chain Profitability Analysis
- 3.6.1 Upstream – Raw Material/Input Suppliers
- 3.7 PESTEL Analysis
- 3.7.1 Political Factors
- 3.7.2 Economic Factors
- 3.7.3 Social Factors
- 3.7.4 Technological Factors
- 3.7.5 Environmental Factors
- 3.7.6 Legal Factors
- 3.8 U.S. Ground Power Unit Supply Chain Analysis
- 3.8.1 Raw Material/Input Supply Risk Assessment
- 3.8.2 Manufacturing Concentration Risk (Geographic Exposure)
- 3.8.3 Trade Disruption Impact Analysis
- 3.9 Regulatory & Policy Landscape
Note: The regulatory and policy landscape section covers regulations based on their applicability to the market, U.S. Ground Power Unit category, geography, and scope of the study. Only regulatory frameworks with a material impact on operations, compliance, trade, sustainability, or market access are analyzed in detail.
Chapter 4. Key Investment Pockets & Opportunity Analysis
- 4.1 U.S. Ground Power Unit Market Attractiveness Analysis
- 4.1.1 By Region – Investment Attractiveness Matrix (Volume × CAGR)
- 4.2 Absolute Revenue Growth Opportunity
- 4.2.1 By Region – Absolute USD Growth Through the forecast period
- 4.3 Incremental Volume Opportunity
- 4.3.1 By Region – Incremental Volume Through the forecast period
- 4.3.2 Segment – Incremental Volume
- 4.4 Emerging Submarket Opportunity Deep Dive (Subject to Applicability)
- 4.5 Emerging Market Opportunity Scorecards
- 4.5.1 United States
- 4.5.2 Europe
- 4.5.3 Asia
- 4.5.4 Middle East & Africa
Note: Emerging Market Opportunity Scorecards will be included based on relevance and strategic importance. Regions listed are indicative and may vary depending on data availability and market dynamics.
Chapter 5. U.S. Ground Power Unit Import-Export Analysis & Trade Flows
- 5.1 Global Trade Overview
- 5.1.1 Global Export Value by Country (the historical period)
- 5.1.2 Global Export Volume by Country (the historical period)
- 5.1.3 Global Import Value by Country (the historical period)
- 5.1.4 Global Import Volume by Country (the historical period)
- 5.1.5 Net Trade Balance by Country (the historical period)
- 5.2 Export Analysis – Segment
- 5.2.1 Type 1 (HS Code)
- 5.2.2 Type 2 (HS Code)
- 5.2.3 Type 3 (HS Code)
- 5.2.4 Type 4 (HS Code)
- 5.2.5 Type 5 (HS Code)
- 5.3 Import Analysis – Segment
- 5.3.1 Type 1 (HS Code)
- 5.3.2 Type 2 (HS Code)
- 5.3.3 Type 3 (HS Code)
- 5.3.4 Type 4 (HS Code)
- 5.3.5 Type 5 (HS Code)
- 5.4 Average Unit Trade Prices
- 5.4.1 Average Export Price – Segment & Country
- 5.4.2 Average Import Price – Segment & Source Country
- 5.4.3 Price Trends (the historical period)
- 5.5 Key Trade Route Analysis
- 5.5.1 Trade Route 1
- 5.5.2 Trade Route 2
- 5.5.3 Trade Route 3
- 5.5.4 Trade Route 4
- 5.5.5 Trade Route 5
- 5.6 Trade Policy Impact Assessment
- 5.6.1 US Anti-Dumping & Section 301 Tariffs
- 5.6.2 EU Customs Union Impact
- 5.6.3 Major Free Trade Agreements
- 5.6.4 USMCA Rules of Origin
Note: Trade policy analysis will be included only where relevant to the U.S. Ground Power Unit market.
Chapter 6. Competitive Landscape & Company Benchmarking
- 6.1 U.S. Ground Power Unit Market Concentration & Structure
- 6.1.1 Herfindahl-Hirschman Index (HHI) – vs.
- 6.1.2 Tier 1, Tier 2 & Tier 3 Market Structure
- 6.1.3 Global, Regional & Local Player Dynamics
- 6.2 U.S. Ground Power Unit Market Share Analysis –
- 6.2.1 Global Revenue Share by Company
- 6.2.2 Global Volume Share by Company
- 6.2.3 Regional Revenue Share
- 6.2.4 Market Share Evolution ( vs. )
- 6.2.5 OEM Segment Share by Company
- 6.2.6 Replacement Segment Share by Company
- 6.3 Production/Delivery Capacity & Facility Analysis
- 6.3.1 Global Installed Capacity
- 6.3.2 Capacity Utilization Rates
- 6.3.3 Production/Output Volume
- 6.3.4 Facility Locations & Capacity Map
- 6.3.5 Planned Capacity Additions
- 6.4 U.S. Ground Power Unit Competitive Benchmarking Matrix
- 6.4.1 Revenue, Volume, CAGR & Profitability Comparison
- 6.4.2 Channel Revenue Mix
- 6.4.3 Geographic Revenue Exposure
- 6.4.4 R&D Intensity
- 6.4.5 Sustainability Maturity
- 6.5 Strategic Developments in U.S. Ground Power Unit (Last 24 Months)
- 6.5.1 Mergers, Acquisitions & Divestments
- 6.5.2 New U.S. Ground Power Unit Launches
- 6.5.3 Facility Expansions
- 6.5.4 Strategic Alliances, Joint Ventures & Partnerships
- 6.5.5 Distribution Expansion & Market Entry
- 6.5.6 Sustainability & ESG Initiatives
- 6.6 Competitive Strategy Mapping
- 6.6.1 Leader, Challenger, Follower & Niche Classification
- 6.6.2 Pricing Strategy Comparison
- 6.6.3 Channel Strategy Matrix
Note: Strategic developments are included based on their materiality and the availability of reliable information.
Chapter 7. Global U.S. Ground Power Unit Market – By Distribution Channel
- 7.1 Segment Overview
- 7.1.1 Volume & Revenue Split by Channel ( & )
- 7.1.2 Channel Mix Evolution (the forecast period)
Chapter 8. Regional Market Analysis – Global Overview
- 8.1 Global Regional Overview
- 8.1.1 Regional Volume Share
- 8.1.2 Regional Revenue Share
- 8.1.3 Regional Volume by Region
- 8.1.4 Regional Revenue by Region
- 8.1.5 Regional Forecast Through the forecast period
- 8.2 Cross-Regional Segment Analysis
- 8.2.1 By Distribution Channel
- 8.2.2 By Brand/Price Tier
Chapter 9. North America U.S. Ground Power Unit Market
- 9.1 United States
- 9.2 Canada
- 9.3 Mexico
Chapter 10. Europe U.S. Ground Power Unit Market
- 10.1 Germany
- 10.2 France
- 10.3 Italy
- 10.4 United Kingdom
- 10.5 Spain
- 10.6 Poland
- 10.7 Russia
- 10.8 Netherlands
- 10.9 Belgium
- 10.10 Sweden
- 10.11 Denmark
- 10.12 Norway
- 10.13 Rest of Europe
Chapter 11. Asia Pacific U.S. Ground Power Unit Market
- 11.1 China
- 11.2 India
- 11.3 Japan
- 11.4 South Korea
- 11.5 Thailand
- 11.6 Indonesia
- 11.7 Vietnam
- 11.8 Malaysia
- 11.9 Australia
- 11.10 Rest of Asia Pacific
Chapter 12. Latin America U.S. Ground Power Unit Market
- 12.1 Brazil
- 12.2 Argentina
- 12.3 Colombia
- 12.4 Chile
- 12.5 Rest of Latin America
Chapter 13. Middle East U.S. Ground Power Unit Market
- 13.1 Saudi Arabia
- 13.2 United Arab Emirates
- 13.3 Turkey
- 13.4 Israel
- 13.5 Iran
- 13.6 Rest of the Middle East
Chapter 14. Africa U.S. Ground Power Unit Market
- 14.1 South Africa
- 14.2 Egypt
- 14.3 Nigeria
- 14.4 Morocco
- 14.5 Rest of Africa
Chapter 15. U.S. Ground Power Unit Company Profiles
- 15.1 [Company 01]
- 15.1.1 Company Overview
- 15.1.2 Key Management Personnel
- 15.1.3 Products & Services Portfolio
- 15.1.4 Financial Performance
- 15.1.5 Key Market Focus & Geographic Presence
- 15.1.6 Recent Developments & Strategic Initiatives
Note: The company profile list is preliminary and may change based on research findings, market developments, data availability, and client requirements.
Chapter 16. Appendices
- Appendix A – List of Abbreviations & Acronyms
- Appendix B – Industry Classification Code Reference – Full Series
- Appendix C – Production & Capacity Data Tables
- Appendix D – End-Use & Demand Base Tables
- Appendix E – Consumption & Replacement Rate Assumptions
- Appendix F – ASP Reference Tables
- Appendix G – Manufacturing & Facility Database
- Appendix H – Import-Export Data Tables
- Appendix I – Regulatory Summary Tables
- Appendix J – Primary Research Participant List (Anonymized)
- Appendix K – Primary Research Questionnaire Framework
- Appendix L – Data Sources & Bibliography
- Appendix M – Market Size Divergence & Source Comparison
Chapter 17. Research Methodology
- 17.1 Research Framework & Philosophy
- 17.2 Secondary Research – Sources, Hierarchy & Data Extraction
- 17.3 Data Modeling – Bottom-Up & Top-Down Market Sizing
- 17.4 Primary Research – Stakeholder Framework, LOI & Sample Sizes
- 17.5 Forecast Methodology – Regression, Scenario & Sensitivity Analysis
- 17.6 Quality Control – Four-Layer Validation Framework
- 17.7 Limitations & Standard Assumptions
- 17.8 Disclaimer
