Market Overview:
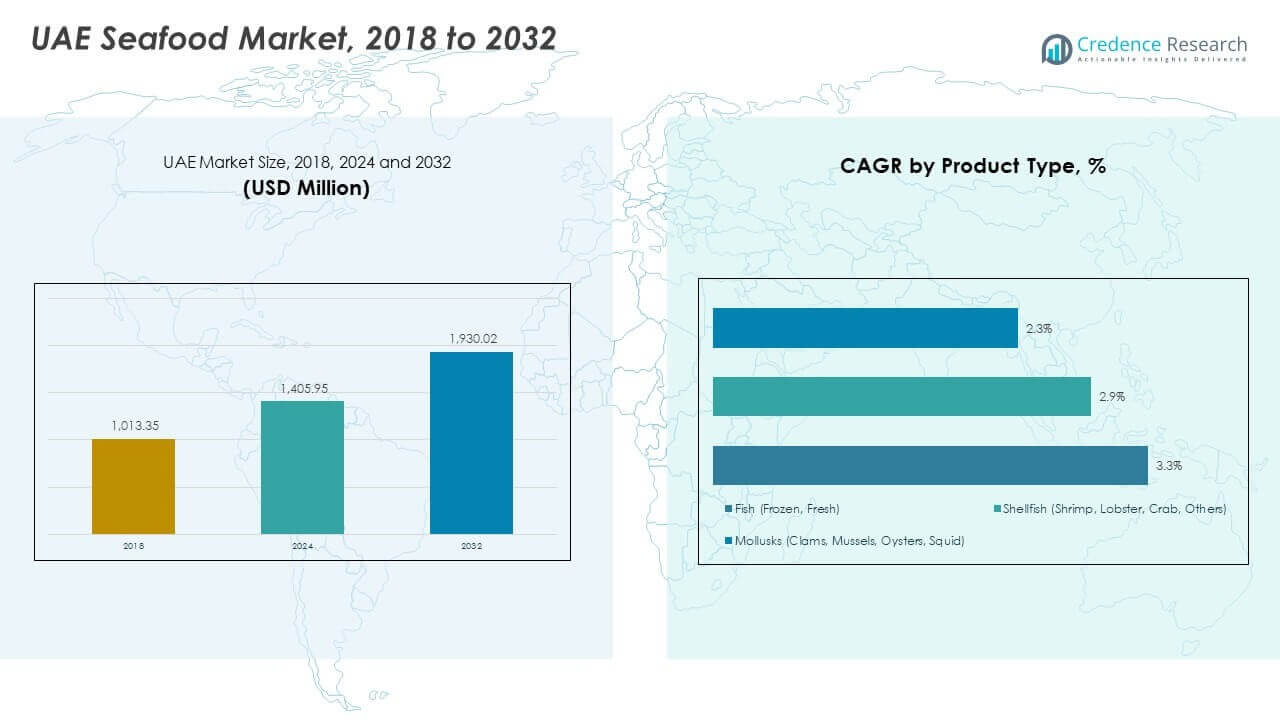
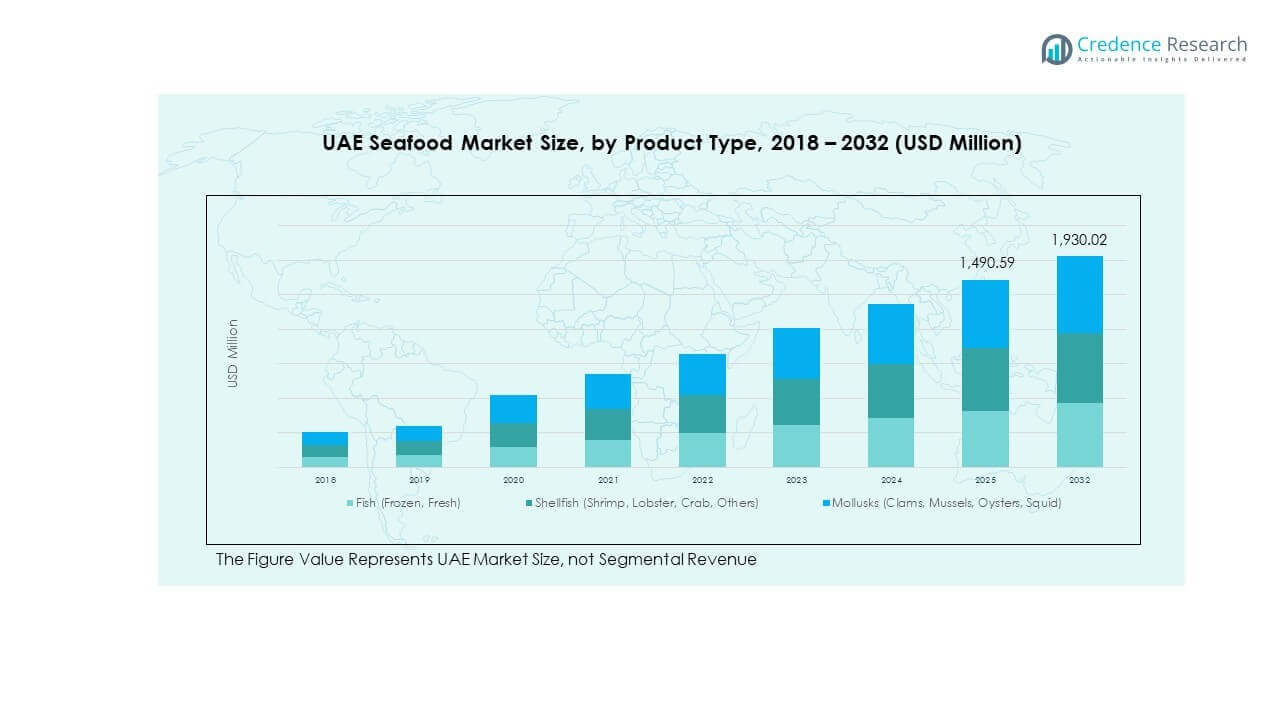
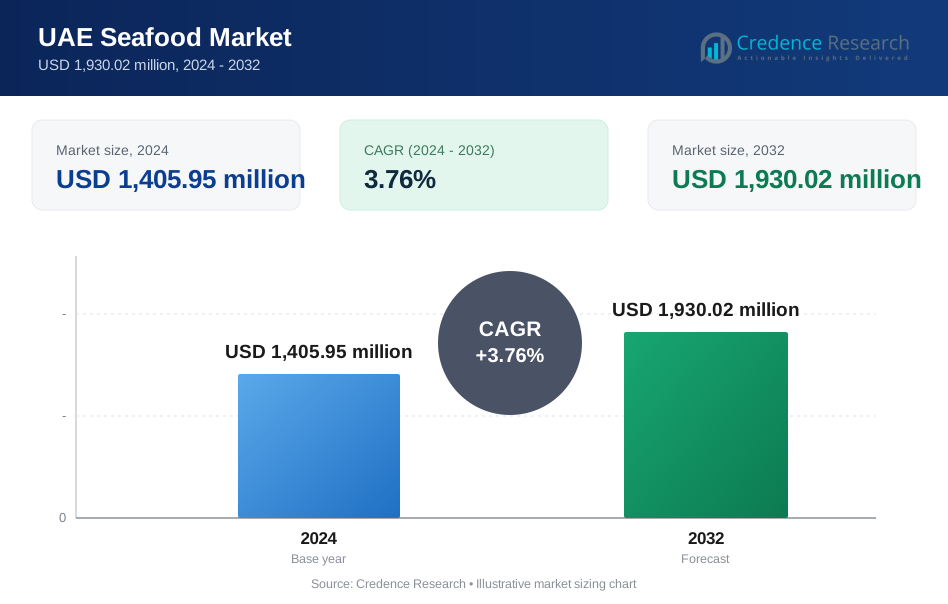
The UAE Seafood Market size was valued at USD 1,013.35 million in 2018 to USD 1,405.95 million in 2024 and is anticipated to reach USD 1,930.02 million by 2032, at a CAGR of 3.76% during the forecast period.
| REPORT ATTRIBUTE | DETAILS |
|---|---|
| Historical Period | 2020-2023 |
| Base Year | 2024 |
| Forecast Period | 2025-2032 |
| UAE Seafood Market Size 2024 | USD 1,405.95 million |
| UAE Seafood Market, CAGR | 3.76% |
| UAE Seafood Market Size 2032 | USD 1,930.02 million |
Demand rises due to strong seafood consumption habits across urban households. Population growth supports steady volume uptake across retail channels. Rising health awareness boosts preference for protein-rich diets. Hotels and restaurants increase menu variety using seafood dishes. Tourism recovery lifts foodservice demand across premium outlets. Cold chain upgrades improve product freshness and shelf life. Import diversification reduces supply risk and stabilizes availability. Retailers expand frozen and ready-to-cook options. E-commerce grocery platforms widen consumer access nationwide.
Dubai and Abu Dhabi lead demand due to dense populations and tourism activity. These emirates host premium retail and dining clusters. Sharjah follows with growing household consumption and mid-range pricing. Northern Emirates show emerging demand from urban expansion. Coastal access supports local landings in Fujairah and Ras Al Khaimah. Import hubs near ports strengthen distribution efficiency. Urban centers adopt premium and processed products faster. Smaller cities favor frozen formats for affordability and storage.
Market Insights:
- The UAE Seafood Market was valued at USD 1,013.35 million in 2018, reached USD 1,405.95 million in 2024, and is projected to attain USD 1,930.02 million by 2032, expanding at a CAGR of 3.76% due to stable consumption and supply efficiency.
- Dubai and Abu Dhabi dominate with nearly 55% share due to dense urban populations, tourism inflow, and premium retail presence, followed by Sharjah at 20% supported by household demand, while Northern Emirates hold about 15% with steady urban expansion.
- The Northern Emirates represent the fastest-growing region with an estimated 15% share, driven by infrastructure growth, port-based distribution, and rising frozen seafood adoption in mid-income households.
- By product type, fish accounts for the largest share at around 45%, supported by strong cultural preference and wide availability across fresh and frozen formats.
- Shellfish contributes nearly 30% share, while mollusks hold about 25%, with demand supported by foodservice menus, premium dining, and diversified imports.
Market Drivers:
Urban Population Expansion Supporting Consistent Seafood Consumption Patterns
Urban growth continues to support steady seafood demand across households. High income levels allow frequent seafood purchases. Cultural food habits favor fish and shellfish in daily meals. Retail outlets maintain wide seafood assortments for routine consumption. Foodservice operators rely on seafood for menu balance. Population diversity sustains demand for multiple species. This driver supports stable volume flow.
- For instance, Mowi ASA supplied over 475,000 metric tons of farmed salmon in 2023, supporting urban retail and foodservice consumption globally.
Hospitality And Tourism Sector Fueling Foodservice Seafood Demand
Tourism activity supports strong seafood usage across hotels and restaurants. Premium dining concepts depend on seafood-based menus. Event catering increases bulk seafood procurement cycles. Airline and cruise catering require regular seafood supply contracts. Restaurant chains expand seafood dishes across formats. Chef-driven menus sustain seafood relevance. This driver strengthens long-term demand stability.
Cold Chain Infrastructure Development Improving Product Quality Control
Cold storage expansion improves seafood quality across logistics networks. Temperature-controlled transport reduces spoilage risk. Retailers extend shelf life for fresh and frozen products. Importers manage sourcing from distant markets efficiently. Quality consistency supports premium product positioning. Buyers gain confidence in handling standards. This driver improves overall supply efficiency.
Import Diversification And Trade Connectivity Enhancing Supply Reliability
Trade connectivity enables access to global seafood sources. Import diversification reduces dependency on single origins. Port infrastructure supports smooth seafood inflow. Distributors manage inventory with better sourcing options. Stable imports protect against seasonal shortages. Supply planning becomes more predictable. This driver strengthens market resilience.
Market Trends:
Premiumization Of Seafood Offerings Across Retail And Foodservice Channels
Consumers show preference for premium seafood selections. Retailers highlight freshness and quality cues prominently. Foodservice outlets focus on high-grade seafood dishes. Brand positioning influences purchase behavior. Presentation and product storytelling gain importance. Premium assortments support margin improvement. This trend reshapes category positioning.
- For instance, Lerøy Seafood Group reports that while global salmon spot prices have faced volatility falling as much as NOK 30/kg year-over-year in 2025 its value-added segment continues to deliver record profits by capturing demand for specialized products across more than 80 global markets.
Expansion Of Ready-To-Cook And Portion-Controlled Seafood Products
Households prefer convenient seafood preparation options. Ready-to-cook formats reduce kitchen effort. Portion packs support controlled consumption habits. Retailers expand chilled and frozen processed lines. Food waste reduction supports buyer interest. Packaging innovation improves usability. This trend supports lifestyle alignment.
- For instance, Thai Union Group manages a global portfolio that includes a "Value-Added" segment of ready-to-cook and ready-to-serve products, which saw a 5.2% year-on-year sales increase in 2024 to support rising convenience-led consumption trends.
Digital Grocery Platforms Reshaping Seafood Purchasing Behavior
Online grocery platforms improve seafood accessibility. Home delivery supports frequent purchase cycles. Digital listings expand product visibility. Subscription models stabilize demand forecasting. Promotions influence consumer trial rates. Platform trust improves seafood adoption. This trend strengthens omnichannel presence.
Growing Emphasis On Responsible And Certified Seafood Sourcing
Buyers show awareness toward ethical sourcing practices. Certification labels influence purchase decisions. Foodservice chains adopt sourcing guidelines. Importers align procurement with sustainability norms. Responsible sourcing supports brand credibility. Long-term supply planning gains focus. This trend shapes procurement strategy.
Market Challenges Analysis:
High Dependence On Imported Seafood And Global Logistics Volatility
The UAE Seafood Market relies heavily on imported supplies. Global shipping delays affect availability cycles. Freight cost volatility pressures pricing strategies. Geopolitical disruptions impact sourcing routes. Import reliance increases lead time risks. Inventory planning becomes complex for distributors. This challenge affects supply stability.
Stringent Quality Standards And High Handling Cost Structures
Seafood distribution requires strict temperature control. Compliance raises operational cost burdens. Quality lapses risk product rejection. Smaller players face infrastructure limitations. Regulatory audits demand detailed documentation. Shelf-life sensitivity complicates stock rotation. This challenge impacts profitability margins.
Market Opportunities:
Development Of Value-Added And Locally Processed Seafood Products
Value-added seafood offers improved margin potential. Processed formats attract convenience-focused consumers. Local processing reduces import dependency. Customized products support brand differentiation. Foodservice buyers seek portion consistency. Innovation strengthens product portfolios. This opportunity expands value chains.
Rising Demand From Institutional And Contract Catering Channels
Institutional catering shows steady seafood demand. Corporate kitchens increase seafood menu inclusion. Healthcare facilities prefer protein-rich meals. Long-term contracts improve volume predictability. Standard menus support bulk procurement. Supplier relationships strengthen through compliance. This opportunity supports sustained growth.
Market Segmentation Analysis:
By Product Type
Fresh seafood holds strong preference across households and foodservice due to taste and quality perception. Urban retail outlets support daily access to chilled fish and shellfish. Frozen seafood records steady demand from price-sensitive buyers and bulk purchasers. Extended shelf life supports storage efficiency across retail and catering. Processed seafood gains traction through ready-to-cook and marinated formats. Convenience supports adoption across working households. Product diversification improves category resilience.
- For instance, Nomad Foods states its frozen seafood products maintain quality for up to 12 months under standard cold-chain storage.
By Source
Marine sources dominate supply due to established import routes and wide species availability. Coastal access supports limited local marine catch. Aquaculture expands gradually to improve supply stability. Controlled farming supports consistent quality and volume. Importers balance both sources to manage risk. Source diversity strengthens long-term availability. Sustainability focus improves aquaculture appeal.
- For instance, Norway exported over 1.2 million metric tons of farmed seafood in 2023, reinforcing aquaculture-based supply reliability.
By Distribution Channel
Modern retail leads sales through supermarkets and hypermarkets. Organized formats ensure quality control and product variety. Traditional retail retains relevance in neighborhood markets. Price flexibility supports daily purchases. Foodservice drives bulk demand across hotels and restaurants. Online channels expand reach through home delivery models. Digital platforms improve convenience and assortment visibility.
By End-Use Industry
Household consumption forms a stable demand base across income groups. Home cooking sustains regular volume movement. Hotels and restaurants rely on seafood for menu differentiation. Tourism supports premium and bulk usage patterns. Institutional catering shows consistent demand through long-term contracts. Standardized menus support predictable procurement. This mix supports balanced market structure.
Segmentation:
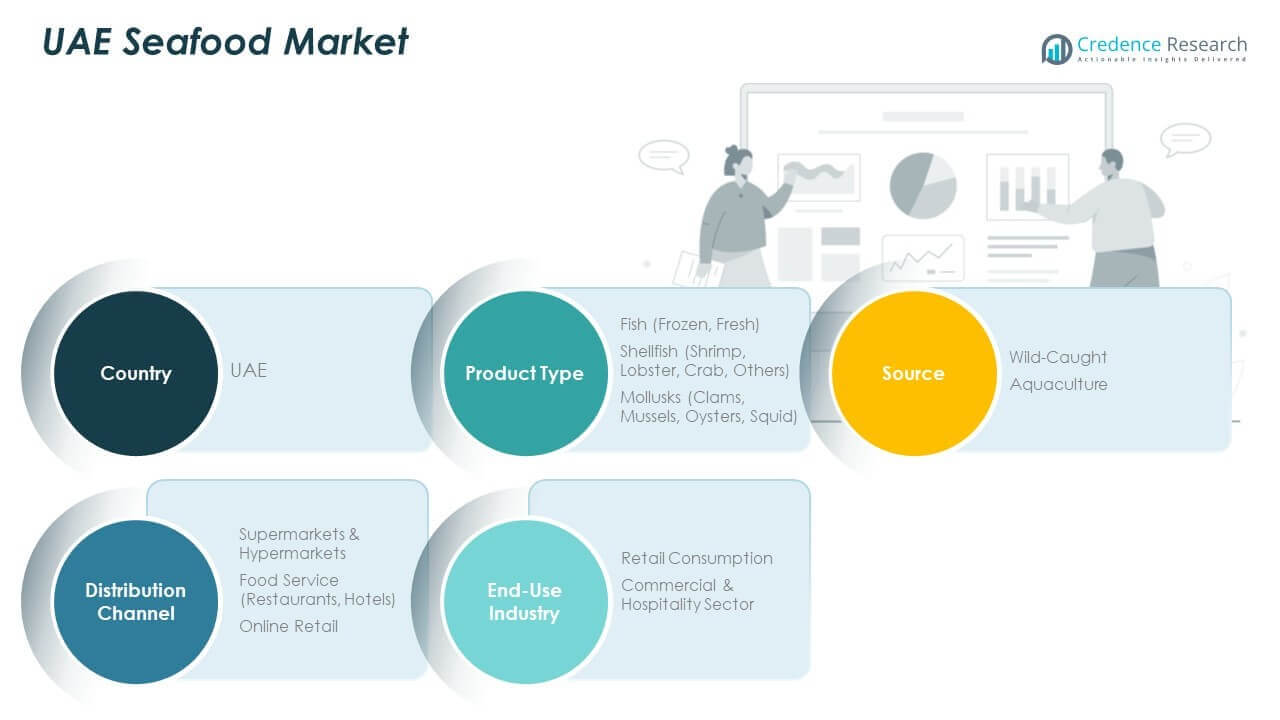
By Product Type- Fresh seafood
- Frozen seafood
- Processed seafood
- Marine
- Aquaculture
- Modern retail
- Traditional retail
- Foodservice
- Online channels
- Household consumption
- Hotels and restaurants
- Institutional catering
- Dubai
- Abu Dhabi
- Sharjah
- Northern Emirates
Regional Analysis:
Dubai And Abu Dhabi As Primary Demand And Distribution Hubs
Dubai holds the largest share of the UAE Seafood Market at around 42%. The emirate benefits from strong tourism, premium retail, and foodservice density. High expatriate population supports diverse seafood preferences. Abu Dhabi follows with nearly 28% share, supported by high household income and institutional demand. Government-backed food security initiatives strengthen supply chains. Large ports and cold storage hubs improve import efficiency. These regions drive pricing trends and product innovation.
Sharjah And Northern Emirates With Rising Consumption Base
Sharjah accounts for approximately 14% of market share due to dense residential zones. Household consumption drives steady seafood demand across retail formats. Price-sensitive buyers favor frozen and processed seafood options. Ajman, Umm Al Quwain, and Ras Al Khaimah together hold close to 10%. Urban expansion improves access to organized retail. Smaller foodservice operators support local volume demand. These regions show gradual but stable market penetration.
Fujairah And Coastal Areas Supporting Supply And Regional Balance
Fujairah represents nearly 6% of the total market share. The emirate benefits from proximity to fishing ports and marine landings. Local supply supports fresh seafood availability across nearby regions. Port access strengthens import and re-export activity. Cold chain investments improve storage and transport reliability. Coastal consumption remains steady across households and hospitality outlets. These areas support supply balance within the national market.
Key Player Analysis:
- Al Islami Foods
- Seafood Souq
- Fulton Seafood UAE
- Royal Fisheries
- Gulf Fish Trading
Competitive Analysis:
The UAE Seafood Market shows moderate consolidation with a mix of domestic processors, importers, and distributors. Leading players focus on product consistency, cold chain control, and long-term sourcing contracts. Brand reputation plays a strong role in foodservice and retail selection. Companies compete through portfolio breadth across fresh, frozen, and processed categories. Vertical integration supports cost control and supply reliability. Strategic partnerships with global fisheries strengthen import access. It remains competitive due to low switching costs and wide supplier availability.
Recent Developments:
- In January 2025, Al Islami Foods expanded its premium seafood portfolio with the launch of a new "Extra-Large Shrimps" range across the UAE market. This product line features wild-caught, hormone-free, and antibiotic-free shrimps, catering to the growing consumer demand for clean-label and high-protein dietary options (such as keto). The launch aligns with the company's "Food is Blessing" strategic positioning and reinforces its diversification beyond poultry into high-quality frozen seafood segments.
- In late 2025, Seafood Souq announced a landmark agreement with the UAE Ministry of Climate Change and Environment to digitize the nation's local fisheries sector. This strategic public-private partnership aims to create a dedicated brand for UAE-caught seafood and implement a digital traceability system that tracks local catch from "sea to spoon," significantly boosting the commercial viability and sustainability transparency of the domestic fishing industry.
- In October 2024, Al Islami Foods solidified its industry leadership by signing a Platinum Partnership with the Future Food Forum 2024, an event organized by the UAE F&B Business Group. During this strategic collaboration, the company focused on driving discussions around sustainable food solutions and innovation within the halal sector, further integrating its operations with the UAE's broader food security goals.
Report Coverage:
The research report offers an in-depth analysis based on product type, source, distribution channel, end-use industry, and region. It details leading market players, providing an overview of their business, product offerings, investments, revenue streams, and key applications. Additionally, the report includes insights into the competitive environment, SWOT analysis, current market trends, as well as the primary drivers and constraints. Furthermore, it discusses various factors that have driven market expansion in recent years. The report also explores market dynamics, regulatory scenarios, and technological advancements that are shaping the industry. It assesses the impact of external factors and global economic changes on market growth. Lastly, it provides strategic recommendations for new entrants and established companies to navigate the complexities of the market.
Future Outlook:
- Retail demand will grow through frozen and processed seafood formats.
- Foodservice recovery will sustain premium seafood consumption.
- Cold chain investments will improve quality consistency nationwide.
- Import diversification will reduce supply risk exposure.
- Sustainable sourcing will gain higher buyer preference.
- Online grocery platforms will increase seafood accessibility.
- Institutional catering will offer stable volume contracts.
- Local processing will expand to improve margin control.
- Brand-led differentiation will strengthen retail competition.
- Urban population growth will support steady demand expansion.
Request a Free Sample
Fill in your details and we'll send you a free sample report.
- Sample data tables & charts
- Research methodology
Market Dynamics
Urban Population Expansion
Rapid urbanization in Dubai, Abu Dhabi, and Sharjah is increasing seafood consumption, as dense populations and higher incomes support frequent purchases and diverse product offerings across retail and foodservice channels.
Hospitality and Tourism Sector Growth
The UAE’s robust tourism industry and premium hospitality sector drive strong demand for seafood in hotels, restaurants, and catering, with menu innovation and bulk procurement cycles supporting market expansion.
Cold Chain Infrastructure Development
Investments in cold storage and temperature-controlled logistics are improving product freshness, reducing spoilage, and enabling wider distribution of both fresh and frozen seafood, thus supporting quality consistency and market growth.
Import Diversification and Trade Connectivity
Enhanced port infrastructure and diversified import sources reduce supply risks and stabilize seafood availability, making the market more resilient to global logistics disruptions and seasonal shortages.
Premiumization and Convenience Trends
Rising consumer preference for premium, ready-to-cook, and portion-controlled seafood products is driving retailers and processors to innovate, supporting higher margins and aligning with evolving urban lifestyles.
Need a Custom Version of This Report?
Tailor the scope, geography, or segments to your exact requirements.
- Custom geography or segment scope
- Direct access to our analyst team
Frequently Asked Questions
What is the current market size for UAE Seafood Market, and what is its projected size in 2032?
At what Compound Annual Growth Rate is the UAE Seafood Market projected to grow between 2024 and 2032?
Which UAE Seafood Market segment held the largest share in 2024?
What are the primary factors fueling the growth of the UAE Seafood Market?
Who are the leading companies in the UAE Seafood Market?
Which region commanded the largest share of the UAE Seafood Market in 2024?
Table of Content
Chapter 1 Market Segmentation
- 1.1 Segmentation Framework
- 1.1.1 Product and Service Classification
- 1.1.2 Application and End-Use Classification
- 1.1.3 Technology and Solution Classification
- 1.1.4 Customer and Distribution Channel Classification
- 1.1.5 Geographic Segmentation
- 1.1.6 Market Segment Definitions and Boundaries
- 1.2 By Source
- 1.2.1 Marine
- 1.2.2 Aquaculture
- 1.3 By Product Type
- 1.3.1 Fresh seafood
- 1.3.2 Frozen seafood
- 1.3.3 Processed seafood
Chapter 2 Introduction
- 2.1 Report Objectives and Scope
- 2.2 Product Definition and Industry Terminology
- 2.3 Market Inclusions and Exclusions
- 2.4 Research Process
- 2.4.1 Primary Research and Expert Interviews
- 2.4.2 Secondary Research and Source Review
- 2.4.3 Top-Down and Bottom-Up Estimation
- 2.4.4 Data Triangulation and Verification
- 2.5 Market Size Measurement Basis
- 2.5.1 2024: USD 1,405.95 million → 2032: USD 1,930.02 million
- 2.6 Historical and Forecast Reference Periods
- 2.6.1 Base Year: 2024
- 2.6.2 Forecast Period: 2024-2032
- 2.7 Research Assumptions and Limitations
Chapter 3 Executive Summary
- 3.1 Market Snapshot and Key Findings
- 3.2 Base-Year Market Size, 2024
- 3.3 Forecast Market Size, 2032
- 3.4 Revenue and Volume Growth Outlook
- 3.5 Key Demand and Supply Indicators
- 3.6 Leading Market Segments
- 3.7 Fastest-Growing Market Opportunities
- 3.8 Regional Performance Highlights
- 3.9 Technology and Industry Transformation
- 3.10 Competitive Landscape Summary
- 3.11 Analyst View and Strategic Implications
Chapter 4 UAE Seafood Market Trends and Developments
- 4.1 Historical Industry Development
- 4.2 Recent Market Trends and Developments
- 4.3 Demand and Customer Behavior Trends
- 4.4 Technology and Product Innovation
- 4.5 Artificial Intelligence, Automation and Digitalization
- 4.6 Local Manufacturing and Supply Chain Realignment
- 4.7 Industry Partnerships, Mergers and Acquisitions
- 4.8 Sustainability and Circular Economy Developments
- 4.9 Government and Private Sector Investment Trends
- 4.10 Emerging Business Models and Commercialization
- 4.11 Industry Developments and Announcements
Chapter 5 UAE Seafood Market Production, Supply and Demand Analysis
- 5.1 Demand Trend and Consumption Analysis
- 5.2 Demand Forecast, 2024-2032
- 5.3 Production and Output Trend
- 5.4 Production and Output Forecast, 2024-2032
- 5.5 Installed Capacity and Capacity Utilization
- 5.6 Company-Wise Production Plants and Statistics
- 5.6.1 Installed Production Capacity
- 5.6.2 Actual Production
- 5.6.3 Planned Capacity and Expansion Targets
- 5.7 Supply Chain Structure and Procurement Trends
- 5.8 Supply-Demand Gap and Bottlenecks
- 5.9 Import Dependence and Sourcing Structure
- 5.10 Contract Manufacturing and Outsourcing
- 5.11 Regional Supply and Demand Concentration
Chapter 6 UAE Seafood Market Pricing Analysis
- 6.1 Pricing Structure and Measurement
- 6.2 Historical Pricing Trends
- 6.3 Pricing Outlook, 2024-2032
- 6.4 Average Selling Price and Unit Economics
- 6.5 Pricing by Product and Market Segment
- 6.6 Geographic Pricing Differences
- 6.7 Key Input, Energy, Labor and Logistics Costs
- 6.8 Contract Pricing and Purchasing Models
- 6.9 Pricing Sensitivity and Competitive Positioning
- 6.10 Price, Margin and Profitability Implications
Chapter 7 UAE Seafood Market Dynamics
- 7.1 Market Growth Drivers
- 7.1.1 Demand-Side Drivers
- 7.1.2 Technology and Innovation Drivers
- 7.1.3 Infrastructure and Investment Drivers
- 7.1.4 Regulatory and Policy Drivers
- 7.2 Market Restraints
- 7.2.1 Cost and Affordability Constraints
- 7.2.2 Technology and Adoption Barriers
- 7.2.3 Supply Chain and Operational Constraints
- 7.3 Market Challenges
- 7.3.1 Competitive Pressure and Margin Erosion
- 7.3.2 Skills, Infrastructure and Implementation Gaps
- 7.4 Emerging Market Opportunities
- 7.5 Market Dynamics Impact and Time-Horizon Assessment
Chapter 8 UAE Seafood Value Chain Analysis
- 8.1 Industry Value Chain Overview
- 8.2 Upstream Suppliers and Critical Inputs
- 8.3 Technology and Component Providers
- 8.4 Manufacturing or Service Delivery
- 8.5 Distribution, Channel Partners and Integrators
- 8.6 Downstream Applications and End Users
- 8.7 Value Addition and Profit Pools
- 8.8 Vertical Integration and Outsourcing
- 8.9 Supplier Concentration and Risk
- 8.10 Supply Chain Localization and Resilience
Chapter 9 UAE Seafood Market Regulations and Policies
- 9.1 Relevant Laws, Standards and Compliance Frameworks
- 9.2 Product, Service, Safety and Quality Requirements
- 9.3 Government Policies, Incentives and Subsidies
- 9.4 Imports, Exports and Trade Barriers
- 9.5 Public Procurement and Local Content Requirements
- 9.6 Environmental and Sustainability Compliance
- 9.7 Upcoming Policy Changes and Market Implications
Chapter 10 UAE Seafood Market Hotspots and Opportunities
- 10.1 Market Opportunity Mapping and Growth Hotspots
- 10.2 High-Growth Applications and Customer Groups
- 10.3 Underserved Markets and White-Space Opportunities
- 10.4 Emerging Technology and Product Opportunities
- 10.5 New Capacity and Investment Hotspots
- 10.6 Market Entry and Expansion Opportunities
- 10.7 Distribution and Partnership Opportunities
- 10.8 Near-Term and Long-Term Commercial Potential
- 10.9 Opportunity Attractiveness and Execution Risks
Chapter 11 UAE Seafood Market Outlook, 2024-2032
- 11.1 Market Size and Analysis
- 11.1.1 Revenue (Market Measurement: 2024: USD 1,405.95 million → 2032: USD 1,930.02 million)
- 11.1.2 Market Volume and Quantity Sold
- 11.1.3 Historical Market Size
- 11.1.4 Base-Year Market Size, 2024
- 11.2 Market Forecast, 2024-2032
- 11.2.1 Revenue Forecast to 2032
- 11.2.2 Volume Forecast to 2032
- 11.2.3 CAGR and Year-on-Year Growth
- 11.2.4 Incremental Revenue Opportunity
- 11.3 Forecast Assumptions and Scenario Analysis
- 11.3.1 Base-Case Forecast
- 11.3.2 Optimistic and Conservative Scenarios
- 11.3.3 Technology, Pricing and Policy Sensitivities
- 11.4 Market Attractiveness and Growth Outlook
Chapter 12 UAE Seafood Market Segmentation and Outlook
- 12.1 Segmentation Summary and Market Shares, 2024
- 12.2 Largest and Fastest-Growing Segments
- 12.3 By Source - Market Size and Forecast, 2024-2032
- 12.3.1 Segment Definition and Scope
- 12.3.2 Historical Market Size
- 12.3.3 Revenue Forecast, 2024-2032
- 12.3.4 Volume Forecast, 2024-2032
- 12.3.5 Base-Year Market Share, 2024
- 12.3.6 Segment CAGR and Growth Drivers
- 12.3.7 Subsegment Market Size and Forecast
- 12.3.7.1 Marine
- 12.3.7.2 Aquaculture
- 12.3.8 Subsegment Pricing and Adoption Trends
- 12.3.9 Leading Suppliers and Competition
- 12.3.10 Regional Demand and Opportunities
- 12.4 By Product Type - Market Size and Forecast, 2024-2032
- 12.4.1 Segment Definition and Scope
- 12.4.2 Historical Market Size
- 12.4.3 Revenue Forecast, 2024-2032
- 12.4.4 Volume Forecast, 2024-2032
- 12.4.5 Base-Year Market Share, 2024
- 12.4.6 Segment CAGR and Growth Drivers
- 12.4.7 Subsegment Market Size and Forecast
- 12.4.7.1 Fresh seafood
- 12.4.7.2 Frozen seafood
- 12.4.7.3 Processed seafood
- 12.4.8 Subsegment Pricing and Adoption Trends
- 12.4.9 Leading Suppliers and Competition
- 12.4.10 Regional Demand and Opportunities
- 12.5 Segment Growth Comparison
- 12.6 Segment Attractiveness and Priority Matrix
Chapter 13 UAE Seafood Geographic Market Outlook, 2024-2032
- 13.1 Domestic Market Distribution and Demand Clusters
- 13.2 State- or Province-Wise Market Size and Forecast, 2024-2032
- 13.3 City and Metropolitan Market Outlook
- 13.4 Industrial, Manufacturing and Commercial Clusters
- 13.5 Geographic Concentration of Key End Users
- 13.6 Local Pricing and Purchasing Differences
- 13.7 Domestic Production Facilities and Capacity Map
- 13.8 Local Infrastructure and Project Pipeline
- 13.9 State-Level Policy and Incentive Differences
- 13.10 Subnational Investment Hotspots and Opportunities
- 13.11 Distribution and Logistics Networks
- 13.12 Domestic Competitive Footprint
Chapter 14 UAE Seafood Technology, Innovation and Sustainability Outlook
- 14.1 Technology Landscape and Maturity
- 14.2 Product, Process and Service Innovation
- 14.3 AI, Automation and Digital Tools in the Industry
- 14.4 Technology Adoption and Performance Benchmarking
- 14.5 Innovation Pipeline and R&D Investment
- 14.6 Patent and Intellectual Property Trends
- 14.7 Energy Efficiency and Resource Management
- 14.8 Sustainability, Recycling and Circularity
- 14.9 Technology Roadmap, 2024-2032
- 14.10 Risks of Obsolescence and Technology Substitution
Chapter 15 UAE Seafood Market Key Strategic Imperatives
- 15.1 Growth and Market Entry Priorities
- 15.2 High-Return Products and Segments
- 15.3 Pricing, Profitability and Cost Optimization
- 15.4 Technology Investment and Product Differentiation
- 15.5 Supply Chain Localization and Resilience
- 15.6 Distribution and Customer Acquisition
- 15.7 Partnership, Acquisition and Capacity Strategy
- 15.8 Regional Expansion Priorities
- 15.9 Short-, Medium- and Long-Term Actions
Chapter 16 Competition Outlook
- 16.1 Industry Competition Characteristics
- 16.2 Market Structure and Concentration
- 16.3 Market Share and Competitive Positioning, 2024
- 16.4 Company-Wise Revenue and Product Benchmarking
- 16.5 Production and Service Capacity Benchmarking
- 16.6 Technology, Pricing and Differentiation
- 16.7 Regional Footprint and Distribution Strength
- 16.8 Mergers, Acquisitions and Strategic Alliances
- 16.9 New Entrants and Competitive Threats
- 16.10 Porter's Five Forces and Industry Attractiveness
- 16.11 Competitive Outlook, 2024-2032
Chapter 17 Company Profiles
- 17.1 Company Coverage and Selection Criteria
- 17.2 Al Islami Foods
- 17.2.1 Business Description
- 17.2.2 Company Ownership and Geographic Presence
- 17.2.3 Product and Service Portfolio
- 17.2.4 Manufacturing and Operating Footprint
- 17.2.5 Production Capacity and Expansion Plans
- 17.2.6 Financial Performance and Investment
- 17.2.7 Market Share and Competitive Position
- 17.2.8 Technology and Innovation Capabilities
- 17.2.9 Strategic Alliances or Partnerships
- 17.2.10 Recent Developments
- 17.2.11 Growth Strategy and Outlook
- 17.3 Seafood Souq
- 17.4 Fulton Seafood UAE
- 17.5 Royal Fisheries
- 17.6 Gulf Fish Trading
- 17.7 Al Mayar Seafood
- 17.8 Al Safa Foods
- 17.9 Al Kabeer Group
- 17.10 Emirates Fish Farms
- 17.11 Al Marsa Fisheries
- 17.12 Other Relevant Market Participants
Note: Every listed company is profiled on the structure shown under the first company. The company list is preliminary and may change based on research findings, market developments, data availability and client requirements.
Chapter 18 Disclaimer
- 18.1 Research and Forecast Disclaimer
- 18.2 Data Source and Estimation Limitations
Note: The depth of individual sections depends on data availability for this market. Volume, capacity, trade and other unit-based metrics are included where applicable.