| REPORT ATTRIBUTE |
DETAILS |
| Historical Period |
2020-2023 |
| Base Year |
2024 |
| Forecast Period |
2025-2032 |
| Global Upper Limb Prosthetics Market Size 2024 |
USD 733.53 Million |
| Global Upper Limb Prosthetics Market, CAGR |
5.21% |
| Global Upper Limb Prosthetics Market Size 2032 |
USD 1,098.17 Million |
Market Overview:
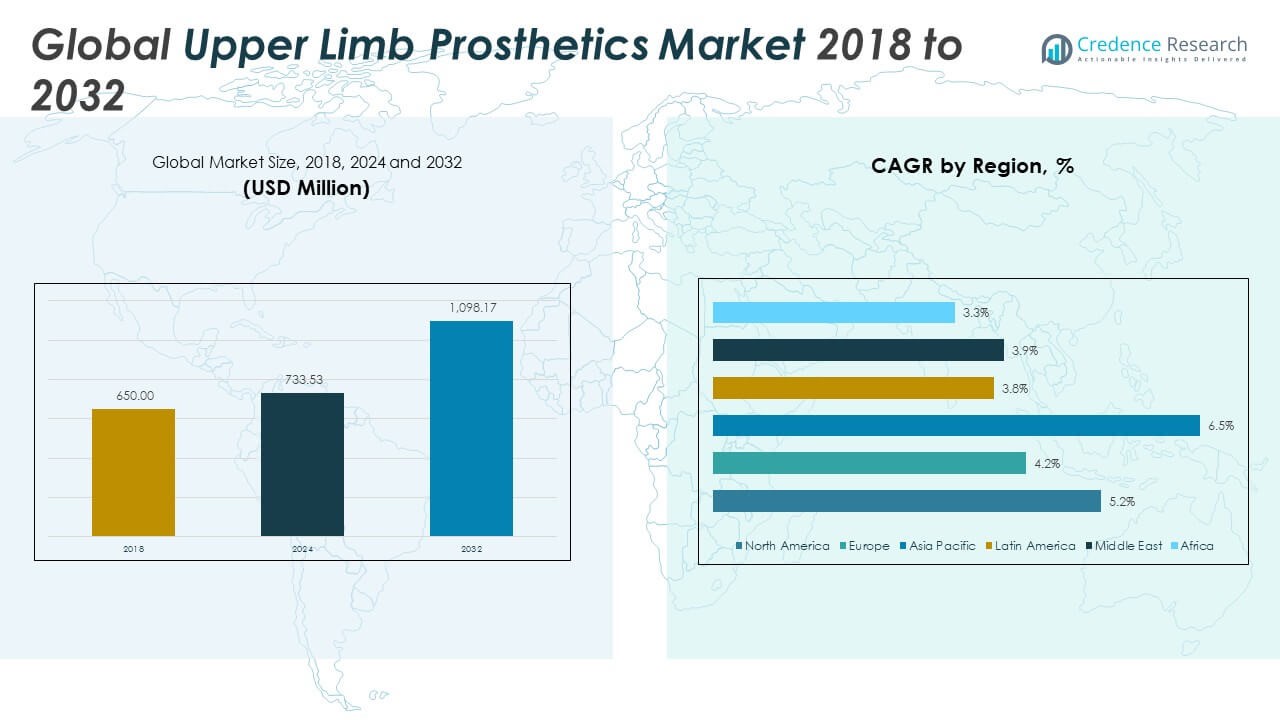
The Global Upper Limb Prosthetics Market size was valued at USD 650.00 million in 2018 to USD 733.53 million in 2024 and is anticipated to reach USD 1,098.17 million by 2032, at a CAGR of 5.21% during the forecast period.
Several factors are propelling the growth of the upper limb prosthetics market. Rising numbers of trauma cases from road accidents, military injuries, industrial hazards, and natural disasters have significantly increased the global prevalence of upper limb amputations. Furthermore, the growing incidence of vascular disorders, diabetes-related complications, and cancer-related surgeries continues to expand the potential user base. Technological advancements play a central role in market expansion, with innovations such as myoelectric prostheses, bionic arms, sensory feedback systems, and 3D-printed custom prosthetics transforming user experiences. These devices offer enhanced dexterity, reduced fatigue, and more intuitive control, improving the quality of life for amputees. Additionally, favorable reimbursement policies in high-income regions, coupled with expanding prosthetic care infrastructure and patient rehabilitation programs, are improving accessibility and affordability. While cost remains a limiting factor, especially in low-income regions, ongoing R&D and partnerships between governments and private companies are helping bridge the gap and accelerate adoption globally.
Regionally, North America holds the largest share of the global upper limb prosthetics market, accounting for over 40% of total revenue. The region benefits from a well-established healthcare infrastructure, high awareness, and strong presence of key manufacturers and research institutions. The U.S., in particular, leads in innovation and deployment of advanced prosthetic technologies. Europe follows closely, with countries like Germany, the UK, and France investing in smart prosthetics and offering robust reimbursement coverage. Asia-Pacific is anticipated to be the fastest-growing regional market over the next decade, driven by large patient populations, increasing healthcare investments, and growing incidences of trauma-related amputations. Countries such as China, India, and Japan are emerging as key growth hubs, supported by rising demand for cost-effective, locally manufactured prosthetics. Meanwhile, Latin America and the Middle East & Africa represent smaller but steadily expanding markets, spurred by improvements in medical infrastructure, rising awareness, and support from global aid programs and NGOs focused on rehabilitative care.
Access crucial information at unmatched prices!
Request your sample report today & start making informed decisions powered by Credence Research Inc.!
Download Sample
Market Insights:
- The market was valued at USD 650.00 million in 2018, reached USD 733.53 million in 2024, and is projected to grow at a CAGR of 5.21% to reach USD 1,098.17 million by 2032.
- Rising cases of road accidents, military injuries, industrial trauma, and diabetes-related amputations are significantly increasing the global demand for upper limb prosthetics.
- Technological advancements such as myoelectric systems, bionic limbs, AI-driven interfaces, and 3D-printed prosthetics are enhancing comfort, control, and user satisfaction.
- Growing availability of specialized rehabilitation clinics, along with structured reimbursement systems in North America and Europe, is boosting adoption rates.
- High device costs, inconsistent insurance coverage, and long-term maintenance expenses are major barriers to access, especially in low- and middle-income countries.
- The Asia-Pacific region is witnessing the fastest growth, driven by large patient populations, improving healthcare infrastructure, and a push for affordable, locally produced devices.
- Increasing focus on user-centric design and independent living is shaping the market, with prosthetics now enabling greater social, occupational, and psychological reintegration.
Market Drivers:
Rising Incidence of Limb Loss Due to Trauma, Disease, and Congenital Conditions:
One of the primary growth drivers of the Global Upper Limb Prosthetics Market is the increasing prevalence of limb loss caused by trauma, chronic disease, and congenital anomalies. Road traffic accidents, workplace injuries, and armed conflict continue to contribute significantly to traumatic upper limb amputations, particularly in low- and middle-income countries. In parallel, the global rise in diabetes and vascular diseases has led to a growing number of amputations due to complications such as critical limb ischemia and infections. Cancer treatments and surgical interventions for tumors in the arm and shoulder regions also account for a sizable share of limb loss cases. Congenital limb deficiencies further add to the patient pool requiring prosthetic support from an early age. The combination of traumatic and medical causes is expanding the target population steadily, supporting consistent demand for prosthetic solutions.
- For instance, Össur reported that its prosthetic solutions are used by over 2 million people worldwide, with the company supporting more than 100,000 new upper limb prosthetic fittings annually, reflecting the growing demand driven by both traumatic and medical causes.
Technological Innovations Enhancing Functionality, Comfort, and User Experience:
Advancements in materials science, electronics, and biomechanics are transforming the capabilities of modern upper limb prosthetics. New-generation devices incorporate myoelectric sensors, robotics, and AI-driven control systems, offering users greater precision, strength, and lifelike movement. These systems enable more natural functionality through intuitive muscle signal interpretation and real-time feedback mechanisms. Lightweight materials such as carbon fiber and thermoplastics are improving comfort and durability, while modular components offer better customization. 3D printing has emerged as a scalable, cost-effective method to produce prosthetic limbs tailored to individual anatomical needs. The Global Upper Limb Prosthetics Market benefits significantly from this wave of innovation, making it more attractive to both healthcare providers and end-users.
- For instance, Ottobock’s bebionic hand features 14 grip patterns and positions, and its myoelectric technology allows users to perform complex tasks. The device weighs as little as 390 grams and can lift up to 45 kilograms, demonstrating significant advancements in both functionality and user experience.
Supportive Clinical Infrastructure and Expanding Reimbursement Landscape:
The development of specialized rehabilitation centers, prosthetic clinics, and orthopedic services is improving patient access to prosthetic solutions. In high-income regions such as North America and Western Europe, structured reimbursement policies are reducing the financial burden on amputees, encouraging adoption of advanced prosthetics. Government programs, military veteran care initiatives, and private insurance schemes support the purchase and maintenance of prosthetic limbs. Efforts to expand insurance coverage in developing regions are also gaining traction, supported by NGOs and public health partnerships. It is witnessing stronger integration into multidisciplinary care pathways that emphasize long-term patient outcomes. These systemic improvements are reinforcing the market’s foundation for sustained growth.
Growing Focus on Restoring Independence and Enhancing Quality of Life:
A shift in patient expectations is driving the demand for more functional and aesthetically appealing prosthetic devices. Amputees are seeking solutions that restore not only mobility but also confidence, self-reliance, and occupational engagement. Rehabilitation programs now focus on full psychosocial reintegration, encouraging use of prosthetics in daily routines, sports, and workplace activities. Manufacturers are responding by developing prosthetics that blend mechanical performance with user-centric design. The Global Upper Limb Prosthetics Market reflects this evolution, offering solutions that enable amputees to regain autonomy and participate fully in society. It is increasingly positioned as a critical enabler of inclusive and independent living for a growing global population.
Market Trends:
Integration of Wearable Technology and Smart Interfaces into Prosthetic Designs:
A key trend shaping the Global Upper Limb Prosthetics Market is the integration of wearable technologies and smart interfaces to enhance connectivity and control. Developers are embedding Bluetooth, wireless sensors, and mobile app interfaces into prosthetic limbs to allow real-time monitoring and fine-tuning. These connected systems enable users and clinicians to adjust grip strength, movement range, or calibration settings remotely through smartphones or tablets. Smart feedback systems also allow users to track performance metrics, battery life, and device usage patterns, enhancing user engagement. Such innovations reflect the broader trend toward digital health and personalized device ecosystems. It is moving toward more intelligent, interactive prosthetics that blend hardware functionality with digital capabilities.
- For instance, the TASKA Hand, developed by TASKA Prosthetics, features Bluetooth connectivity and a dedicated mobile app, allowing users to customize grip patterns and monitor device status. The hand is water-resistant (IP67 rated) and supports over 23 grip options, providing advanced digital integration for daily use.
Adoption of Modular and Interchangeable Components for Greater Customization:
The growing demand for tailored prosthetic solutions is driving the shift toward modular and interchangeable component systems. Manufacturers are designing prosthetic arms and hands with detachable elements, allowing users to switch between components based on daily needs or preferences. This flexibility includes swappable terminal devices, adjustable wrist and elbow joints, and task-specific tools that can be integrated easily. The modular approach reduces the need for multiple devices while increasing functionality for diverse activities. It also streamlines the repair and replacement process, improving device longevity and cost efficiency. The Global Upper Limb Prosthetics Market is seeing wider adoption of this trend across both premium and economy segments.
- For instance, Steeper Group’s Espire Elbow series offers five different models with modular design, allowing users to interchange components such as powered and passive elbows, and integrate various terminal devices, supporting a wide range of activities and user preferences.
Focus on Pediatric Prosthetics and Age-Specific Product Development:
Another emerging trend is the growing emphasis on pediatric upper limb prosthetics and solutions tailored for younger age groups. Children with congenital limb differences or early-life amputations require specialized prosthetic limbs that accommodate their physical growth and developmental milestones. Manufacturers are responding with lightweight, colorful, and easy-to-use devices that evolve in complexity as the child grows. Pediatric prosthetics now often include gamified training systems and sensory aids that help children adapt to prosthetic use more comfortably. This trend reflects a broader focus on long-term patient engagement starting at a younger age. It is prompting the Global Upper Limb Prosthetics Market to develop segmented offerings aligned with specific age groups.
Emergence of Direct-to-Consumer Sales Channels and Online Customization Platforms:
Direct-to-consumer (DTC) sales models and digital customization platforms are gaining traction in the prosthetics space. Startups and established players alike are building online tools that allow patients to co-design or pre-select features, colors, and fits from home. Virtual fitting systems, digital limb scanning, and cloud-based ordering portals are reducing the dependence on in-person consultations. These channels offer greater convenience and speed, particularly in underserved or remote areas. It is evolving beyond the traditional clinic-based delivery model, embracing e-commerce and digital services to reach a wider audience. The Global Upper Limb Prosthetics Market is adapting to consumer expectations shaped by broader retail and healthcare trends.
Market Challenges Analysis:
High Cost of Advanced Prosthetic Devices Limits Accessibility Across Income Segments:
One of the most significant challenges in the Global Upper Limb Prosthetics Market is the high cost associated with advanced prosthetic systems, particularly myoelectric and bionic devices. These solutions often range from thousands to tens of thousands of dollars, creating a substantial financial burden for patients, especially in low- and middle-income regions. Insurance coverage is often limited or inconsistent, leading many users to opt for lower-functionality or outdated alternatives. Maintenance and component replacement costs further increase the long-term expense, discouraging widespread adoption. The economic divide remains a barrier, with high-end technologies disproportionately benefiting users in developed healthcare systems. The market faces pressure to create affordable yet high-performing alternatives that balance innovation with scalability.
Lack of Skilled Professionals and Rehabilitation Infrastructure Hampers Long-Term Adoption:
The limited availability of trained prosthetists, therapists, and rehabilitation specialists is a persistent challenge affecting patient outcomes and device usage. Successful adoption of upper limb prosthetics requires comprehensive rehabilitation and user training, which is often lacking in rural or under-resourced areas. Without proper fitting, education, and follow-up care, users may abandon prosthetic use due to discomfort, poor functionality, or unrealistic expectations. This issue also affects clinical trial recruitment and post-market surveillance, limiting data collection on real-world performance. The Global Upper Limb Prosthetics Market continues to grapple with the uneven distribution of care infrastructure, which hinders consistent service delivery and patient satisfaction. Building workforce capacity and expanding decentralized rehabilitation services remain critical for broader market growth.
Market Opportunities:
Expansion of Prosthetic Access in Emerging Markets Presents Untapped Growth Potential:
Rising healthcare investments and improved insurance frameworks in emerging economies are creating new avenues for market expansion. Countries across Asia-Pacific, Latin America, and parts of Africa are prioritizing assistive technology as part of national health strategies. Government initiatives, NGO programs, and public-private partnerships are helping to expand access to prosthetic care in underserved regions. Local manufacturing, combined with low-cost 3D printing technologies, is enabling affordable product development tailored to regional needs. The Global Upper Limb Prosthetics Market stands to benefit significantly from these developments by expanding its geographic footprint and addressing previously unmet clinical demand. It can achieve broader inclusion by aligning product offerings with local affordability and infrastructure.
Development of Neuroprosthetics and Brain-Computer Interfaces Unlocks Future Capabilities:
Innovations in neuroprosthetics and brain-computer interfaces (BCIs) are creating opportunities to redefine the capabilities of upper limb prosthetics. Research in direct neural integration and cognitive control mechanisms is advancing rapidly, supported by academic and commercial R&D funding. These technologies promise enhanced sensory feedback, intuitive motion control, and a more natural user experience. Early-stage clinical trials show encouraging outcomes, indicating long-term commercial viability. It positions the Global Upper Limb Prosthetics Market at the frontier of human-machine interface innovation. Companies that invest early in these high-tech solutions can capture first-mover advantages in a segment with strong long-term growth potential.
Market Segmentation Analysis:
By Component
The component segment of the Global Upper Limb Prosthetics Market includes prosthetic arms, elbows, wrists, shoulders, and others. The prosthetic arm holds the dominant share due to its extensive application in both partial and full upper limb amputations. Prosthetic elbows and wrists are widely used for restoring joint mobility and functional independence. The prosthetic shoulder segment is witnessing growth due to emerging powered shoulder technologies that improve range of motion. The “others” category includes terminal devices and adaptive attachments designed for task-specific use.
- For instance, the College Park Espire Pro Elbow features a powered elbow joint with a 300-degree range of motion, a weight limit of 11.3 kg, and a removable 3,000 mAh battery designed for all-day use. The device is compatible with most terminal devices and can be programmed for user-specific needs.
By Product Type
The product type segment comprises passive prosthetic devices, body-powered prosthetics, myoelectric prosthetic devices, and hybrid prosthetics. Myoelectric prosthetics lead the market due to their advanced functionality, intuitive control, and improved aesthetics. Body-powered prosthetics remain popular for their cost-effectiveness and mechanical reliability. Passive devices fulfill cosmetic and basic support needs, particularly among older adults or individuals with low activity requirements. Hybrid prosthetic devices are gaining interest for blending mechanical and electrical components to deliver improved performance in varied conditions.
- For instance, the i-Limb Quantum by Össur is a myoelectric prosthetic hand that allows users to perform up to 36 different grip patterns, with gesture control and Bluetooth-enabled customization, representing the advanced capabilities of modern myoelectric devices.
By End-user
The end-user segment includes hospitals, clinics, and others. Hospitals account for the largest share owing to their role in surgery, rehabilitation, and advanced prosthetic fitting. Clinics are expanding their presence, especially in suburban and urban outpatient care networks offering follow-up and customization services. The “others” segment includes specialized rehabilitation centers, defense hospitals, and non-profit facilities that cater to veterans, trauma patients, and underserved communities. The Global Upper Limb Prosthetics Market continues to evolve across these segments with rising demand for personalized and accessible prosthetic care.

Segmentation:
By Component
- Prosthetic Arm
- Prosthetic Elbow
- Prosthetic Wrist
- Prosthetic Shoulder
- Others
By Product Type
- Passive Prosthetic Devices
- Body Powered Prosthetic Devices
- Myoelectric Prosthetic Devices
- Hybrid Prosthetic Devices
By End-user
By Region
- North America
- Europe
- Germany
- France
- U.K.
- Italy
- Spain
- Rest of Europe
- Asia Pacific
- China
- Japan
- India
- South Korea
- South-east Asia
- Rest of Asia Pacific
- Latin America
- Brazil
- Argentina
- Rest of Latin America
- Middle East & Africa
- GCC Countries
- South Africa
- Rest of the Middle East and Africa
Regional Analysis:
North America
The North America Upper Limb Prosthetics Market size was valued at USD 297.05 million in 2018 to USD 331.99 million in 2024 and is anticipated to reach USD 496.48 million by 2032, at a CAGR of 5.2% during the forecast period. North America holds the largest share of the Global Upper Limb Prosthetics Market, accounting for over 45% of global revenue. Strong healthcare infrastructure, widespread insurance coverage, and high public awareness drive market expansion. The U.S. leads regional growth, supported by technological innovation, specialized rehabilitation centers, and active participation of companies like Össur, Ottobock, and COAPT. Veteran care programs and trauma recovery initiatives contribute to sustained demand. It benefits from high adoption of myoelectric and hybrid prosthetics due to strong reimbursement and clinical training systems.
Europe
The Europe Upper Limb Prosthetics Market size was valued at USD 128.57 million in 2018 to USD 137.59 million in 2024 and is anticipated to reach USD 190.59 million by 2032, at a CAGR of 4.2% during the forecast period. Europe ranks second in market share, supported by advanced medical technologies and government-backed reimbursement frameworks. Germany, the UK, and France drive regional adoption through integrated orthopedic services and rehabilitation pathways. Research and development in smart prosthetics and personalized components fuel competitive innovation. It continues to benefit from collaborations between public health systems and private manufacturers. Steady investment in healthcare and accessibility initiatives ensures long-term growth across both public and private sectors.
Asia Pacific
The Asia Pacific Upper Limb Prosthetics Market size was valued at USD 153.14 million in 2018 to USD 180.78 million in 2024 and is anticipated to reach USD 299.69 million by 2032, at a CAGR of 6.5% during the forecast period. Asia Pacific is the fastest-growing regional market, driven by a large amputee population, growing trauma cases, and rising healthcare investments. China, India, and Japan lead demand with increasing focus on affordable and locally manufactured prosthetic solutions. It sees rapid adoption of 3D printing and low-cost myoelectric systems, especially in urban hospitals and research centers. Public-private initiatives are enhancing prosthetic access across both rural and urban populations. The region is emerging as a critical hub for scalable innovation and value-based prosthetic care.
Latin America
The Latin America Upper Limb Prosthetics Market size was valued at USD 28.28 million in 2018 to USD 31.46 million in 2024 and is anticipated to reach USD 42.14 million by 2032, at a CAGR of 3.8% during the forecast period. Latin America holds a modest share of the Global Upper Limb Prosthetics Market, with Brazil and Mexico leading regional demand. Expanding trauma care, increasing awareness, and gradual improvements in healthcare infrastructure are supporting growth. NGOs and international aid programs play a key role in delivering low-cost prosthetic services. It is gradually adopting myoelectric and hybrid prosthetics in urban centers with specialized facilities. Continued government support for disability inclusion programs will be key to unlocking broader access.
Middle East
The Middle East Upper Limb Prosthetics Market size was valued at USD 25.29 million in 2018 to USD 26.77 million in 2024 and is anticipated to reach USD 36.25 million by 2032, at a CAGR of 3.9% during the forecast period. The Middle East market is growing steadily, supported by demand for trauma and war-related rehabilitation solutions. GCC countries are investing in advanced prosthetic clinics and smart healthcare infrastructure. Israel and Turkey are contributing to innovation through research institutions and partnerships with global manufacturers. It shows potential for expansion in premium prosthetic segments due to rising income levels and increasing adoption of digital health solutions. Public healthcare funding and targeted rehabilitation programs continue to shape demand in the region.
Africa
The Africa Upper Limb Prosthetics Market size was valued at USD 17.68 million in 2018 to USD 24.94 million in 2024 and is anticipated to reach USD 33.02 million by 2032, at a CAGR of 3.3% during the forecast period. Africa represents the smallest regional share but offers long-term potential due to high unmet clinical need and increasing public health efforts. Countries like South Africa, Egypt, and Kenya are expanding rehabilitation services and introducing local manufacturing solutions. NGOs and non-profits remain critical in delivering prosthetic care, especially in conflict-affected and underserved areas. It faces challenges including cost barriers and workforce shortages but is gradually improving access through mobile clinics and international support. Strategic investment in infrastructure and training could accelerate growth across this emerging market.
Shape Your Report to Specific Countries or Regions & Enjoy 30% Off!
Key Player Analysis:
- Össur
- Ottobock
- Steeper Group
- Fillauer LLC
- Open Bionics
- COAPT LLC
- Mobius Bionics
- Protunix
- Motorica
Competitive Analysis:
The Global Upper Limb Prosthetics Market is highly competitive, driven by innovation, strategic partnerships, and expanding global reach. Key players include Össur, Ottobock, Steeper Group, Fillauer LLC, and Open Bionics, each offering advanced prosthetic solutions with strong R&D capabilities. Companies are focusing on developing user-centric devices that integrate myoelectric control, AI-based feedback, and modular components. Startups like COAPT LLC and Mobius Bionics are challenging traditional players with adaptive technologies and affordable designs. The market is witnessing increased collaboration between manufacturers, rehabilitation centers, and academic institutions to accelerate product development and clinical validation. It favors companies that can balance technological performance with affordability and scalability across both developed and emerging markets. Competitive advantage is closely tied to innovation pipelines, regulatory approvals, and geographic distribution capabilities. Players are also investing in localized production and after-sales support to strengthen customer relationships and address regional market dynamics effectively.
Recent Developments:
- In April 2025, Open Bionics launched the Hero RGD and Hero PRO bionic hands, setting a new benchmark in the field. These new models are the world’s first fully wireless and waterproof bionic arms, offering twice the speed of leading competitors and 360-degree wrist rotation. The launch followed four years of R&D and feedback from over 1,000 Hero Arm users. Open Bionics also expanded its clinical presence in the U.S. and continued its partnership with Hanger Clinic to make the Hero Arm available nationwide.
- In April 2025, Ottobock led a $19 million Series A funding round for Phantom Neuro, a neurotechnology company developing minimally invasive neural interfaces for intuitive prosthetic limb control. This partnership aims to accelerate the commercialization of Phantom X, a robotic control platform for lifelike prosthetic movement. Furthermore, in July 2024, Ottobock acquired Sahva A/S, a leading orthopaedic technology provider in Denmark, strengthening its presence in Scandinavia. Ottobock also announced the planned sale of its Human Mobility unit in June 2025 to focus on core prosthetics and orthotics operations.
- In February 2025, Fillauer LLC, in partnership with Coapt, launched the Myo/One Electrode System—a streamlined, waterproof EMG electrode system designed to simplify and enhance myoelectric prosthetic fittings. The system reduces setup time and improves reliability for upper limb prosthetic users. Fillauer also continued to expand its range of activity-specific devices and prosthetic accessories throughout 2025.
- In February 2025, Hanger, Inc. announced the acquisition of COAPT LLC, a leader in myoelectric pattern recognition technology for upper-limb prostheses. This move is expected to broaden access to intuitive prosthetic control for users. Additionally, in January 2025, the Centers for Medicare & Medicaid Services (CMS) approved a new reimbursement code (L6700) for myoelectric pattern recognition modules, expanding insurance coverage for advanced prosthetic control systems developed by COAPT.
Market Concentration & Characteristics:
The Global Upper Limb Prosthetics Market exhibits moderate to high market concentration, with a few dominant players such as Össur, Ottobock, and Fillauer LLC controlling a significant share of global revenue. It is characterized by strong technological differentiation, long product development cycles, and a high degree of specialization. Barriers to entry remain substantial due to regulatory requirements, clinical validation protocols, and the need for advanced R&D capabilities. The market favors companies with integrated supply chains, robust distribution networks, and ongoing investment in innovation. Customization, patient comfort, and device functionality are key product characteristics driving competition. The presence of emerging startups and regional manufacturers is introducing price-sensitive alternatives, but leading firms retain an edge through proprietary technologies and global brand recognition.
Report Coverage:
The research report offers an in-depth analysis based on component, product type, and end-user. It details leading market players, providing an overview of their business, product offerings, investments, revenue streams, and key applications. Additionally, the report includes insights into the competitive environment, SWOT analysis, current market trends, as well as the primary drivers and constraints. Furthermore, it discusses various factors that have driven market expansion in recent years. The report also explores market dynamics, regulatory scenarios, and technological advancements that are shaping the industry. It assesses the impact of external factors and global economic changes on market growth. Lastly, it provides strategic recommendations for new entrants and established companies to navigate the complexities of the market.
Future Outlook:
- Advancements in neuroprosthetics and brain-computer interface technologies are expected to redefine functional capabilities.
- Increasing demand for personalized and modular prosthetic solutions will drive product innovation.
- Growth in aging populations and chronic disease incidence will expand the potential user base.
- Wider adoption of 3D printing will support cost-effective customization and faster production cycles.
- Emerging markets in Asia-Pacific and Africa will offer new revenue streams through localized manufacturing and access programs.
- Integration of AI and machine learning will enhance prosthetic responsiveness and real-time adaptability.
- Public and private partnerships are likely to strengthen rehabilitation infrastructure and service delivery.
- Direct-to-consumer models and online fitting platforms will improve accessibility and user engagement.
- Expansion of insurance coverage and reimbursement policies will support broader adoption of advanced devices.
- Sustainability and recyclable materials may gain traction in product design and regulatory compliance.


